| Param | Original file | Final file |
|---|---|---|
| Filename | modeM0/AS1A13_094T02_9000006190_46244cztM0_level2.fits | modeM0/AS1A13_094T02_9000006190_46244cztM0_level2_quad_clean.evt |
| Size (bytes) | 479,842,560 | 106,381,440 |
| Size | 457.6 MB | 101.5 MB |
| Events in quadrant A | 6,065,884 | 694,498 |
| Events in quadrant B | 4,395,376 | 726,168 |
| Events in quadrant C | 3,073,694 | 709,720 |
| Events in quadrant D | 3,728,064 | 642,470 |
| Mode SS | |||
|---|---|---|---|
| Quadrant | BADHDUFLAG | Total packets | Discarded packets |
| A | 0 | 128 | 0 |
| B | 0 | 128 | 0 |
| C | 0 | 128 | 0 |
| D | 0 | 128 | 0 |
| Mode M0 | |||
|---|---|---|---|
| Quadrant | BADHDUFLAG | Total packets | Discarded packets |
| A | 0 | 22542 | 0 |
| B | 0 | 17566 | 0 |
| C | 0 | 13837 | 0 |
| D | 0 | 15623 | 0 |
| Mode M9 | |||
|---|---|---|---|
| Quadrant | BADHDUFLAG | Total packets | Discarded packets |
| A | 0 | 11 | 0 |
| B | 0 | 11 | 0 |
| C | 0 | 11 | 0 |
| D | 0 | 11 | 0 |
| Quadrant | Total seconds | Saturated seconds | Saturation percentage |
|---|---|---|---|
| A | 6433 | 263 | 4.088295% |
| B | 6434 | 161 | 2.502331% |
| C | 6434 | 126 | 1.958346% |
| D | 6434 | 201 | 3.124029% |
Noise dominated data is calculated using 1-second bins in cleaned event files. If a bin has >2000 counts, and if more than 50% of those come from <1% of pixels, then it is considered to be noise-dominated and hence unusable.
| Quadrant | # 1 sec bins | Bins with >0 counts | Bins with >2000 counts | High rate bins dominated by noise | Noise dominated (total time) | Noise dominated (detector-on time) | Marked lightcurve |
|---|---|---|---|---|---|---|---|
| A | 7483 | 6433 | 30 | 30 | 0.40% | 0.47% | 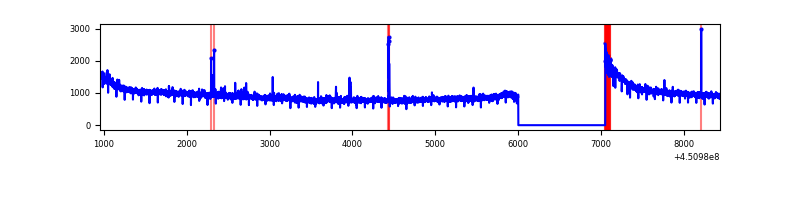 |
| B | 7484 | 6434 | 30 | 30 | 0.40% | 0.47% | 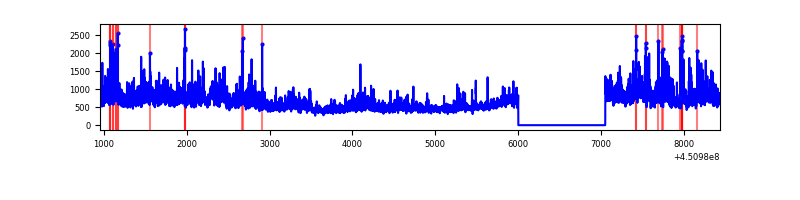 |
| C | 7483 | 6433 | 47 | 47 | 0.63% | 0.73% | 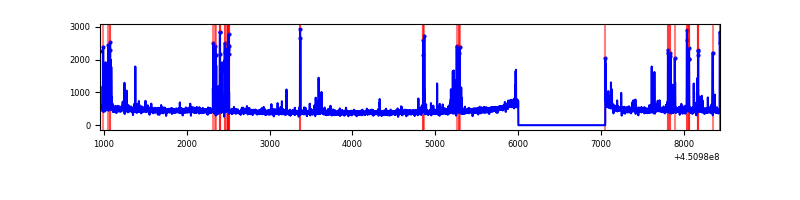 |
| D | 7484 | 6434 | 127 | 127 | 1.70% | 1.97% | 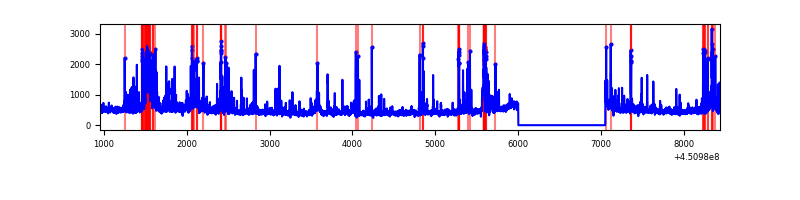 |
Top three noisy pixels from each quadrant. If the there are fewer than three noisy pixels in the level2.evt file, extra rows are filled as -1
| Pixel properties | Quadrant properties | ||||||
|---|---|---|---|---|---|---|---|
| Quadrant | DetID | PixID | Counts | Sigma | Mean | Median | Sigma |
| A | 10 | 83 | 3259451 | 22112.1 | 705 | 689 | 147.4 |
| A | 14 | 235 | 27653 | 182.96 | 705 | 689 | 147.4 |
| A | 13 | 248 | 20023 | 131.19 | 705 | 689 | 147.4 |
| B | 3 | 112 | 1293079 | 9553.22 | 708 | 687 | 135.3 |
| B | 4 | 171 | 149123 | 1097.22 | 708 | 687 | 135.3 |
| B | 5 | 32 | 63968 | 467.76 | 708 | 687 | 135.3 |
| C | 12 | 2 | 280215 | 1711.16 | 705 | 708 | 163.3 |
| C | 3 | 9 | 20051 | 118.42 | 705 | 708 | 163.3 |
| C | 1 | 3 | 6751 | 37.0 | 705 | 708 | 163.3 |
| D | 12 | 1 | 366105 | 2095.81 | 702 | 680 | 174.4 |
| D | 13 | 249 | 223854 | 1279.96 | 702 | 680 | 174.4 |
| D | 12 | 233 | 116009 | 661.44 | 702 | 680 | 174.4 |
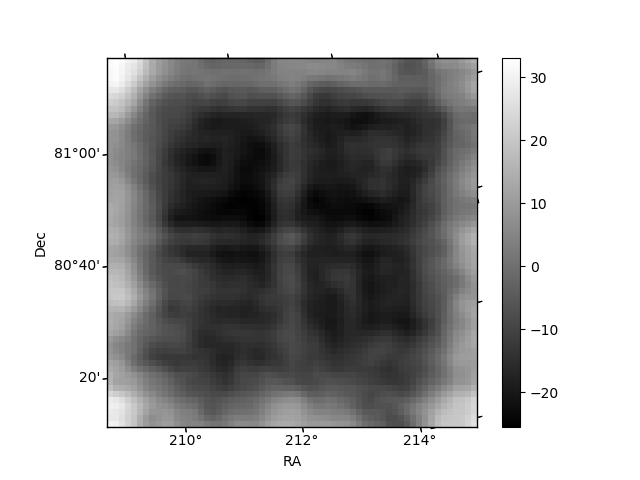
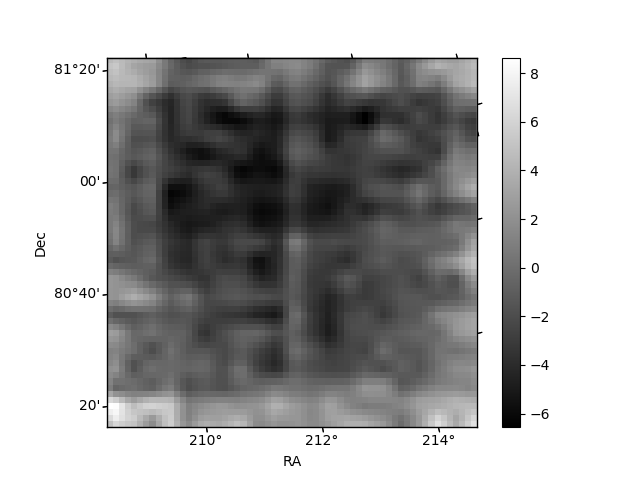
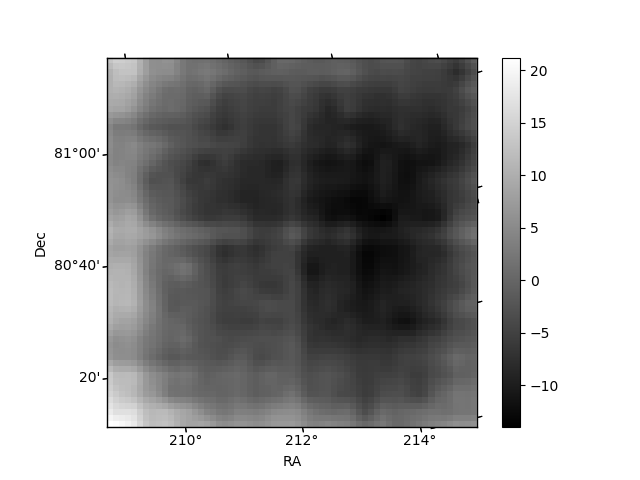
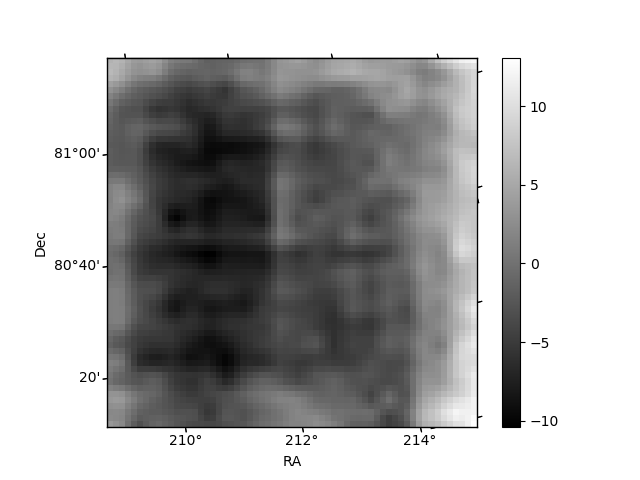
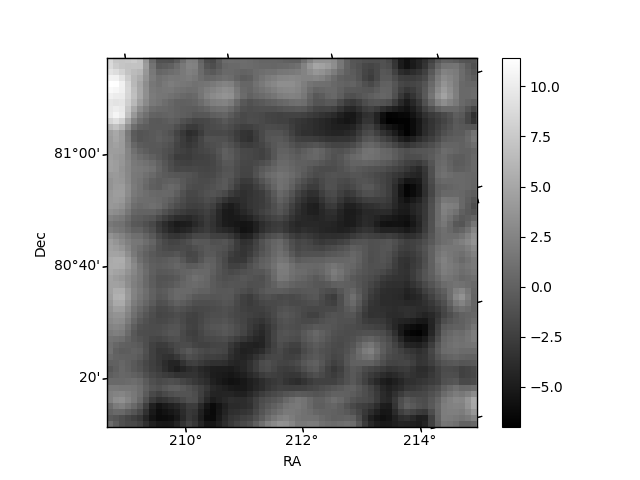
Histogram calculated using DETX and DETY for each event in the final _common_clean file
| Quadrant A | 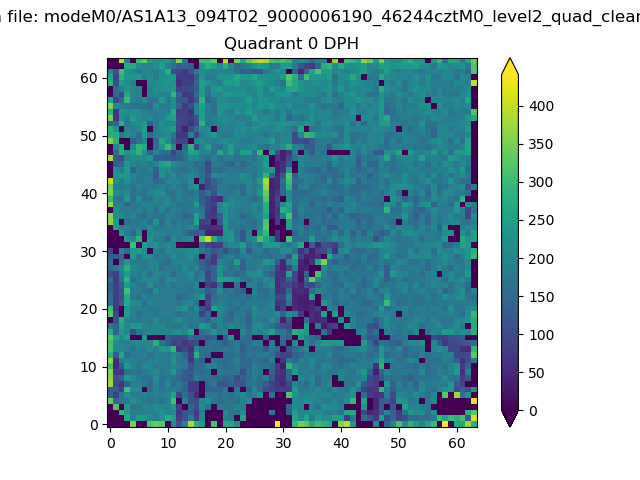 |
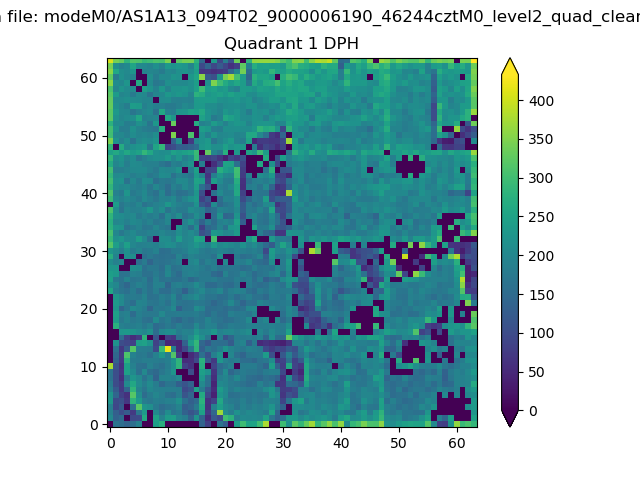 |
Quadrant B |
|---|---|---|---|
| Quadrant D | 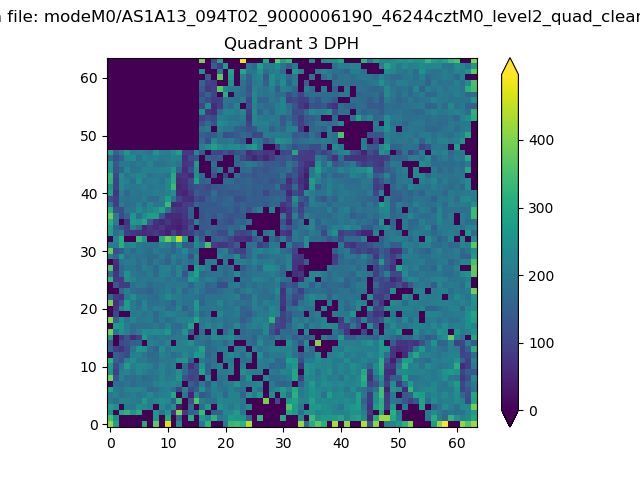 |
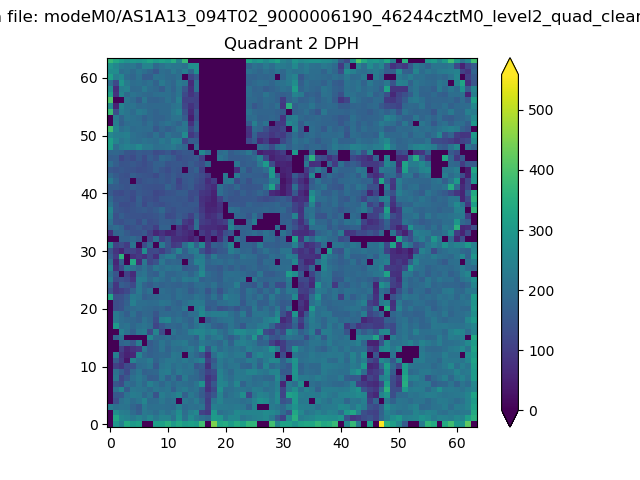 |
Quadrant C |
| Plot type | Count rate plots | Images |
|---|---|---|
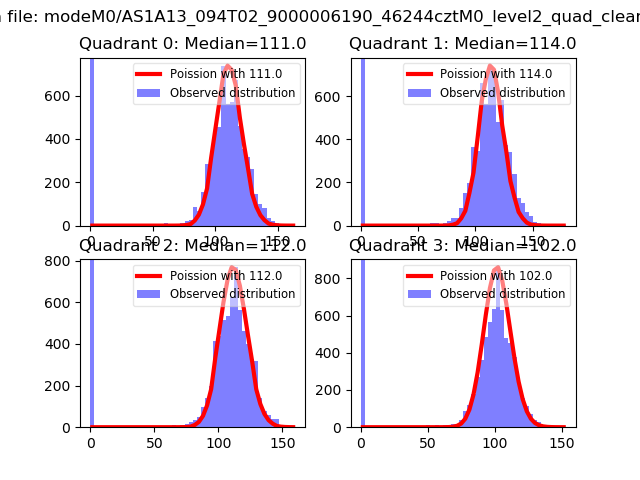
| Comparison with Poisson distribution Blue bars denote a histogram of data divided into 1 sec bins. Red curve is a Poisson curve with rate = median count rate of data. |
 |
 |
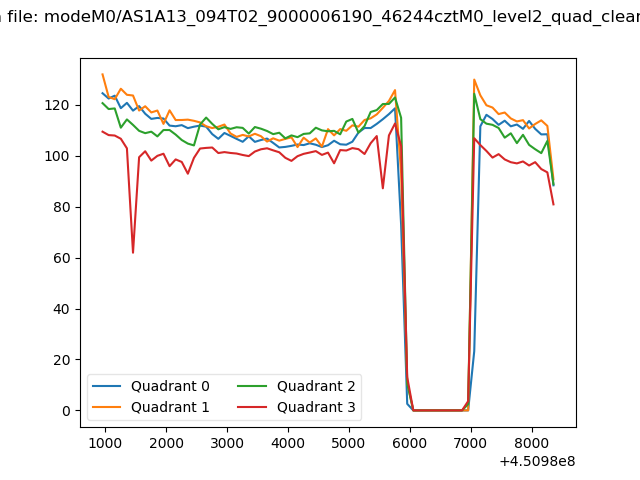
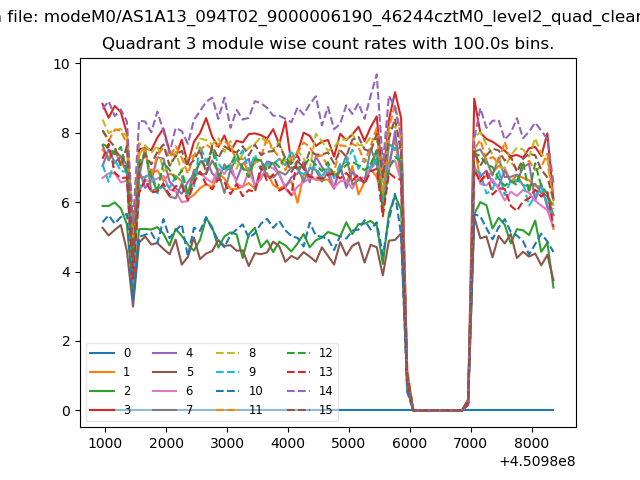
| Quadrant-wise count rates Data is divided into 100 sec bins |
 |
|
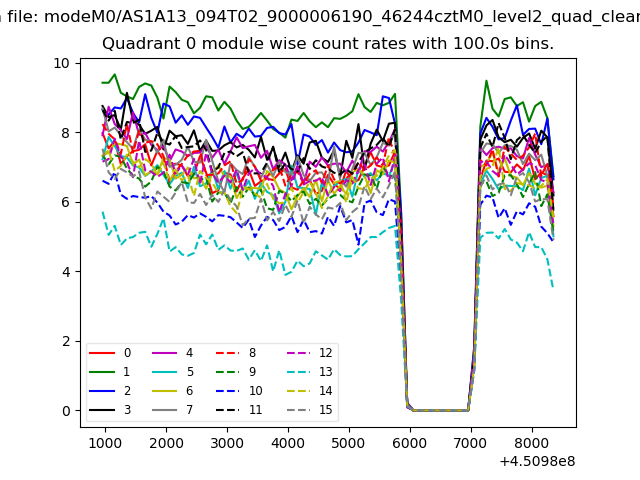
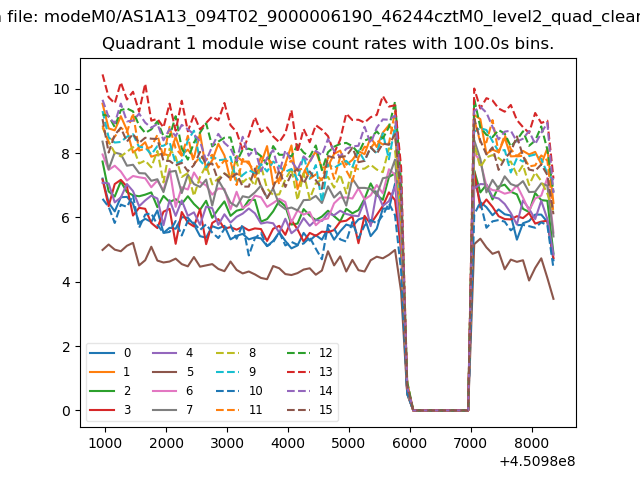
| Module-wise count rates for Quadrant A Data is divided into 100 sec bins |
 |
 |
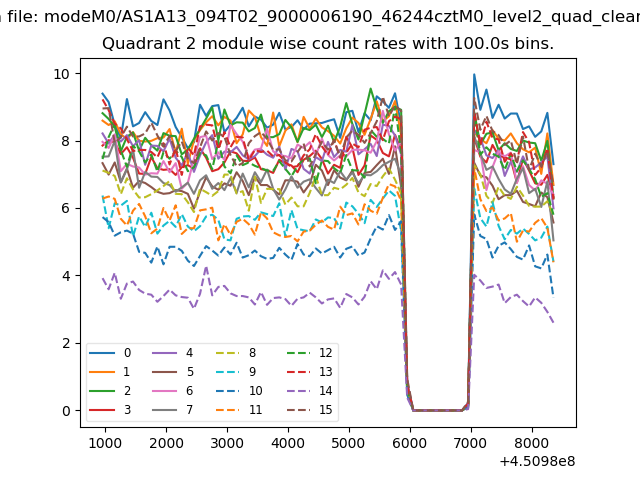
| Module-wise count rates for Quadrant B Data is divided into 100 sec bins |
 |
 |
| Module-wise count rates for Quadrant C Data is divided into 100 sec bins |
 |
 |
| Module-wise count rates for Quadrant D Data is divided into 100 sec bins |
 |
 |
| Parameter | Plot |
|---|---|
| CZT HV Monitor | 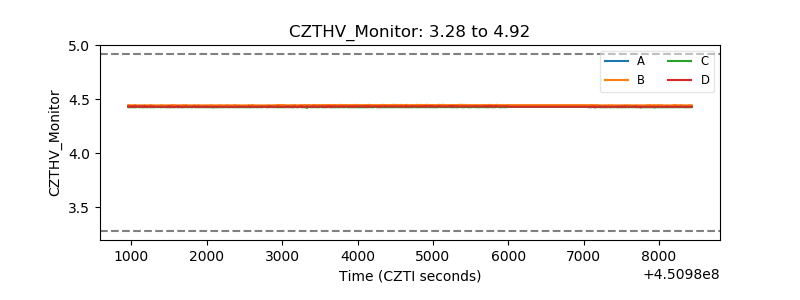 |
| D_VDD | 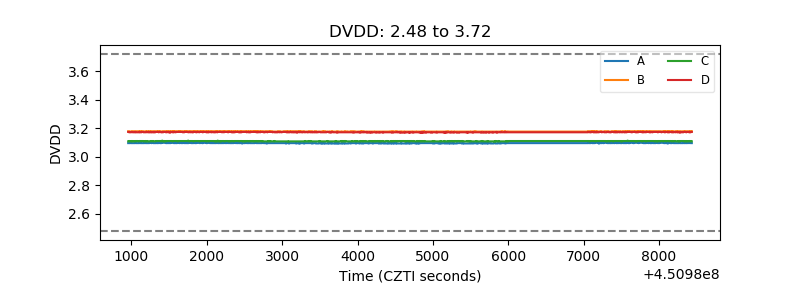 |
| Temperature 1 | 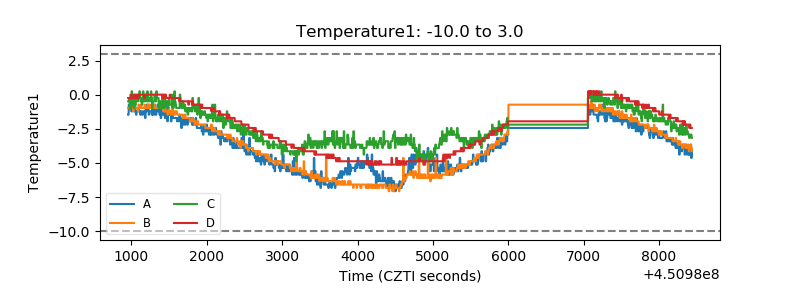 |
| Veto HV Monitor | 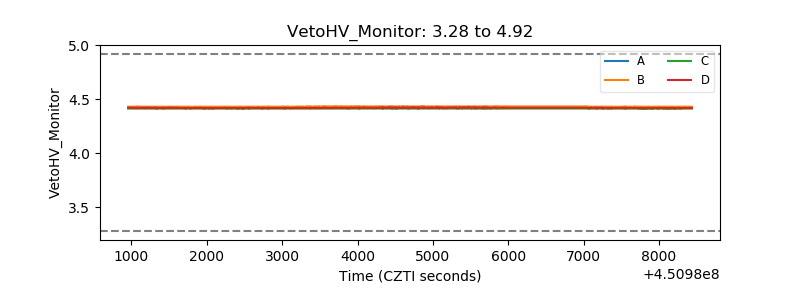 |
| Veto LLD | 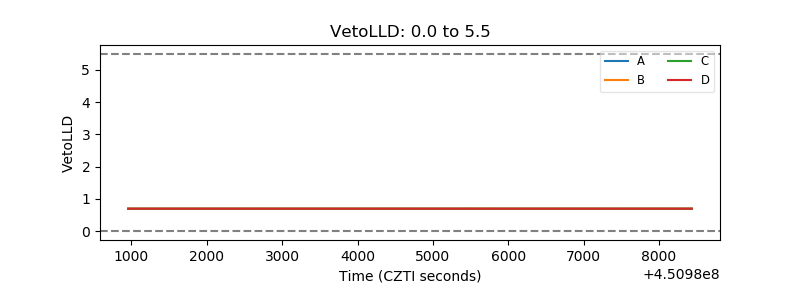 |
| Alpha Counter | 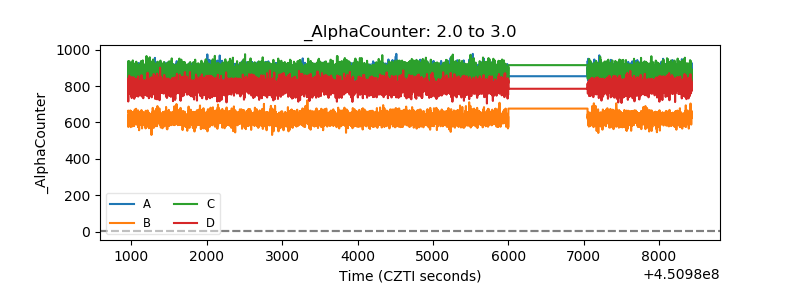 |
| _CPM_Rate | 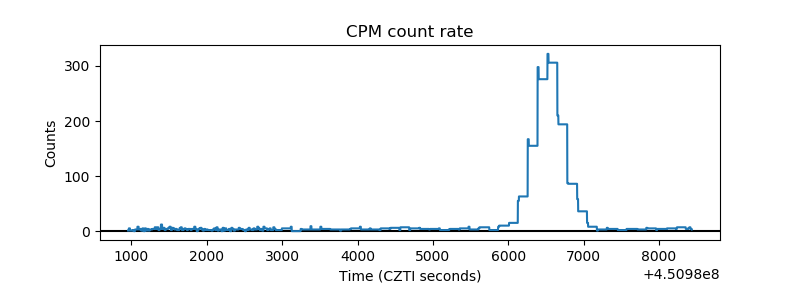 |
| CZT Counter | 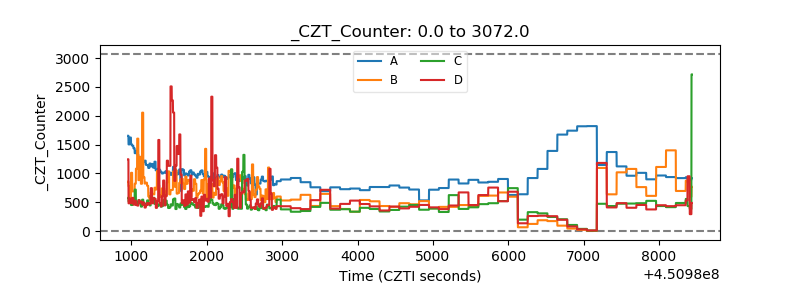 |
| +2.5 Volts monitor | 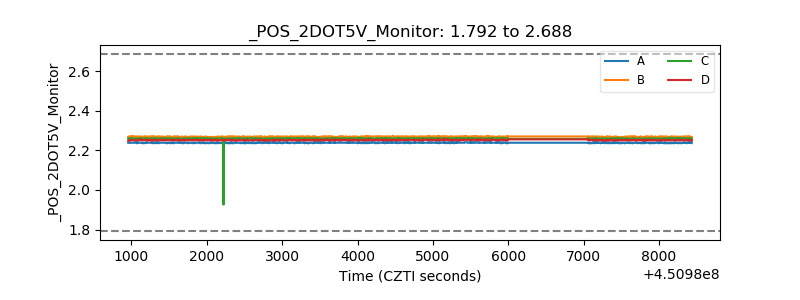 |
| +5 Volts monitor | 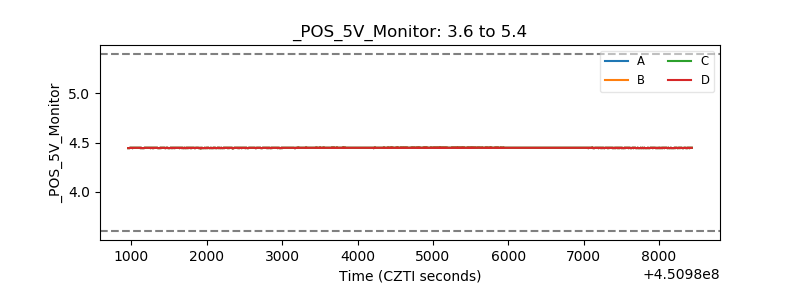 |
| _ROLL_ROT | 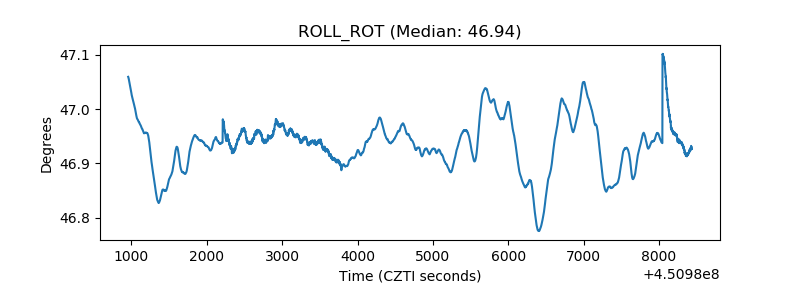 |
| _Roll_DEC | 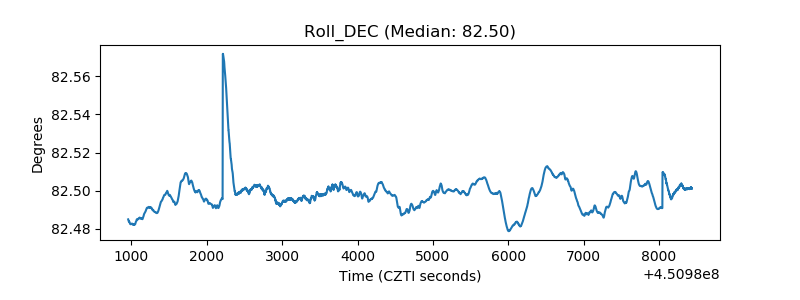 |
| _Roll_RA | 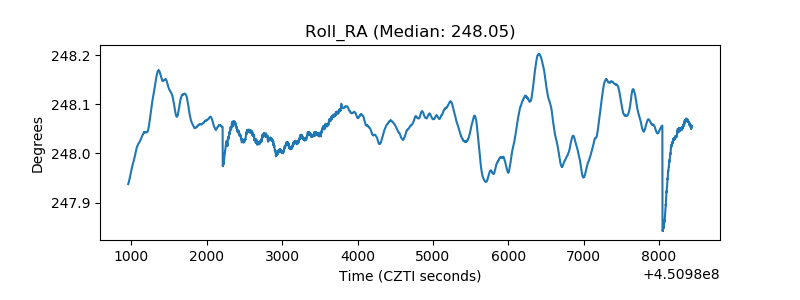 |
| Veto Counter | 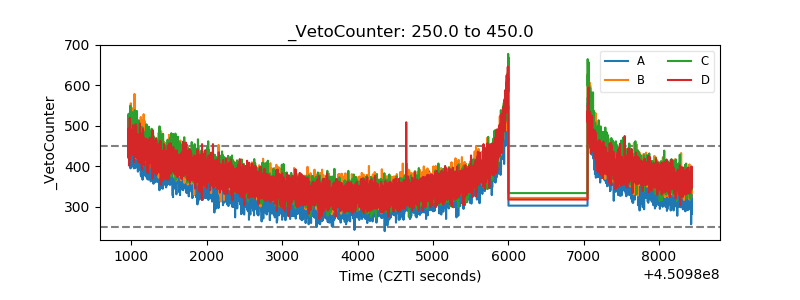 |