| Param | Original file | Final file |
|---|---|---|
| Filename | modeM0/AS1A13_072T02_9000006194_46302cztM0_level2.fits | modeM0/AS1A13_072T02_9000006194_46302cztM0_level2_quad_clean.evt |
| Size (bytes) | 498,211,200 | 112,896,000 |
| Size | 475.1 MB | 107.7 MB |
| Events in quadrant A | 6,438,618 | 742,127 |
| Events in quadrant B | 4,158,511 | 781,760 |
| Events in quadrant C | 3,188,604 | 747,047 |
| Events in quadrant D | 4,132,664 | 677,020 |
| Mode M9 | |||
|---|---|---|---|
| Quadrant | BADHDUFLAG | Total packets | Discarded packets |
| A | 0 | 10 | 0 |
| B | 0 | 10 | 0 |
| C | 0 | 10 | 0 |
| D | 0 | 10 | 0 |
| Mode M0 | |||
|---|---|---|---|
| Quadrant | BADHDUFLAG | Total packets | Discarded packets |
| A | 0 | 23588 | 2 |
| B | 0 | 16750 | 2 |
| C | 0 | 14101 | 2 |
| D | 0 | 16931 | 2 |
| Mode SS | |||
|---|---|---|---|
| Quadrant | BADHDUFLAG | Total packets | Discarded packets |
| A | 0 | 138 | 0 |
| B | 0 | 138 | 0 |
| C | 0 | 138 | 0 |
| D | 0 | 138 | 0 |
| Quadrant | Total seconds | Saturated seconds | Saturation percentage |
|---|---|---|---|
| A | 6750 | 375 | 5.555556% |
| B | 6750 | 199 | 2.948148% |
| C | 6750 | 110 | 1.629630% |
| D | 6751 | 242 | 3.584654% |
Noise dominated data is calculated using 1-second bins in cleaned event files. If a bin has >2000 counts, and if more than 50% of those come from <1% of pixels, then it is considered to be noise-dominated and hence unusable.
| Quadrant | # 1 sec bins | Bins with >0 counts | Bins with >2000 counts | High rate bins dominated by noise | Noise dominated (total time) | Noise dominated (detector-on time) | Marked lightcurve |
|---|---|---|---|---|---|---|---|
| A | 7725 | 6751 | 18 | 18 | 0.23% | 0.27% | 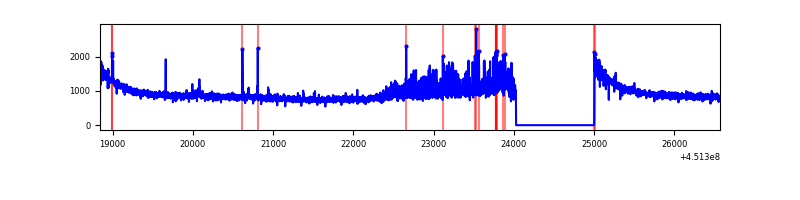 |
| B | 7725 | 6751 | 27 | 27 | 0.35% | 0.40% | 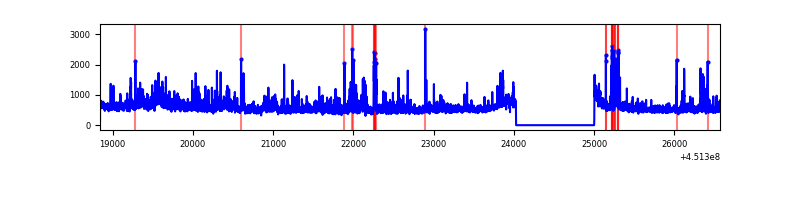 |
| C | 7725 | 6751 | 7 | 7 | 0.09% | 0.10% | 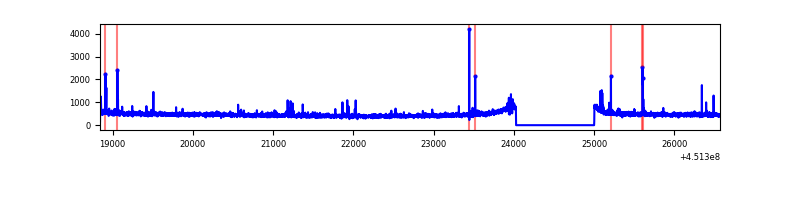 |
| D | 7726 | 6752 | 110 | 110 | 1.42% | 1.63% | 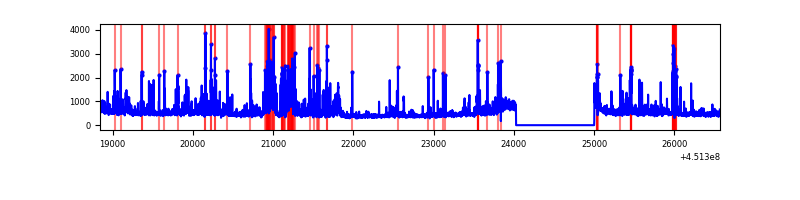 |
Top three noisy pixels from each quadrant. If the there are fewer than three noisy pixels in the level2.evt file, extra rows are filled as -1
| Pixel properties | Quadrant properties | ||||||
|---|---|---|---|---|---|---|---|
| Quadrant | DetID | PixID | Counts | Sigma | Mean | Median | Sigma |
| A | 10 | 83 | 2864374 | 17354.24 | 790 | 774 | 165.0 |
| A | 15 | 223 | 493090 | 2983.58 | 790 | 774 | 165.0 |
| A | 9 | 191 | 15134 | 87.03 | 790 | 774 | 165.0 |
| B | 3 | 112 | 717090 | 4620.54 | 785 | 760 | 155.0 |
| B | 4 | 171 | 237576 | 1527.53 | 785 | 760 | 155.0 |
| B | 5 | 255 | 47430 | 301.03 | 785 | 760 | 155.0 |
| C | 12 | 2 | 78987 | 419.92 | 788 | 792 | 186.2 |
| C | 14 | 67 | 10287 | 50.99 | 788 | 792 | 186.2 |
| C | 12 | 250 | 9342 | 45.91 | 788 | 792 | 186.2 |
| D | 1 | 52 | 795855 | 4054.02 | 783 | 760 | 196.1 |
| D | 13 | 249 | 193535 | 982.92 | 783 | 760 | 196.1 |
| D | 13 | 171 | 73435 | 370.55 | 783 | 760 | 196.1 |
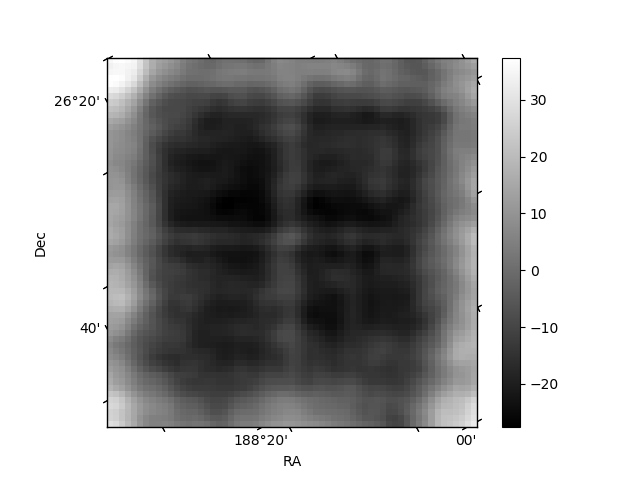
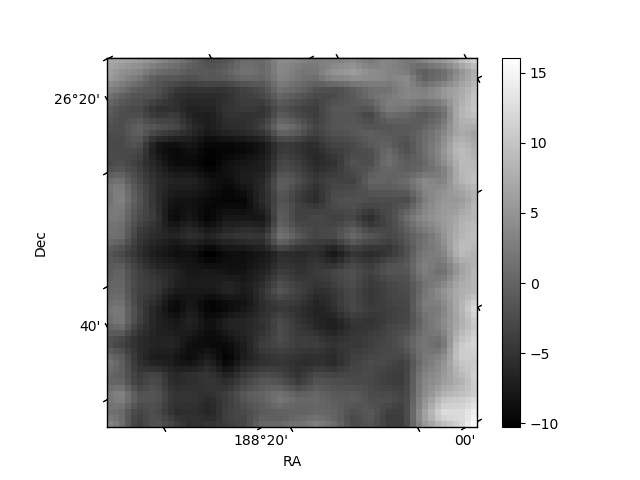
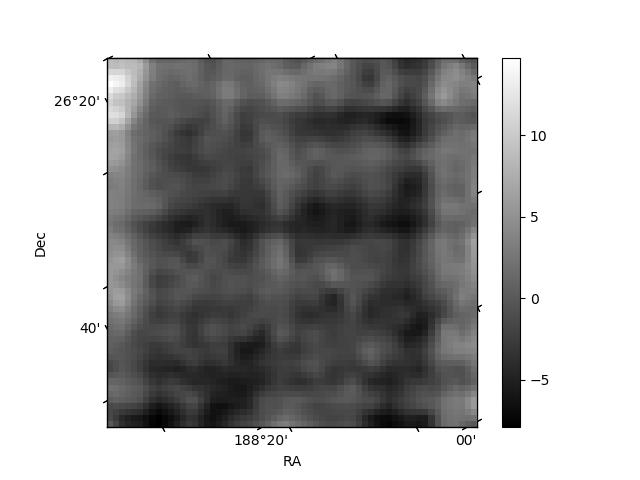
Histogram calculated using DETX and DETY for each event in the final _common_clean file
| Quadrant A | 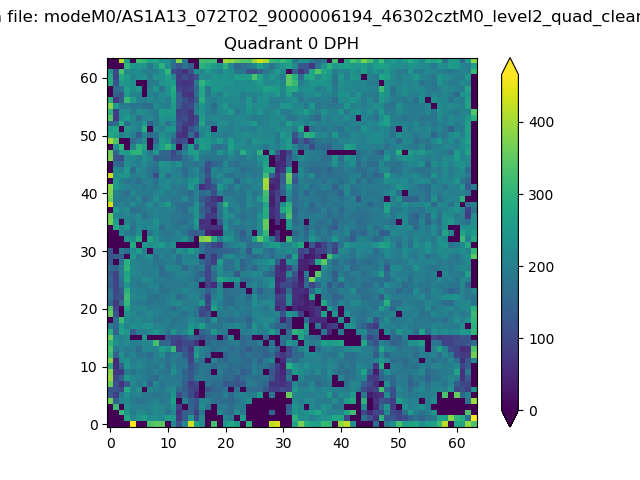 |
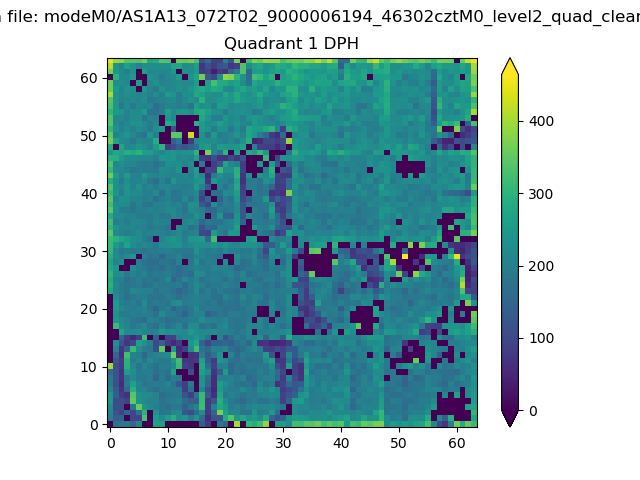 |
Quadrant B |
|---|---|---|---|
| Quadrant D | 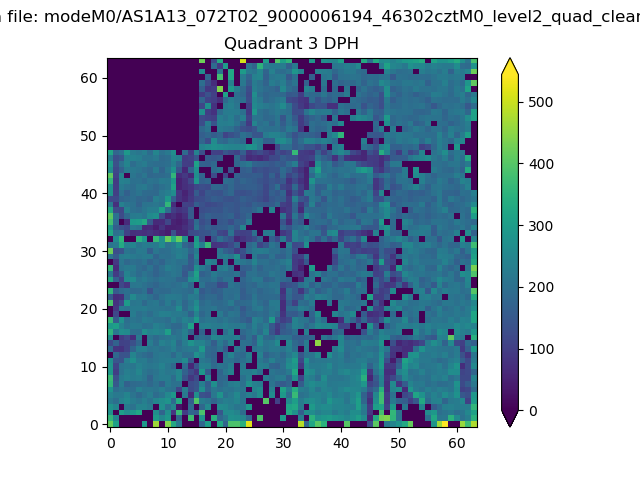 |
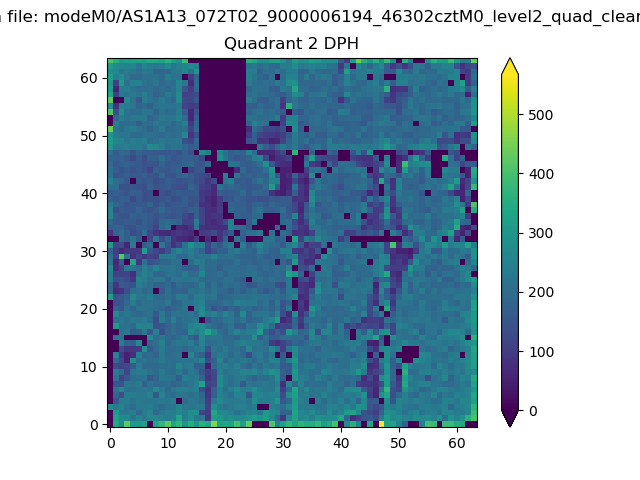 |
Quadrant C |
| Plot type | Count rate plots | Images |
|---|---|---|
| Comparison with Poisson distribution Blue bars denote a histogram of data divided into 1 sec bins. Red curve is a Poisson curve with rate = median count rate of data. |
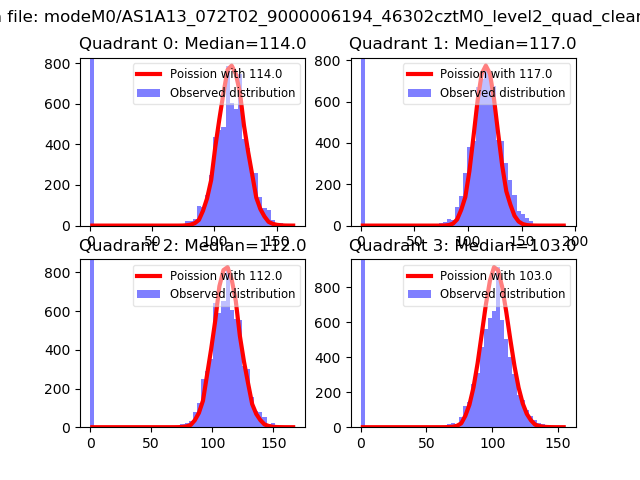 |
 |
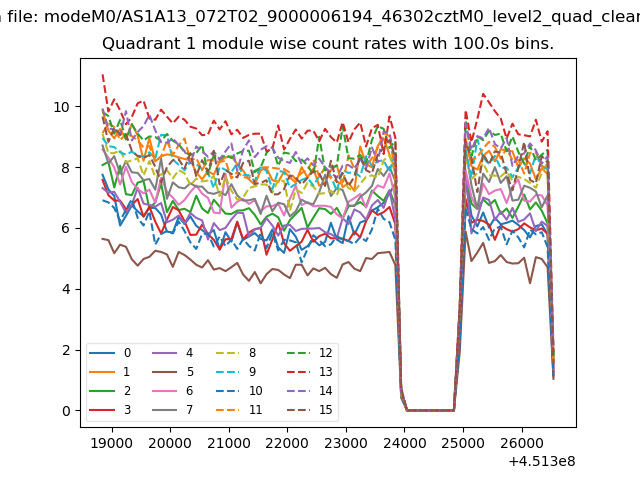
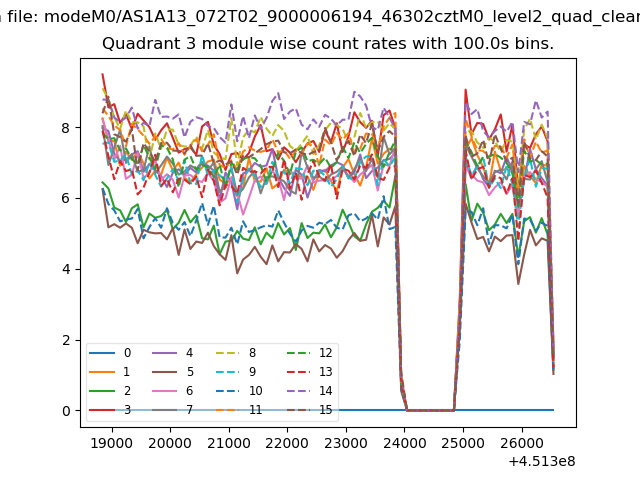
| Quadrant-wise count rates Data is divided into 100 sec bins |
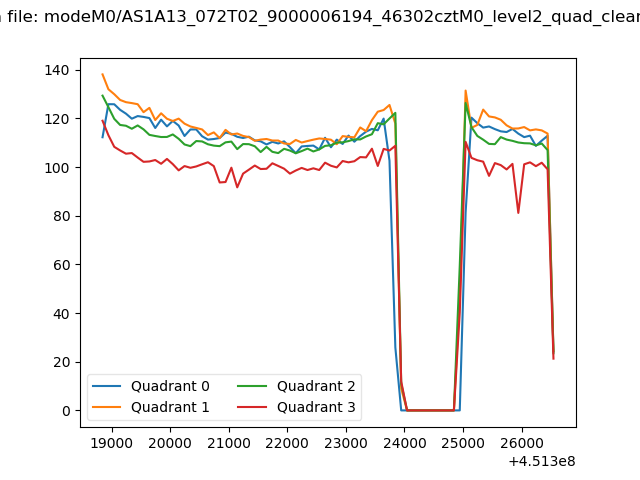 |
|
| Module-wise count rates for Quadrant A Data is divided into 100 sec bins |
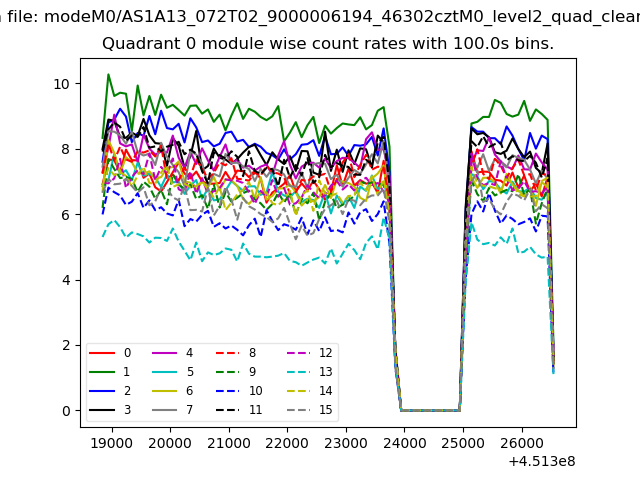 |
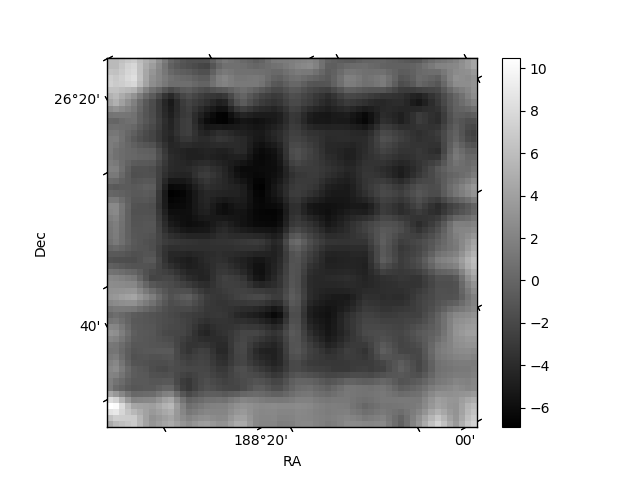 |
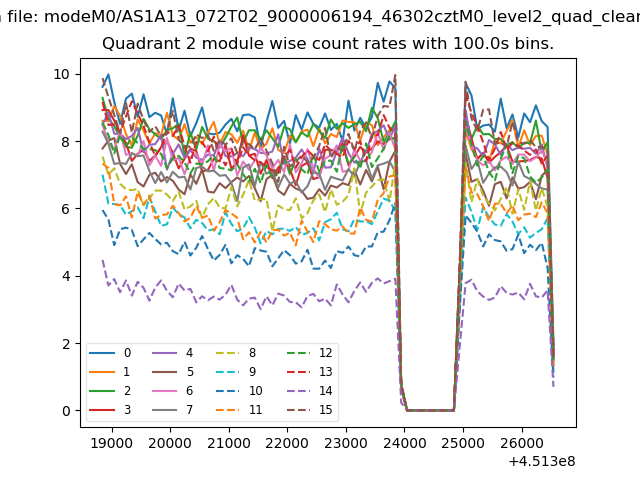
| Module-wise count rates for Quadrant B Data is divided into 100 sec bins |
 |
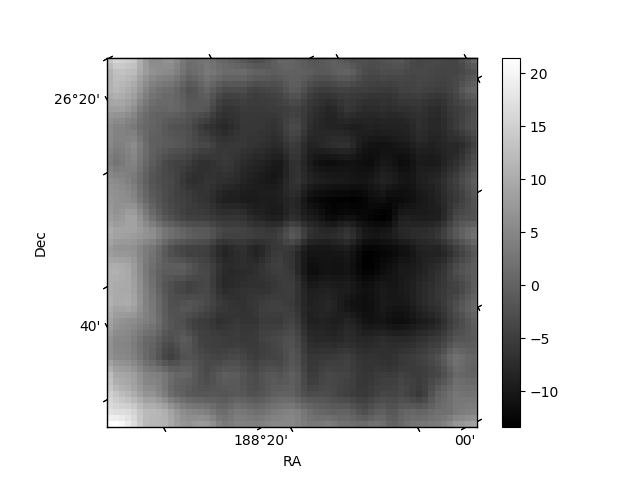 |
| Module-wise count rates for Quadrant C Data is divided into 100 sec bins |
 |
 |
| Module-wise count rates for Quadrant D Data is divided into 100 sec bins |
 |
 |
| Parameter | Plot |
|---|---|
| CZT HV Monitor |  |
| D_VDD | 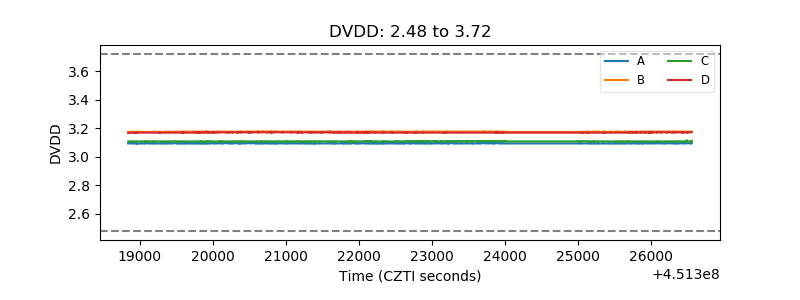 |
| Temperature 1 | 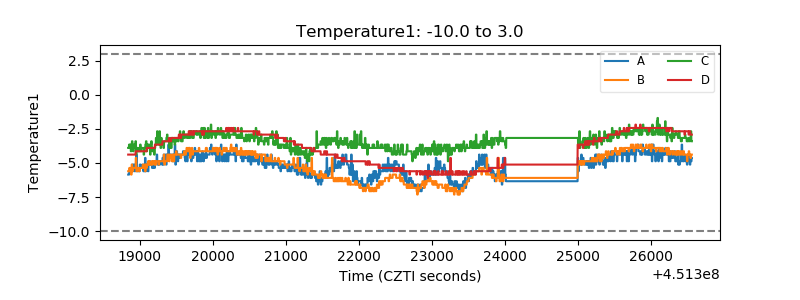 |
| Veto HV Monitor | 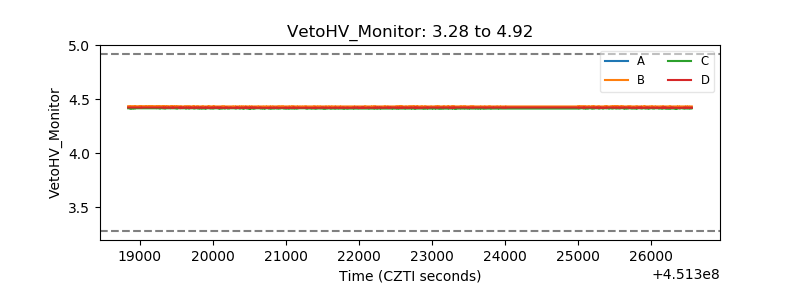 |
| Veto LLD | 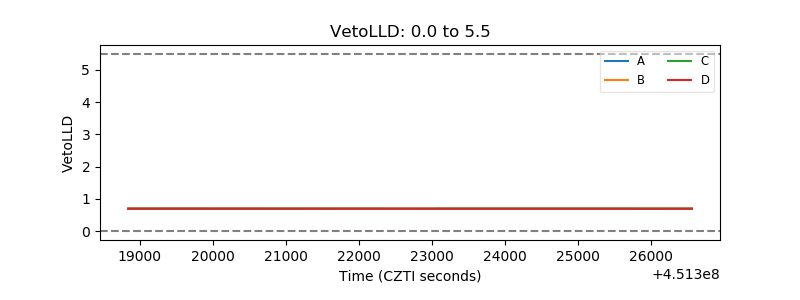 |
| Alpha Counter | 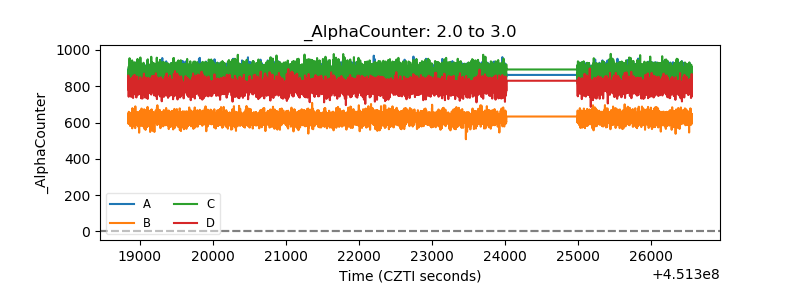 |
| _CPM_Rate | 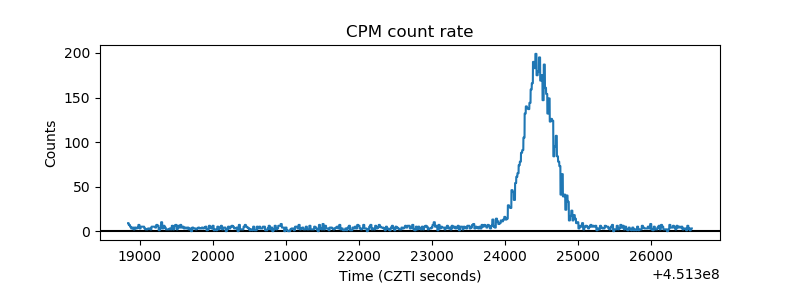 |
| CZT Counter | 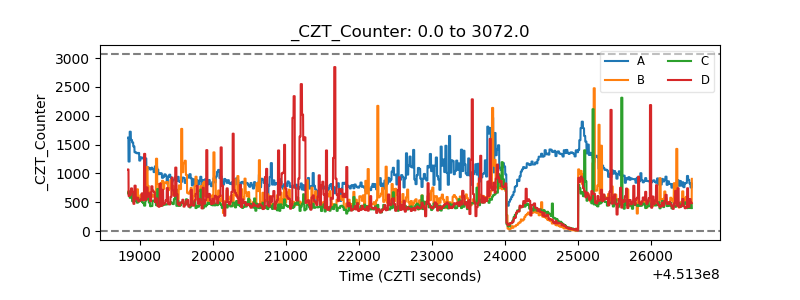 |
| +2.5 Volts monitor |  |
| +5 Volts monitor | 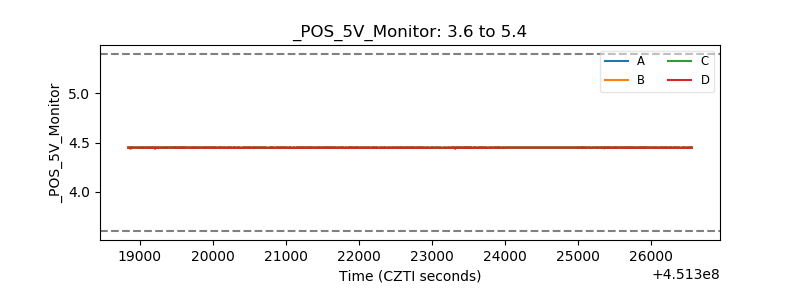 |
| _ROLL_ROT | 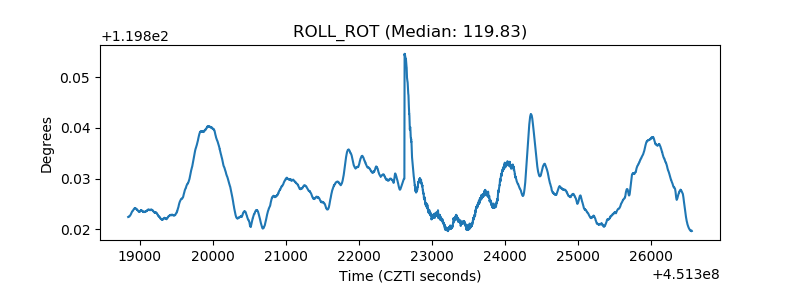 |
| _Roll_DEC | 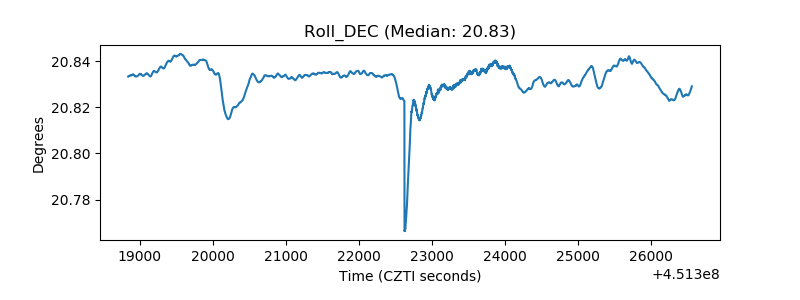 |
| _Roll_RA | 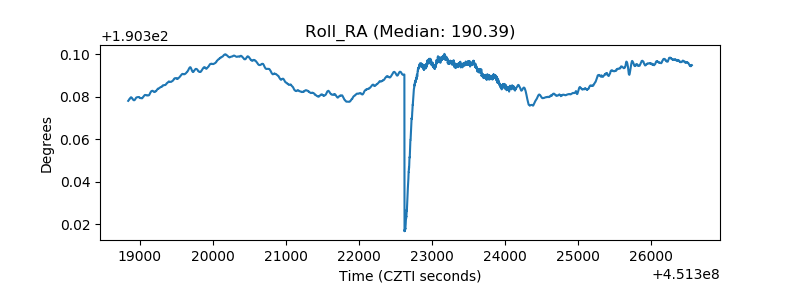 |
| Veto Counter | 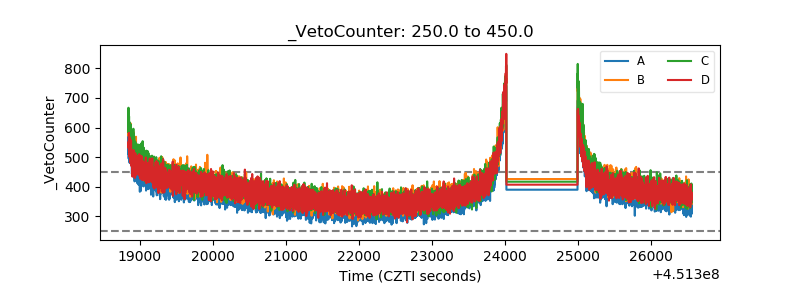 |