| Param | Original file | Final file |
|---|---|---|
| Filename | modeM0/AS1T05_200T01_9000006196_46331cztM0_level2.fits | modeM0/AS1T05_200T01_9000006196_46331cztM0_level2_quad_clean.evt |
| Size (bytes) | 658,123,200 | 101,134,080 |
| Size | 627.6 MB | 96.4 MB |
| Events in quadrant A | 11,832,440 | 455,869 |
| Events in quadrant B | 4,579,817 | 770,382 |
| Events in quadrant C | 3,013,005 | 736,330 |
| Events in quadrant D | 4,426,635 | 641,176 |
| Mode SS | |||
|---|---|---|---|
| Quadrant | BADHDUFLAG | Total packets | Discarded packets |
| A | 0 | 134 | 0 |
| B | 0 | 134 | 0 |
| C | 0 | 134 | 0 |
| D | 0 | 134 | 0 |
| Mode M0 | |||
|---|---|---|---|
| Quadrant | BADHDUFLAG | Total packets | Discarded packets |
| A | 0 | 39733 | 2 |
| B | 0 | 18176 | 3 |
| C | 0 | 13718 | 2 |
| D | 0 | 17818 | 2 |
| Mode M9 | |||
|---|---|---|---|
| Quadrant | BADHDUFLAG | Total packets | Discarded packets |
| A | 0 | 12 | 0 |
| B | 0 | 12 | 0 |
| C | 0 | 13 | 0 |
| D | 0 | 13 | 0 |
| Quadrant | Total seconds | Saturated seconds | Saturation percentage |
|---|---|---|---|
| A | 6571 | 3105 | 47.253082% |
| B | 6570 | 186 | 2.831050% |
| C | 6570 | 75 | 1.141553% |
| D | 6570 | 439 | 6.681887% |
Noise dominated data is calculated using 1-second bins in cleaned event files. If a bin has >2000 counts, and if more than 50% of those come from <1% of pixels, then it is considered to be noise-dominated and hence unusable.
| Quadrant | # 1 sec bins | Bins with >0 counts | Bins with >2000 counts | High rate bins dominated by noise | Noise dominated (total time) | Noise dominated (detector-on time) | Marked lightcurve |
|---|---|---|---|---|---|---|---|
| A | 7561 | 6571 | 2361 | 2361 | 31.23% | 35.93% | 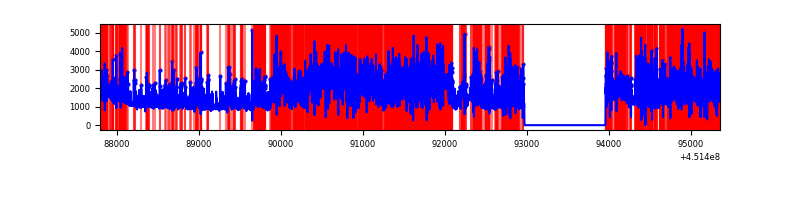 |
| B | 7560 | 6571 | 30 | 30 | 0.40% | 0.46% | 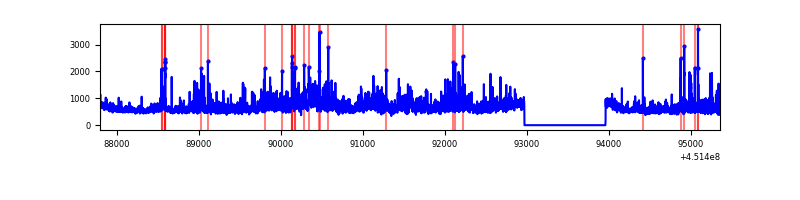 |
| C | 7560 | 6571 | 8 | 8 | 0.11% | 0.12% | 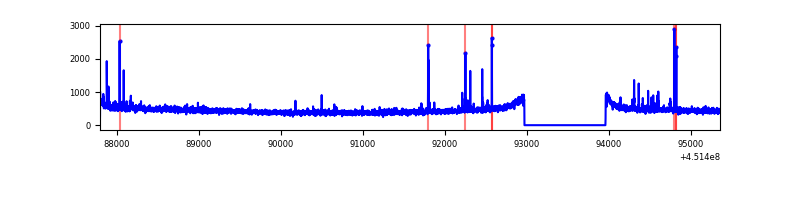 |
| D | 7560 | 6571 | 274 | 274 | 3.62% | 4.17% | 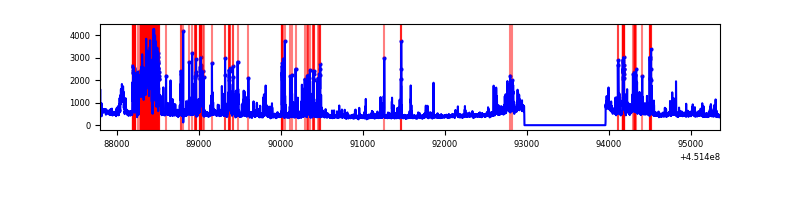 |
Top three noisy pixels from each quadrant. If the there are fewer than three noisy pixels in the level2.evt file, extra rows are filled as -1
| Pixel properties | Quadrant properties | ||||||
|---|---|---|---|---|---|---|---|
| Quadrant | DetID | PixID | Counts | Sigma | Mean | Median | Sigma |
| A | 15 | 223 | 6456402 | 49251.01 | 636 | 621 | 131.1 |
| A | 10 | 83 | 2614327 | 19939.91 | 636 | 621 | 131.1 |
| A | 9 | 191 | 260447 | 1982.21 | 636 | 621 | 131.1 |
| B | 3 | 112 | 1401365 | 9386.33 | 763 | 740 | 149.2 |
| B | 5 | 172 | 62490 | 413.82 | 763 | 740 | 149.2 |
| B | 4 | 171 | 60965 | 403.6 | 763 | 740 | 149.2 |
| C | 12 | 2 | 46816 | 263.2 | 750 | 755 | 175.0 |
| C | 1 | 3 | 15930 | 86.71 | 750 | 755 | 175.0 |
| C | 11 | 16 | 12798 | 68.82 | 750 | 755 | 175.0 |
| D | 13 | 249 | 996182 | 5399.74 | 736 | 714 | 184.4 |
| D | 1 | 52 | 379642 | 2055.43 | 736 | 714 | 184.4 |
| D | 2 | 249 | 82548 | 443.89 | 736 | 714 | 184.4 |
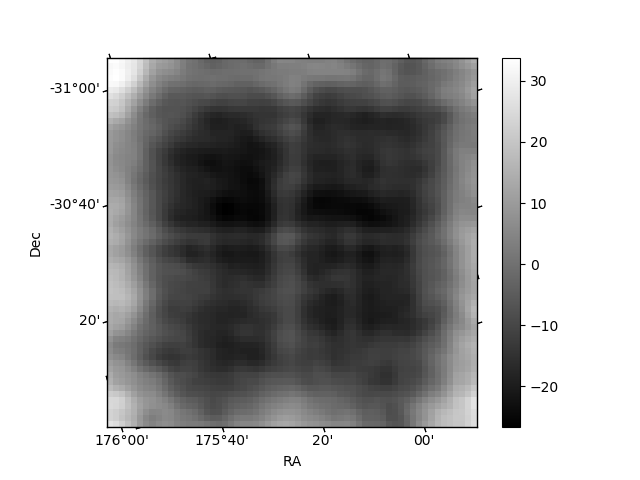
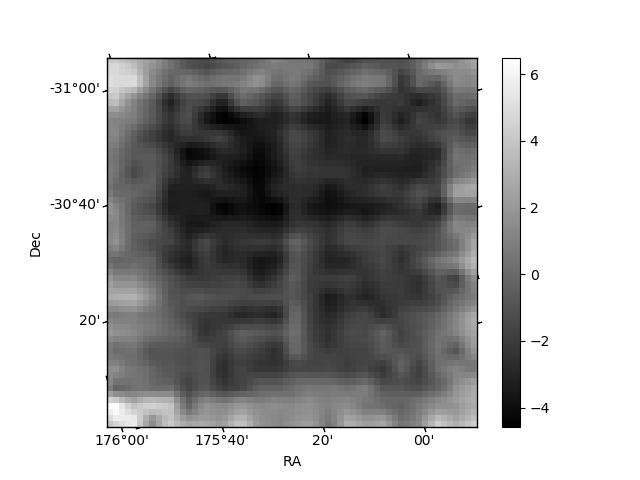
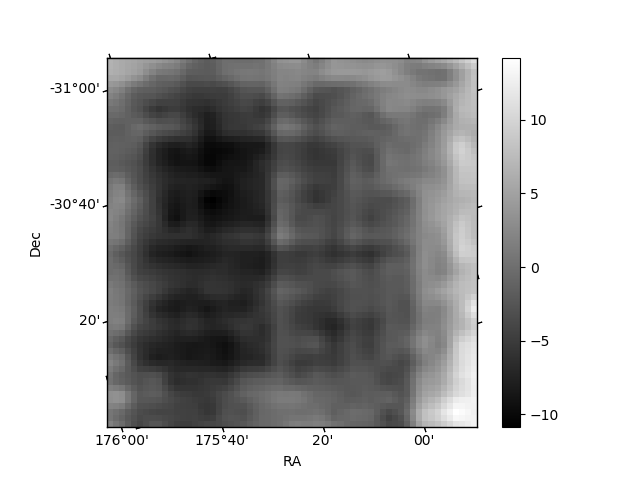
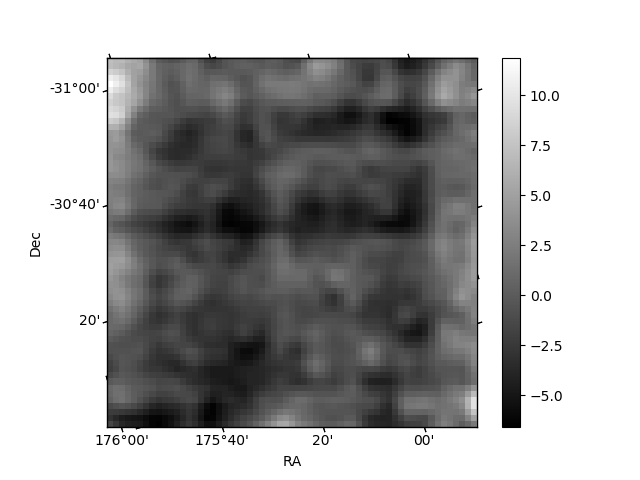
Histogram calculated using DETX and DETY for each event in the final _common_clean file
| Quadrant A | 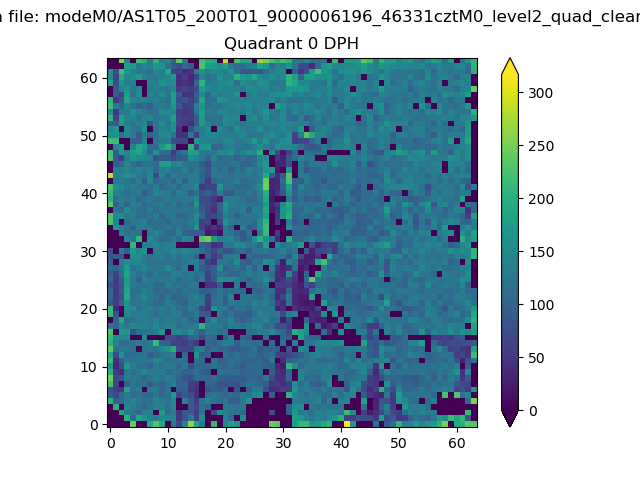 |
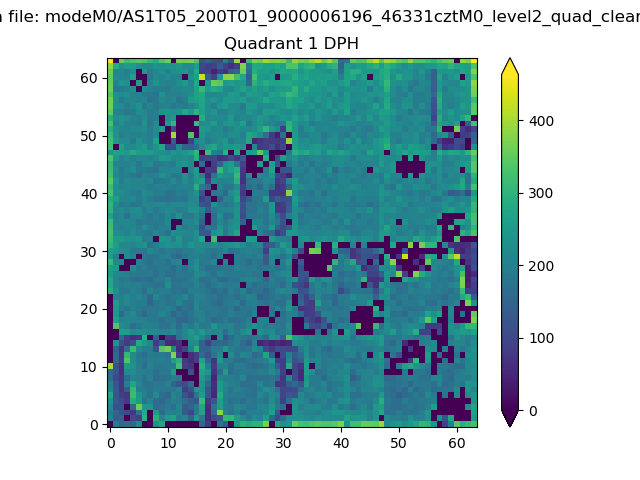 |
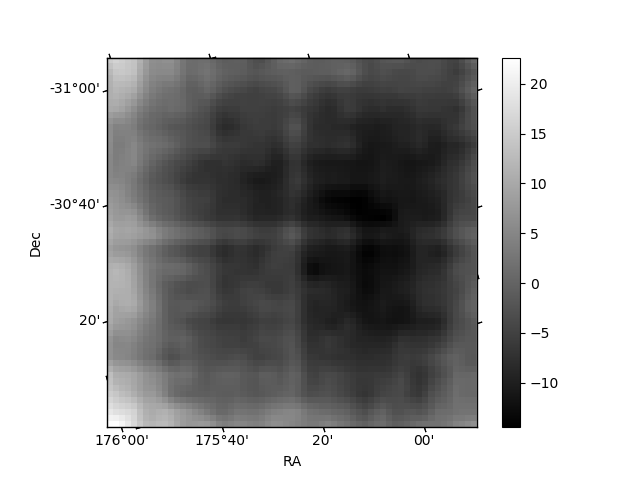
Quadrant B |
|---|---|---|---|
| Quadrant D | 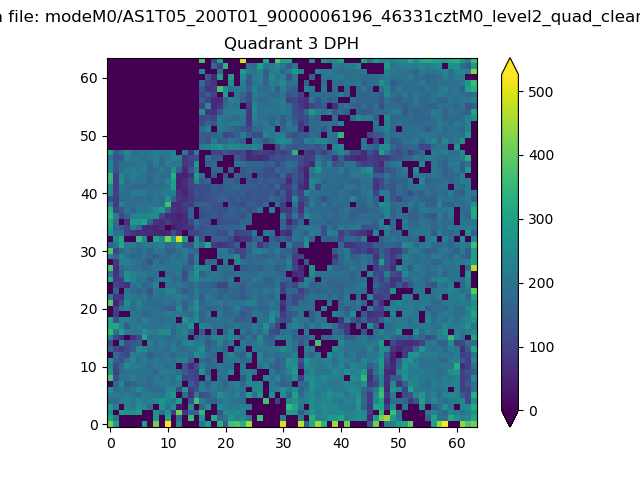 |
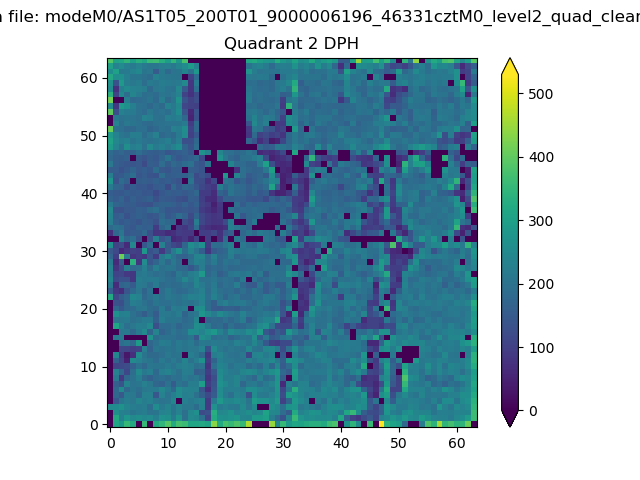 |
Quadrant C |
| Plot type | Count rate plots | Images |
|---|---|---|
| Comparison with Poisson distribution Blue bars denote a histogram of data divided into 1 sec bins. Red curve is a Poisson curve with rate = median count rate of data. |
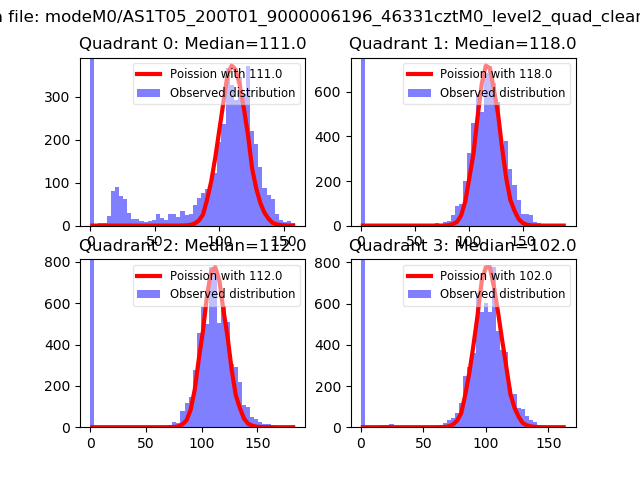 |
 |
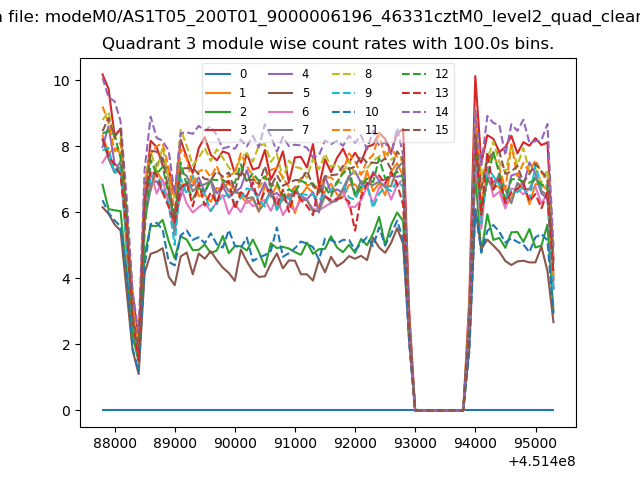
| Quadrant-wise count rates Data is divided into 100 sec bins |
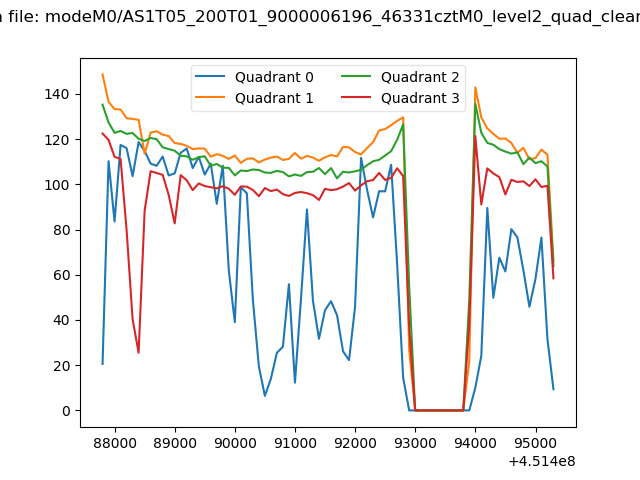 |
|
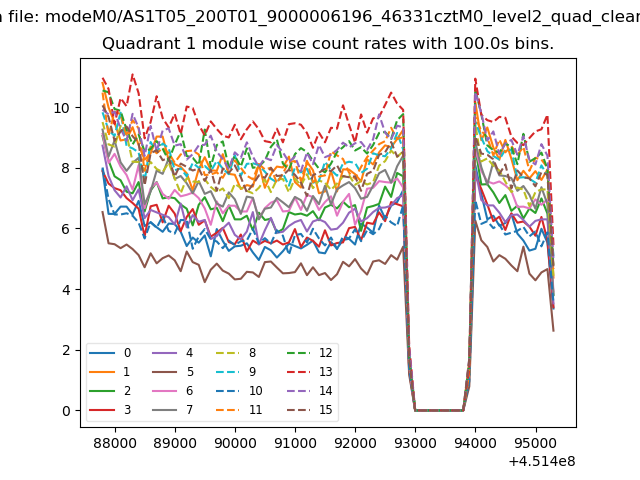
| Module-wise count rates for Quadrant A Data is divided into 100 sec bins |
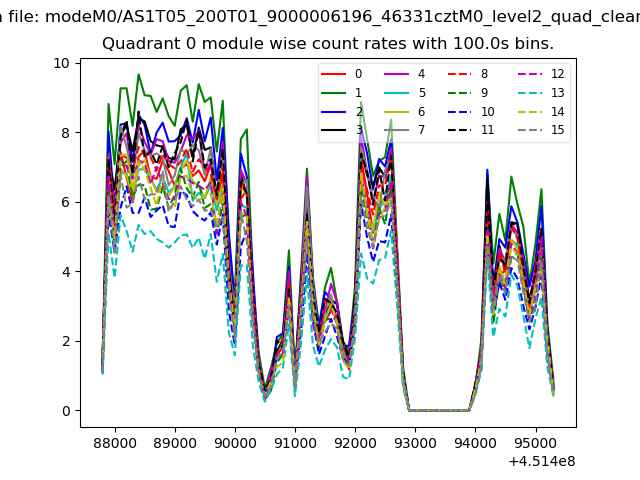 |
 |
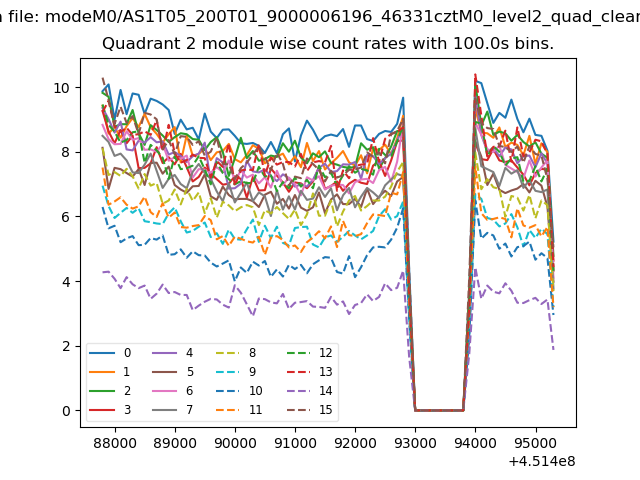
| Module-wise count rates for Quadrant B Data is divided into 100 sec bins |
 |
 |
| Module-wise count rates for Quadrant C Data is divided into 100 sec bins |
 |
 |
| Module-wise count rates for Quadrant D Data is divided into 100 sec bins |
 |
 |
| Parameter | Plot |
|---|---|
| CZT HV Monitor | 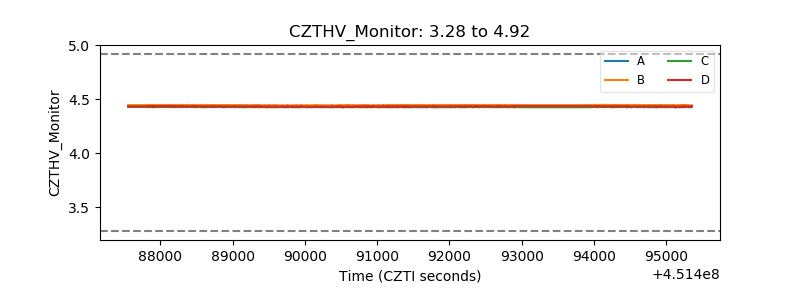 |
| D_VDD | 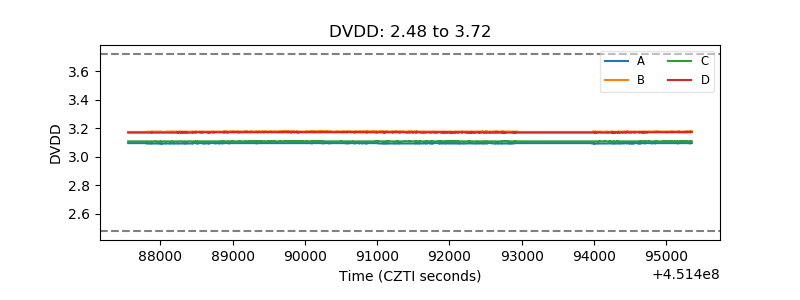 |
| Temperature 1 | 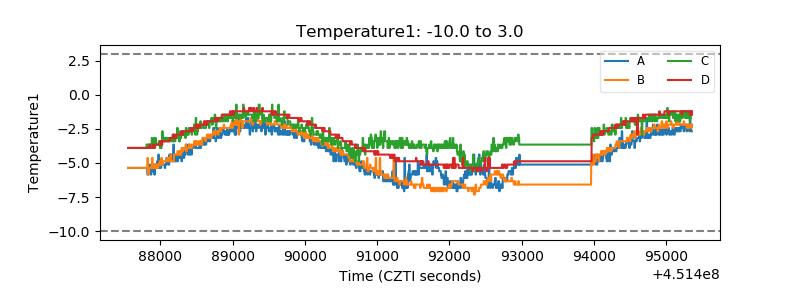 |
| Veto HV Monitor |  |
| Veto LLD | 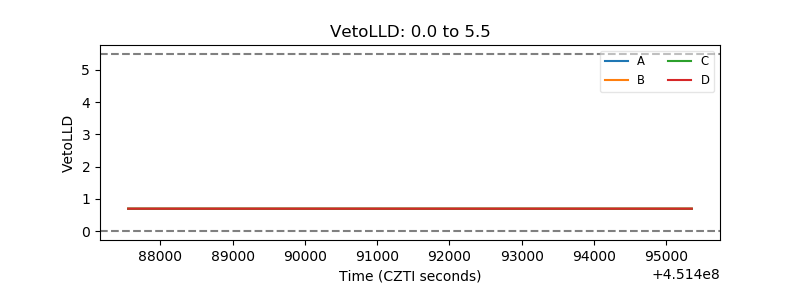 |
| Alpha Counter | 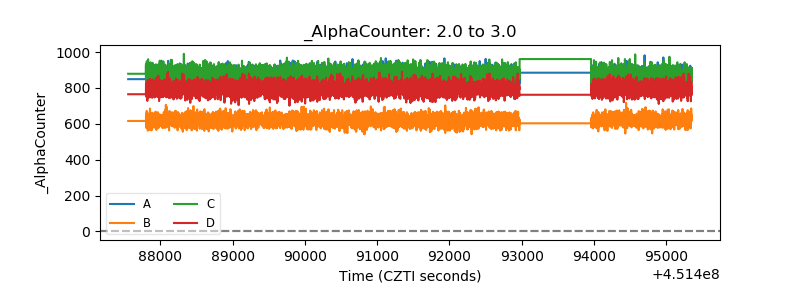 |
| _CPM_Rate | 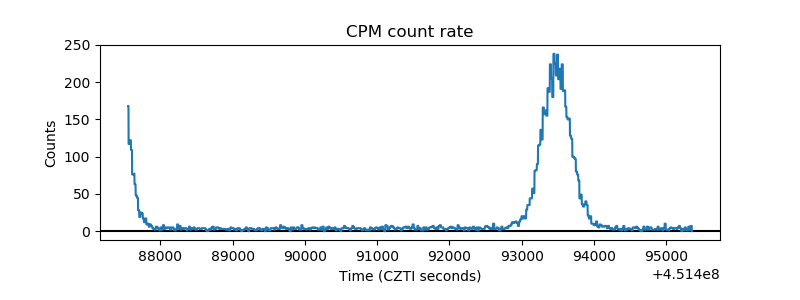 |
| CZT Counter | 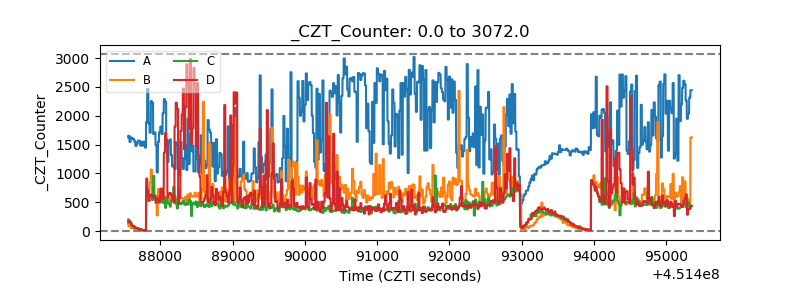 |
| +2.5 Volts monitor | 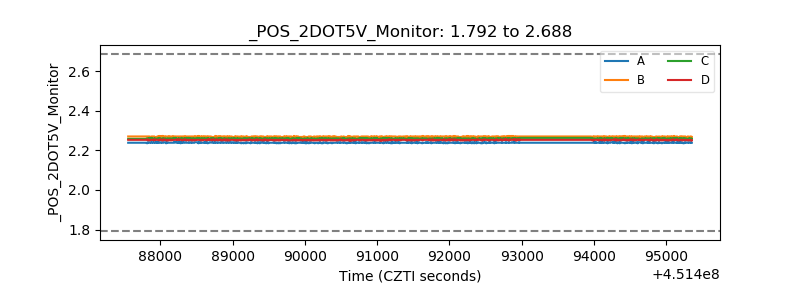 |
| +5 Volts monitor | 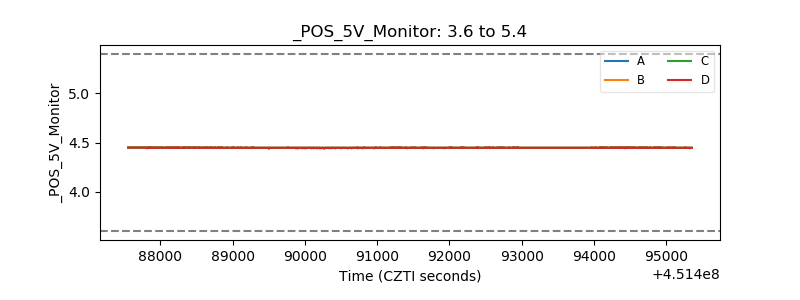 |
| _ROLL_ROT | 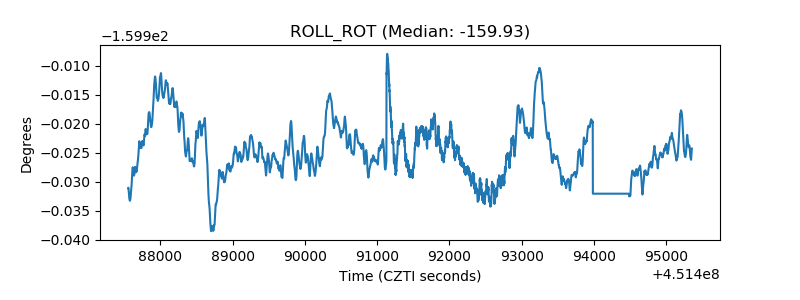 |
| _Roll_DEC | 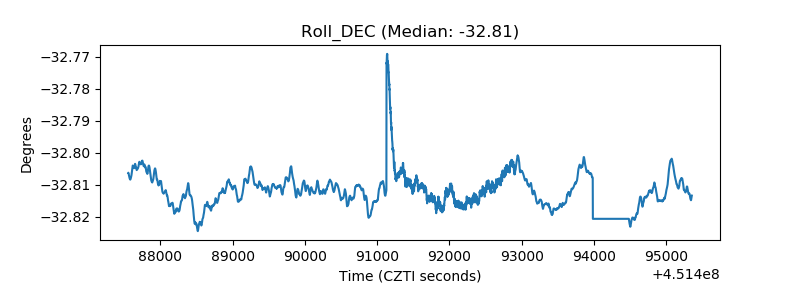 |
| _Roll_RA | 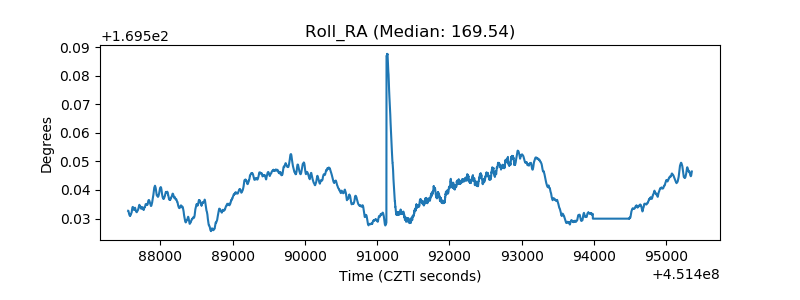 |
| Veto Counter | 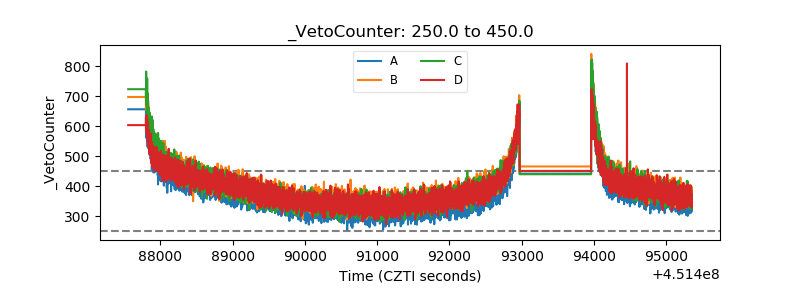 |