| Param | Original file | Final file |
|---|---|---|
| Filename | modeM0/AS1A13_070T05_9000006198_46341cztM0_level2.fits | modeM0/AS1A13_070T05_9000006198_46341cztM0_level2_quad_clean.evt |
| Size (bytes) | 648,432,000 | 100,480,320 |
| Size | 618.4 MB | 95.8 MB |
| Events in quadrant A | 12,303,188 | 433,268 |
| Events in quadrant B | 4,415,830 | 760,076 |
| Events in quadrant C | 3,208,657 | 723,736 |
| Events in quadrant D | 3,551,549 | 655,140 |
| Mode M9 | |||
|---|---|---|---|
| Quadrant | BADHDUFLAG | Total packets | Discarded packets |
| A | 0 | 19 | 0 |
| B | 0 | 19 | 0 |
| C | 0 | 19 | 0 |
| D | 0 | 19 | 0 |
| Mode SS | |||
|---|---|---|---|
| Quadrant | BADHDUFLAG | Total packets | Discarded packets |
| A | 0 | 138 | 0 |
| B | 0 | 138 | 0 |
| C | 0 | 138 | 0 |
| D | 0 | 138 | 0 |
| Mode M0 | |||
|---|---|---|---|
| Quadrant | BADHDUFLAG | Total packets | Discarded packets |
| A | 0 | 41259 | 2 |
| B | 0 | 17671 | 2 |
| C | 0 | 14304 | 2 |
| D | 0 | 15263 | 2 |
| Quadrant | Total seconds | Saturated seconds | Saturation percentage |
|---|---|---|---|
| A | 6747 | 3123 | 46.287239% |
| B | 6747 | 192 | 2.845709% |
| C | 6748 | 117 | 1.733847% |
| D | 6748 | 176 | 2.608180% |
Noise dominated data is calculated using 1-second bins in cleaned event files. If a bin has >2000 counts, and if more than 50% of those come from <1% of pixels, then it is considered to be noise-dominated and hence unusable.
| Quadrant | # 1 sec bins | Bins with >0 counts | Bins with >2000 counts | High rate bins dominated by noise | Noise dominated (total time) | Noise dominated (detector-on time) | Marked lightcurve |
|---|---|---|---|---|---|---|---|
| A | 8622 | 6749 | 2551 | 2551 | 29.59% | 37.80% | 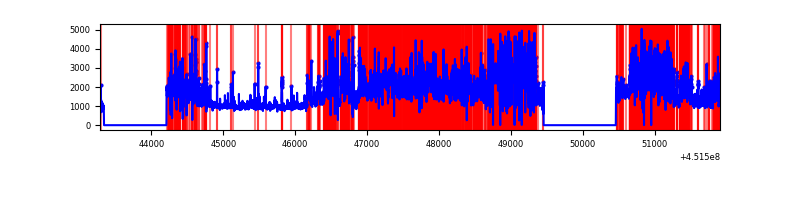 |
| B | 8622 | 6749 | 20 | 20 | 0.23% | 0.30% | 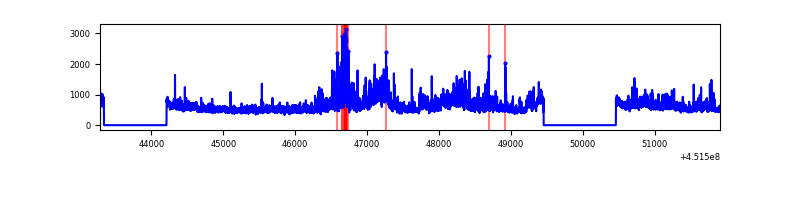 |
| C | 8623 | 6750 | 12 | 12 | 0.14% | 0.18% | 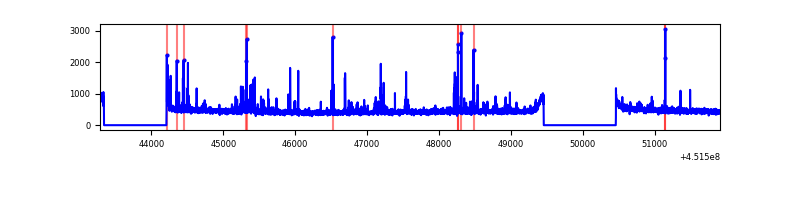 |
| D | 8623 | 6750 | 55 | 55 | 0.64% | 0.81% |  |
Top three noisy pixels from each quadrant. If the there are fewer than three noisy pixels in the level2.evt file, extra rows are filled as -1
| Pixel properties | Quadrant properties | ||||||
|---|---|---|---|---|---|---|---|
| Quadrant | DetID | PixID | Counts | Sigma | Mean | Median | Sigma |
| A | 15 | 223 | 7350526 | 58257.65 | 602 | 590 | 126.2 |
| A | 10 | 83 | 2585934 | 20492.16 | 602 | 590 | 126.2 |
| A | 13 | 248 | 21169 | 163.11 | 602 | 590 | 126.2 |
| B | 3 | 112 | 1177670 | 7595.02 | 776 | 751 | 155.0 |
| B | 5 | 172 | 62384 | 397.74 | 776 | 751 | 155.0 |
| B | 5 | 32 | 49684 | 315.78 | 776 | 751 | 155.0 |
| C | 12 | 2 | 94271 | 517.95 | 764 | 766 | 180.5 |
| C | 12 | 250 | 83516 | 458.38 | 764 | 766 | 180.5 |
| C | 12 | 249 | 37527 | 203.63 | 764 | 766 | 180.5 |
| D | 13 | 249 | 288784 | 1510.37 | 760 | 736 | 190.7 |
| D | 5 | 235 | 194247 | 1014.67 | 760 | 736 | 190.7 |
| D | 5 | 171 | 37502 | 192.78 | 760 | 736 | 190.7 |
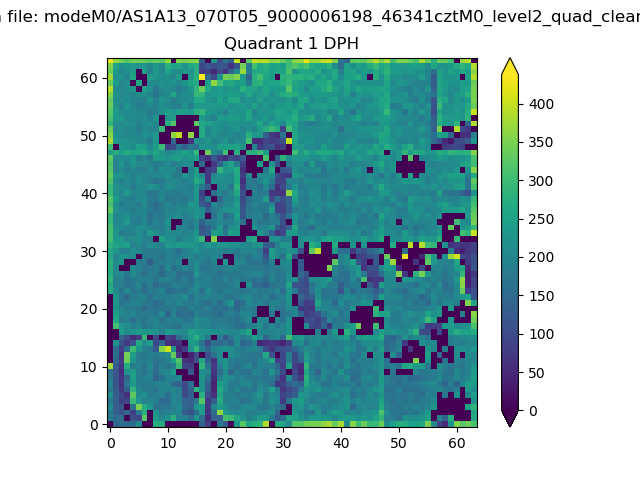
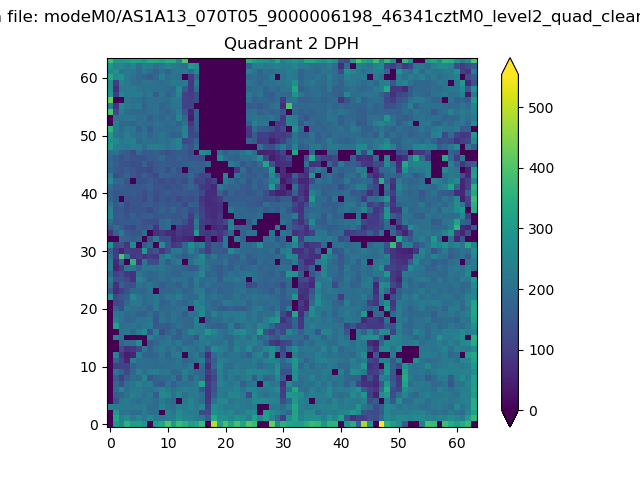
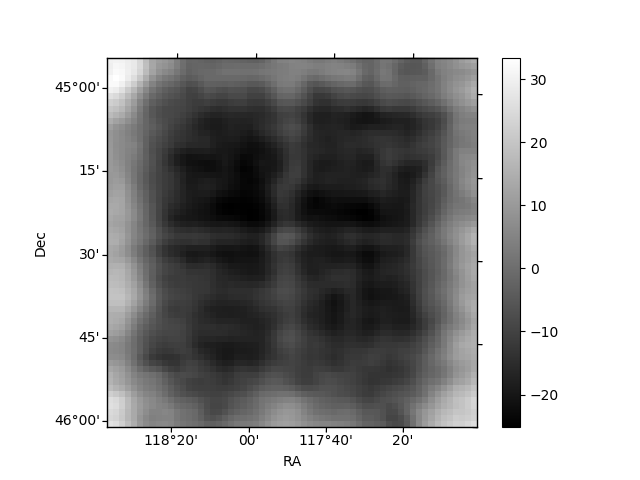
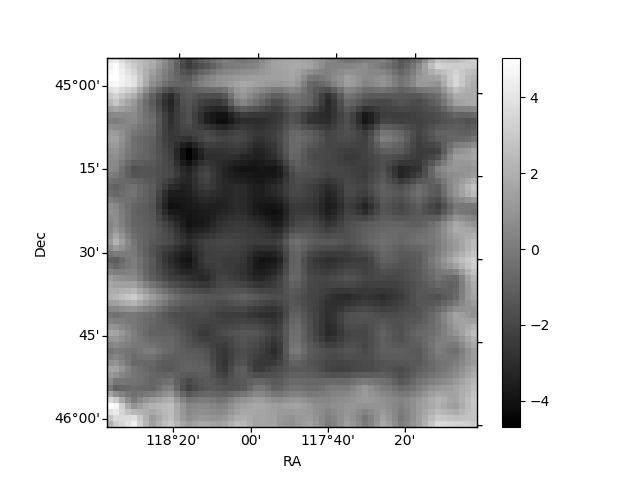
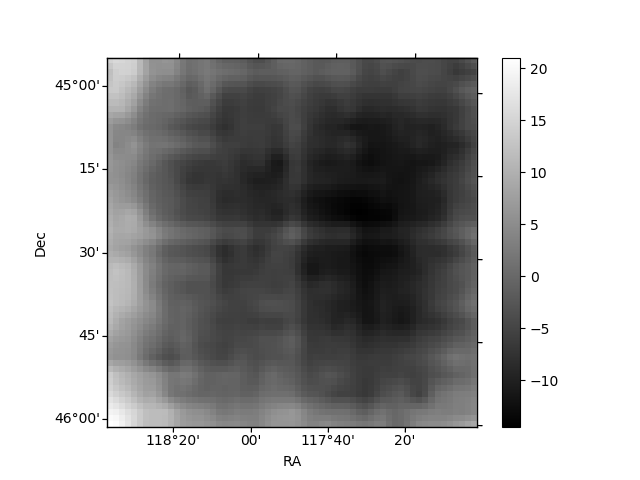
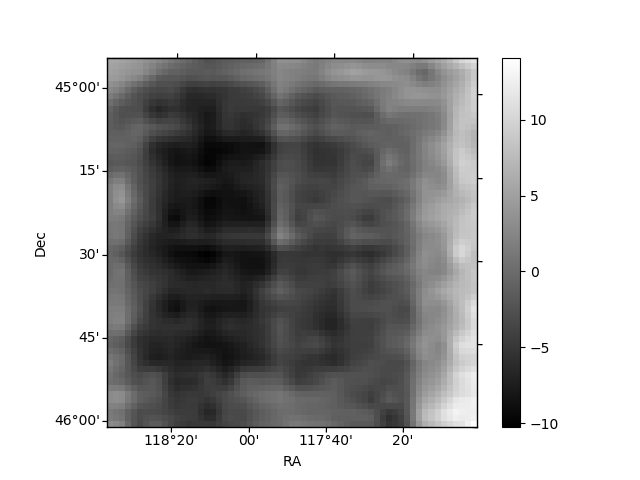
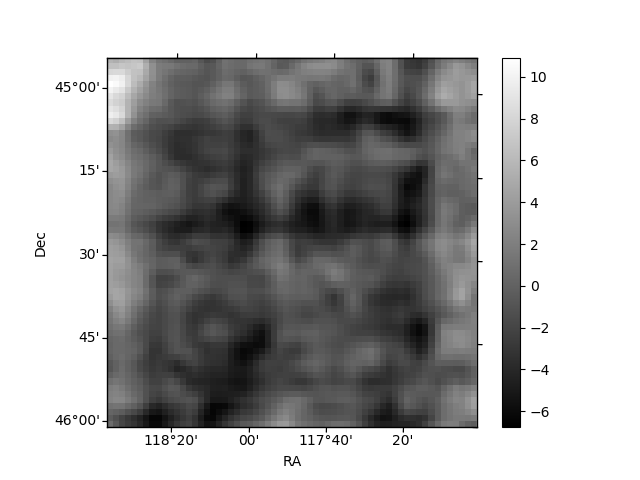
Histogram calculated using DETX and DETY for each event in the final _common_clean file
| Quadrant A | 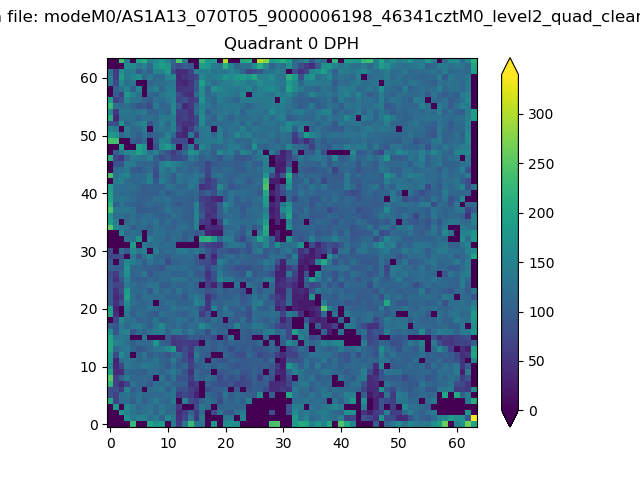 |
 |
Quadrant B |
|---|---|---|---|
| Quadrant D | 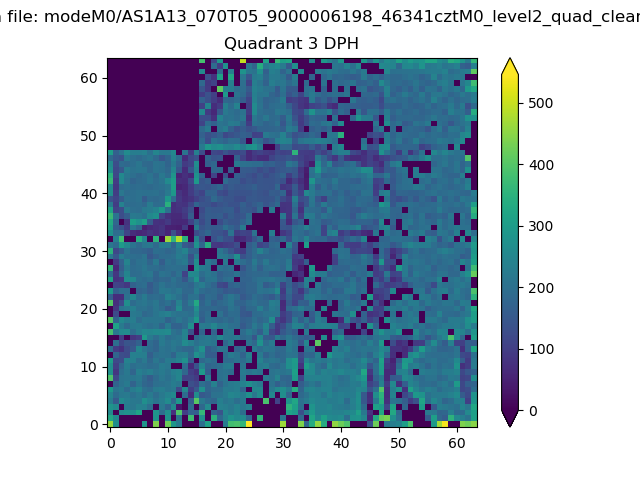 |
 |
Quadrant C |
| Plot type | Count rate plots | Images |
|---|---|---|
| Comparison with Poisson distribution Blue bars denote a histogram of data divided into 1 sec bins. Red curve is a Poisson curve with rate = median count rate of data. |
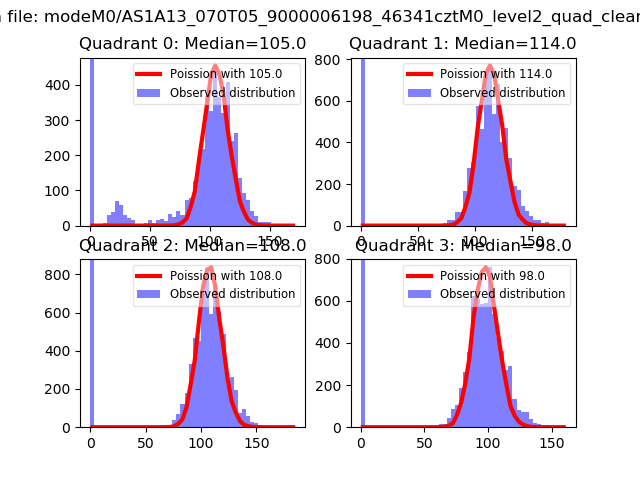 |
 |
| Quadrant-wise count rates Data is divided into 100 sec bins |
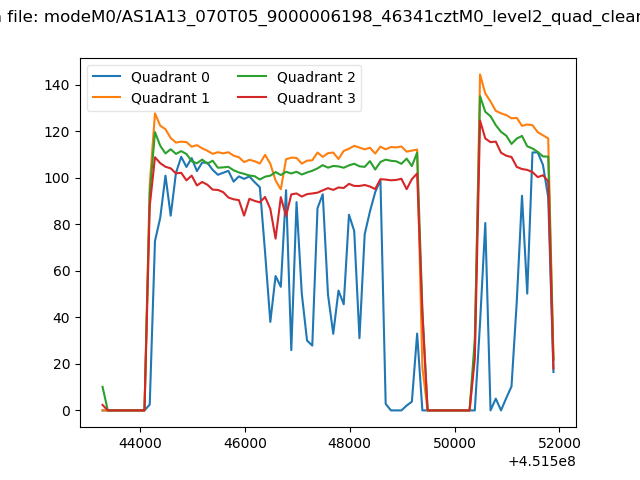 |
|
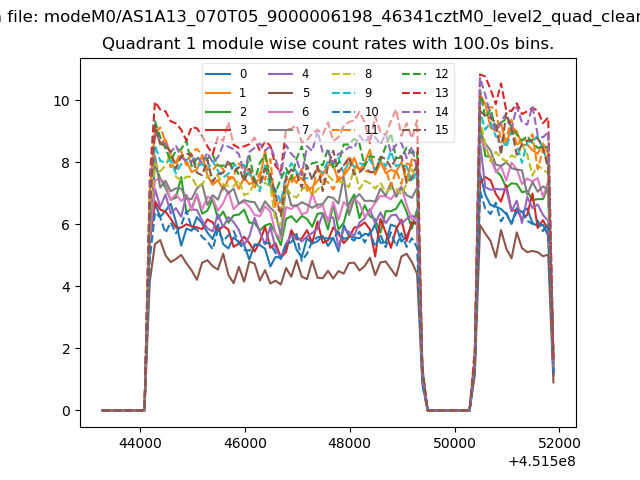
| Module-wise count rates for Quadrant A Data is divided into 100 sec bins |
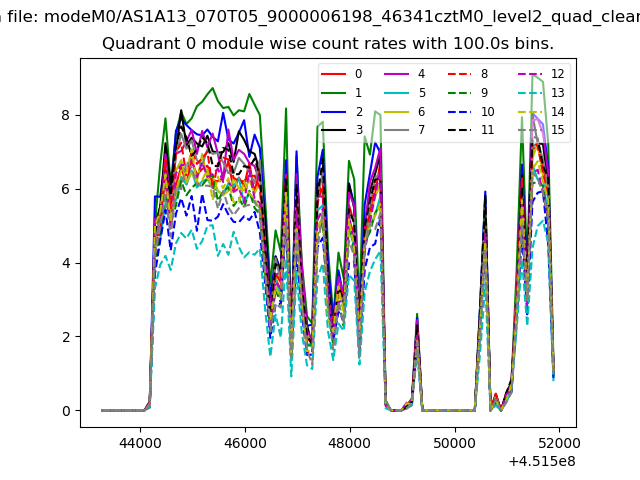 |
 |
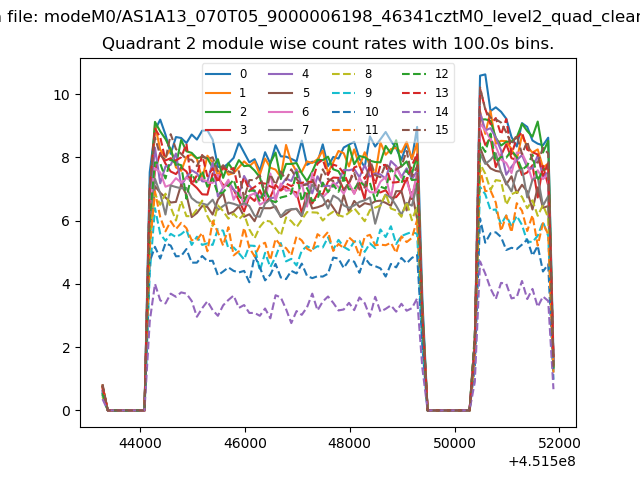
| Module-wise count rates for Quadrant B Data is divided into 100 sec bins |
 |
 |
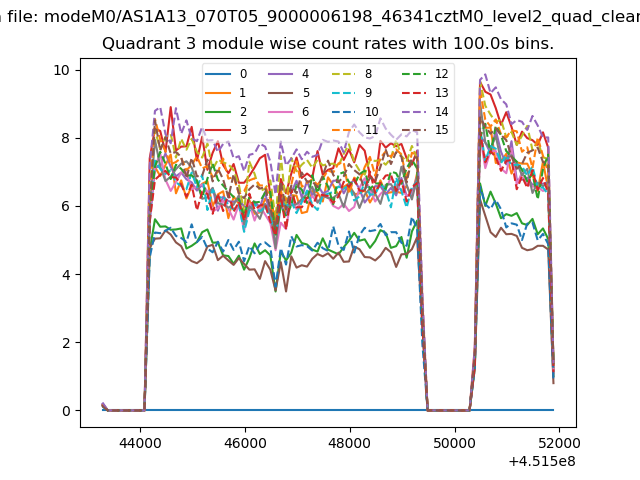
| Module-wise count rates for Quadrant C Data is divided into 100 sec bins |
 |
 |
| Module-wise count rates for Quadrant D Data is divided into 100 sec bins |
 |
 |
| Parameter | Plot |
|---|---|
| CZT HV Monitor | 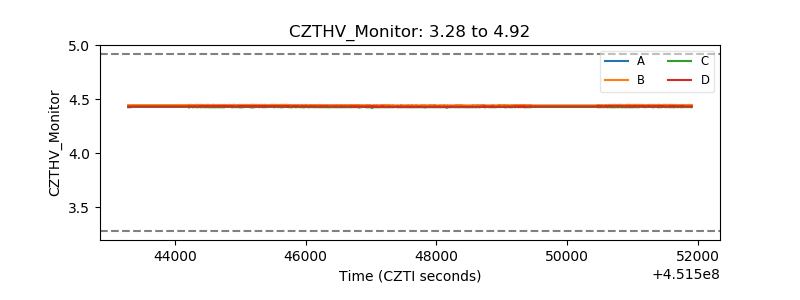 |
| D_VDD | 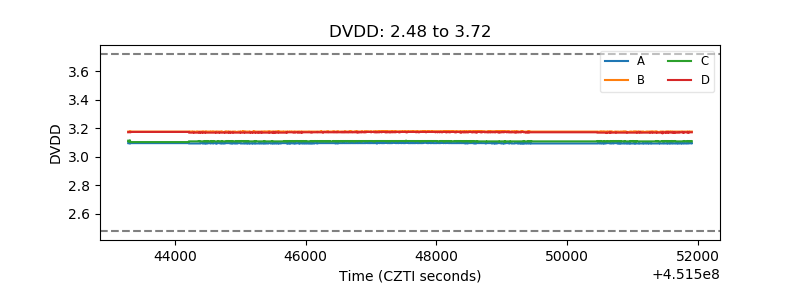 |
| Temperature 1 | 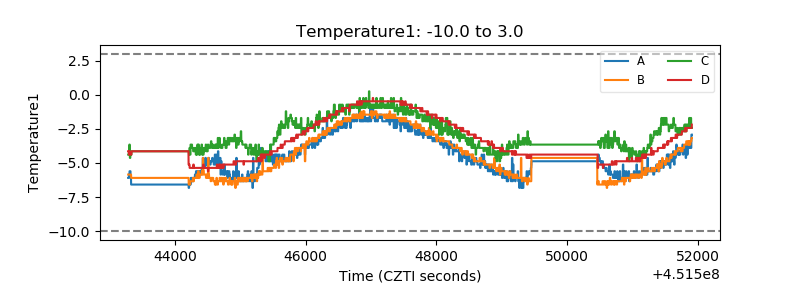 |
| Veto HV Monitor | 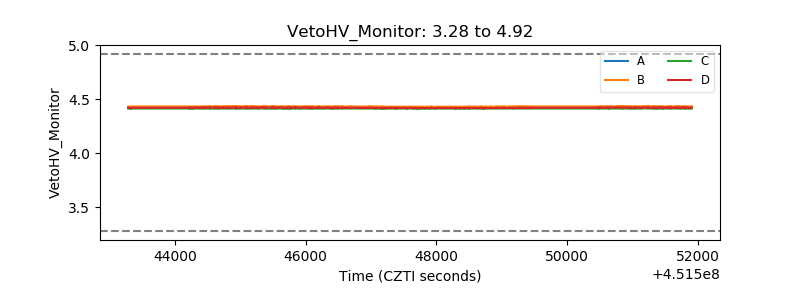 |
| Veto LLD | 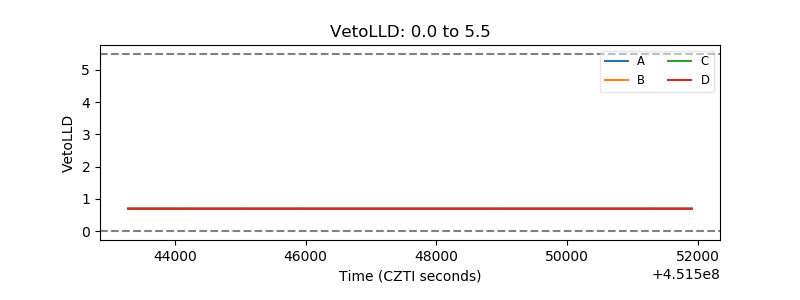 |
| Alpha Counter | 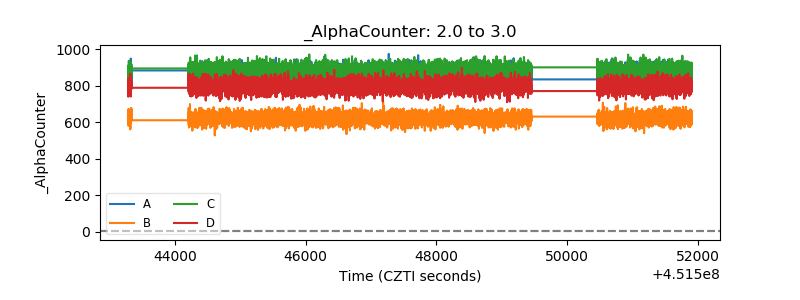 |
| _CPM_Rate | 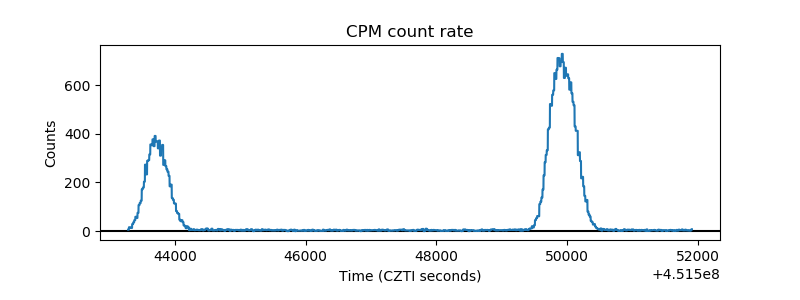 |
| CZT Counter | 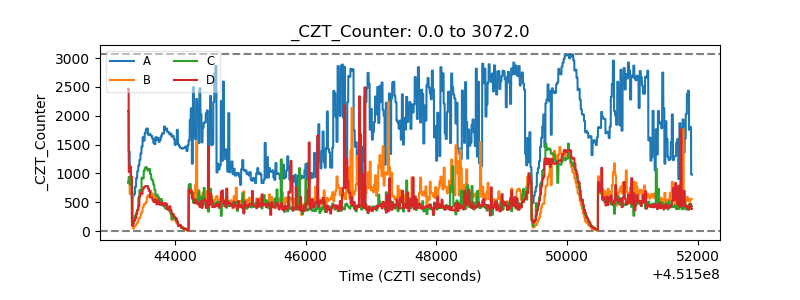 |
| +2.5 Volts monitor | 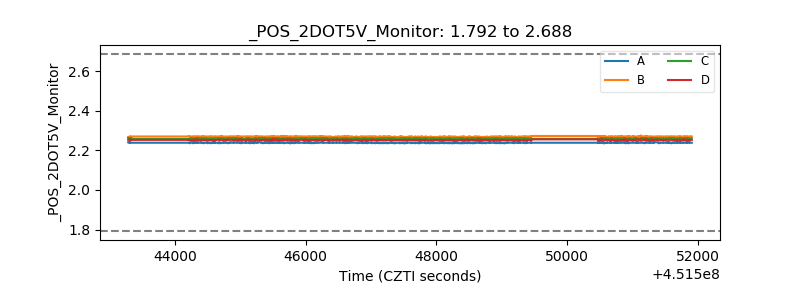 |
| +5 Volts monitor | 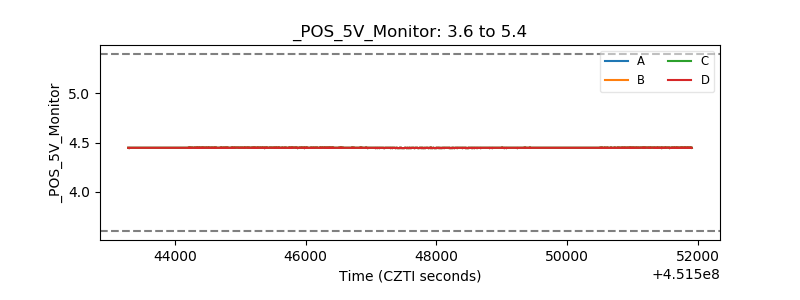 |
| _ROLL_ROT | 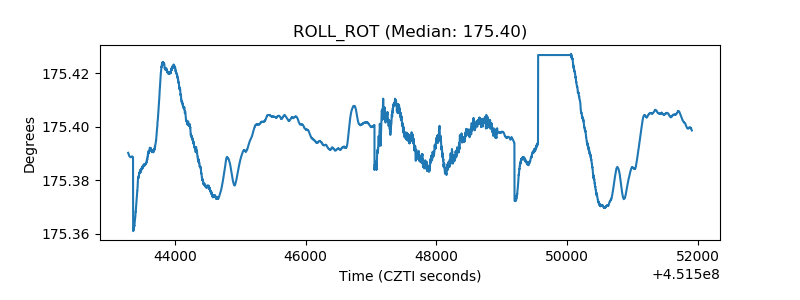 |
| _Roll_DEC | 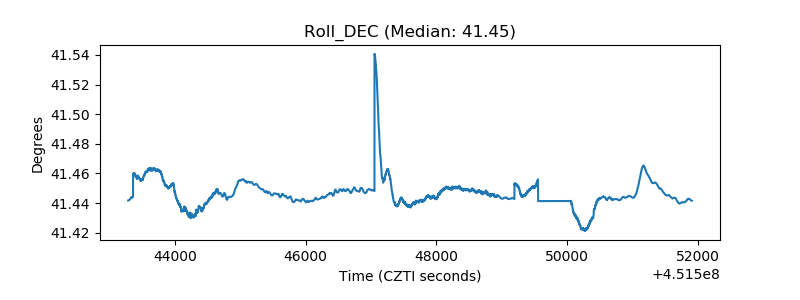 |
| _Roll_RA | 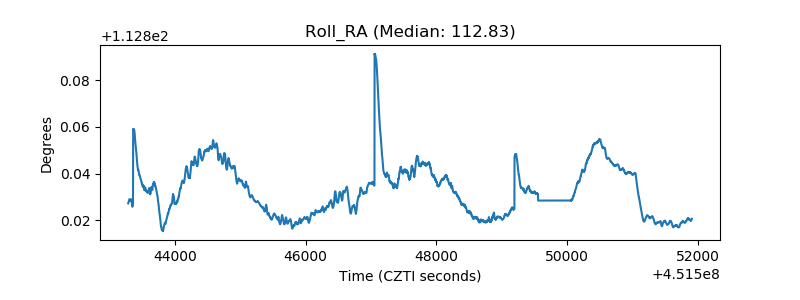 |
| Veto Counter | 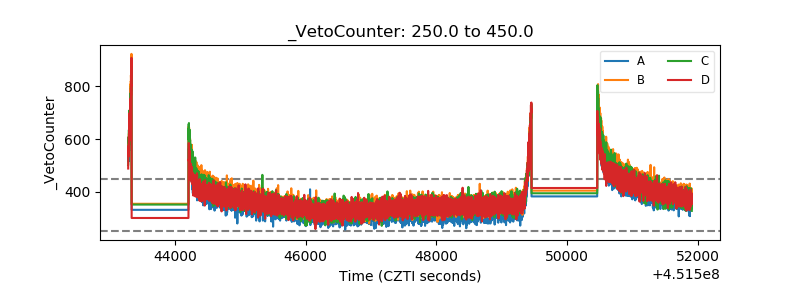 |