| Param | Original file | Final file |
|---|---|---|
| Filename | modeM0/AS1A13_068T07_9000006222_46509cztM0_level2.fits | modeM0/AS1A13_068T07_9000006222_46509cztM0_level2_quad_clean.evt |
| Size (bytes) | 554,063,040 | 115,197,120 |
| Size | 528.4 MB | 109.9 MB |
| Events in quadrant A | 6,866,827 | 769,781 |
| Events in quadrant B | 4,638,235 | 778,490 |
| Events in quadrant C | 3,565,788 | 758,077 |
| Events in quadrant D | 4,877,289 | 676,515 |
| Mode SS | |||
|---|---|---|---|
| Quadrant | BADHDUFLAG | Total packets | Discarded packets |
| A | 0 | 146 | 0 |
| B | 0 | 146 | 0 |
| C | 0 | 146 | 0 |
| D | 0 | 146 | 0 |
| Mode M0 | |||
|---|---|---|---|
| Quadrant | BADHDUFLAG | Total packets | Discarded packets |
| A | 0 | 25636 | 0 |
| B | 0 | 18615 | 0 |
| C | 0 | 15788 | 0 |
| D | 0 | 19475 | 0 |
| Quadrant | Total seconds | Saturated seconds | Saturation percentage |
|---|---|---|---|
| A | 7249 | 120 | 1.655401% |
| B | 7249 | 201 | 2.772796% |
| C | 7248 | 42 | 0.579470% |
| D | 7249 | 281 | 3.876397% |
Noise dominated data is calculated using 1-second bins in cleaned event files. If a bin has >2000 counts, and if more than 50% of those come from <1% of pixels, then it is considered to be noise-dominated and hence unusable.
| Quadrant | # 1 sec bins | Bins with >0 counts | Bins with >2000 counts | High rate bins dominated by noise | Noise dominated (total time) | Noise dominated (detector-on time) | Marked lightcurve |
|---|---|---|---|---|---|---|---|
| A | 7249 | 7249 | 15 | 15 | 0.21% | 0.21% |  |
| B | 7249 | 7249 | 110 | 110 | 1.52% | 1.52% |  |
| C | 7248 | 7248 | 27 | 27 | 0.37% | 0.37% |  |
| D | 7249 | 7249 | 224 | 224 | 3.09% | 3.09% |  |
Top three noisy pixels from each quadrant. If the there are fewer than three noisy pixels in the level2.evt file, extra rows are filled as -1
| Pixel properties | Quadrant properties | ||||||
|---|---|---|---|---|---|---|---|
| Quadrant | DetID | PixID | Counts | Sigma | Mean | Median | Sigma |
| A | 10 | 83 | 3490719 | 20653.08 | 808 | 791 | 169.0 |
| A | 0 | 247 | 112549 | 661.37 | 808 | 791 | 169.0 |
| A | 13 | 248 | 58512 | 341.59 | 808 | 791 | 169.0 |
| B | 5 | 255 | 335427 | 2097.78 | 804 | 779 | 159.5 |
| B | 3 | 112 | 253132 | 1581.91 | 804 | 779 | 159.5 |
| B | 8 | 234 | 229647 | 1434.69 | 804 | 779 | 159.5 |
| C | 9 | 54 | 182704 | 968.89 | 794 | 795 | 187.8 |
| C | 14 | 254 | 131317 | 695.19 | 794 | 795 | 187.8 |
| C | 1 | 3 | 59250 | 311.34 | 794 | 795 | 187.8 |
| D | 7 | 80 | 537816 | 2704.1 | 785 | 760 | 198.6 |
| D | 13 | 249 | 317737 | 1595.99 | 785 | 760 | 198.6 |
| D | 5 | 171 | 240969 | 1209.46 | 785 | 760 | 198.6 |
Histogram calculated using DETX and DETY for each event in the final _common_clean file
| Quadrant A |  |
 |
Quadrant B |
|---|---|---|---|
| Quadrant D |  |
 |
Quadrant C |
| Plot type | Count rate plots | Images |
|---|---|---|
| Comparison with Poisson distribution Blue bars denote a histogram of data divided into 1 sec bins. Red curve is a Poisson curve with rate = median count rate of data. |
 |
 |
| Quadrant-wise count rates Data is divided into 100 sec bins |
 |
|
| Module-wise count rates for Quadrant A Data is divided into 100 sec bins |
 |
 |
| Module-wise count rates for Quadrant B Data is divided into 100 sec bins |
 |
 |
| Module-wise count rates for Quadrant C Data is divided into 100 sec bins |
 |
 |
| Module-wise count rates for Quadrant D Data is divided into 100 sec bins |
 |
 |
| Parameter | Plot |
|---|---|
| CZT HV Monitor |  |
| D_VDD |  |
| Temperature 1 |  |
| Veto HV Monitor |  |
| Veto LLD |  |
| Alpha Counter |  |
| _CPM_Rate |  |
| CZT Counter |  |
| +2.5 Volts monitor | 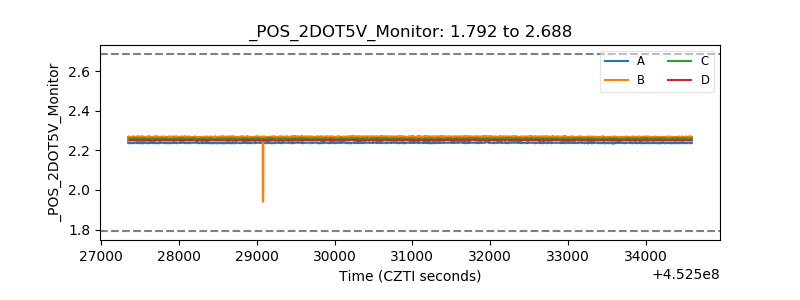 |
| +5 Volts monitor | 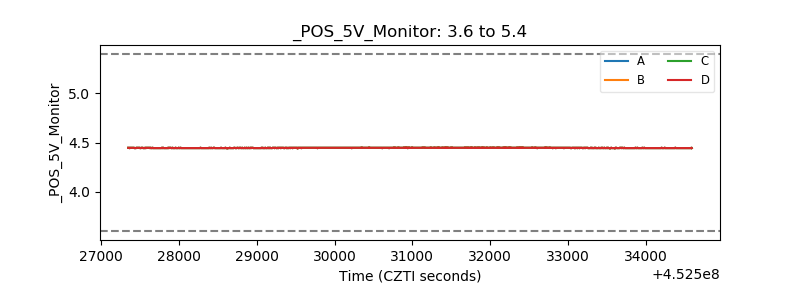 |
| _ROLL_ROT |  |
| _Roll_DEC |  |
| _Roll_RA |  |
| Veto Counter |  |