| Param | Original file | Final file |
|---|---|---|
| Filename | modeM0/AS1A13_091T08_9000006228_46546cztM0_level2.fits | modeM0/AS1A13_091T08_9000006228_46546cztM0_level2_quad_clean.evt |
| Size (bytes) | 570,602,880 | 114,402,240 |
| Size | 544.2 MB | 109.1 MB |
| Events in quadrant A | 6,554,535 | 766,742 |
| Events in quadrant B | 3,570,045 | 807,641 |
| Events in quadrant C | 4,842,041 | 742,359 |
| Events in quadrant D | 5,627,270 | 672,704 |
| Mode SS | |||
|---|---|---|---|
| Quadrant | BADHDUFLAG | Total packets | Discarded packets |
| A | 0 | 138 | 0 |
| B | 0 | 138 | 0 |
| C | 0 | 138 | 0 |
| D | 0 | 138 | 0 |
| Mode M9 | |||
|---|---|---|---|
| Quadrant | BADHDUFLAG | Total packets | Discarded packets |
| A | 0 | 24 | 0 |
| B | 0 | 24 | 0 |
| C | 0 | 24 | 0 |
| D | 0 | 24 | 0 |
| Mode M0 | |||
|---|---|---|---|
| Quadrant | BADHDUFLAG | Total packets | Discarded packets |
| A | 0 | 23882 | 2 |
| B | 0 | 15068 | 2 |
| C | 0 | 19032 | 2 |
| D | 0 | 21387 | 2 |
| Quadrant | Total seconds | Saturated seconds | Saturation percentage |
|---|---|---|---|
| A | 6815 | 255 | 3.741746% |
| B | 6815 | 161 | 2.362436% |
| C | 6815 | 458 | 6.720470% |
| D | 6815 | 520 | 7.630227% |
Noise dominated data is calculated using 1-second bins in cleaned event files. If a bin has >2000 counts, and if more than 50% of those come from <1% of pixels, then it is considered to be noise-dominated and hence unusable.
| Quadrant | # 1 sec bins | Bins with >0 counts | Bins with >2000 counts | High rate bins dominated by noise | Noise dominated (total time) | Noise dominated (detector-on time) | Marked lightcurve |
|---|---|---|---|---|---|---|---|
| A | 9130 | 6815 | 62 | 62 | 0.68% | 0.91% | 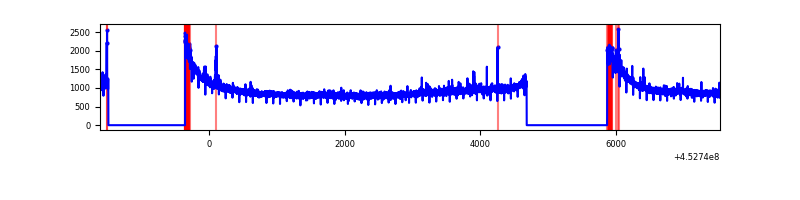 |
| B | 9130 | 6815 | 54 | 54 | 0.59% | 0.79% | 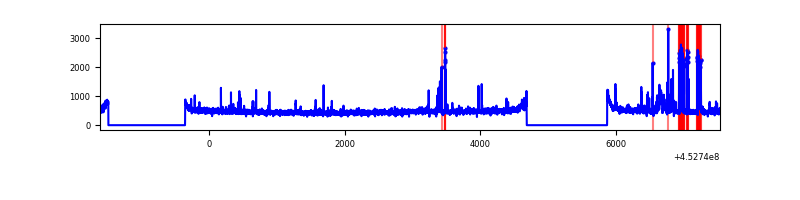 |
| C | 9130 | 6817 | 401 | 401 | 4.39% | 5.88% | 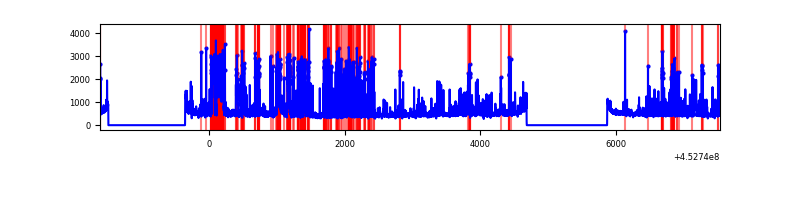 |
| D | 9130 | 6817 | 401 | 401 | 4.39% | 5.88% | 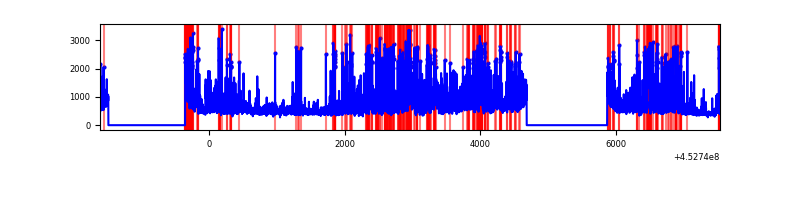 |
Top three noisy pixels from each quadrant. If the there are fewer than three noisy pixels in the level2.evt file, extra rows are filled as -1
| Pixel properties | Quadrant properties | ||||||
|---|---|---|---|---|---|---|---|
| Quadrant | DetID | PixID | Counts | Sigma | Mean | Median | Sigma |
| A | 10 | 83 | 3360084 | 20398.73 | 794 | 778 | 164.7 |
| A | 9 | 191 | 81447 | 489.85 | 794 | 778 | 164.7 |
| A | 13 | 248 | 14222 | 81.64 | 794 | 778 | 164.7 |
| B | 4 | 171 | 255963 | 1611.35 | 803 | 777 | 158.4 |
| B | 5 | 32 | 25016 | 153.05 | 803 | 777 | 158.4 |
| B | 3 | 112 | 21820 | 132.87 | 803 | 777 | 158.4 |
| C | 14 | 254 | 629085 | 3469.68 | 770 | 774 | 181.1 |
| C | 1 | 241 | 620413 | 3421.8 | 770 | 774 | 181.1 |
| C | 9 | 54 | 560102 | 3088.74 | 770 | 774 | 181.1 |
| D | 1 | 52 | 1957672 | 10135.4 | 756 | 734 | 193.1 |
| D | 13 | 249 | 320858 | 1657.99 | 756 | 734 | 193.1 |
| D | 2 | 120 | 155335 | 800.71 | 756 | 734 | 193.1 |
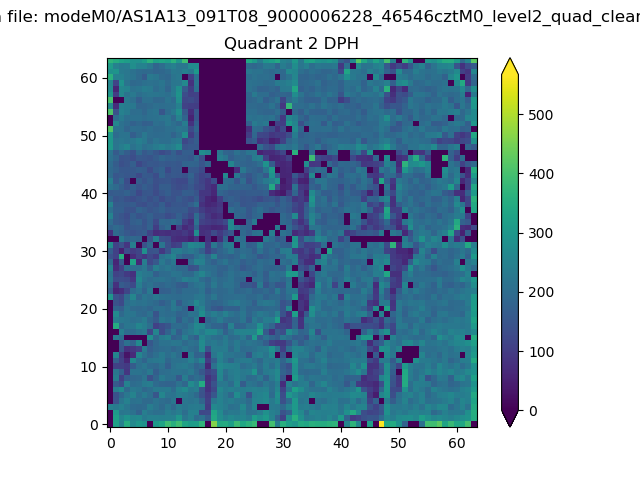
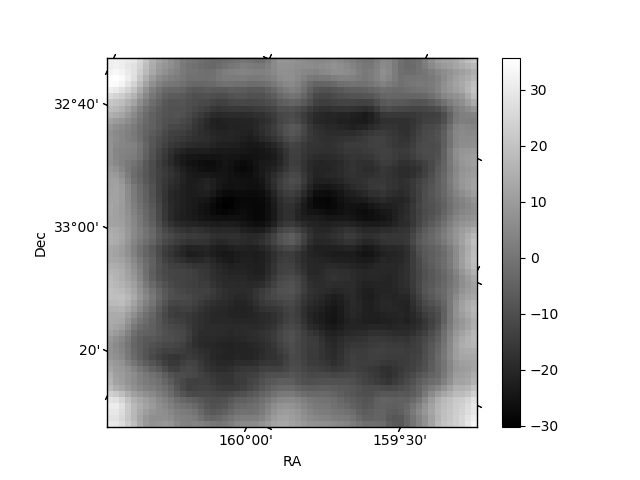
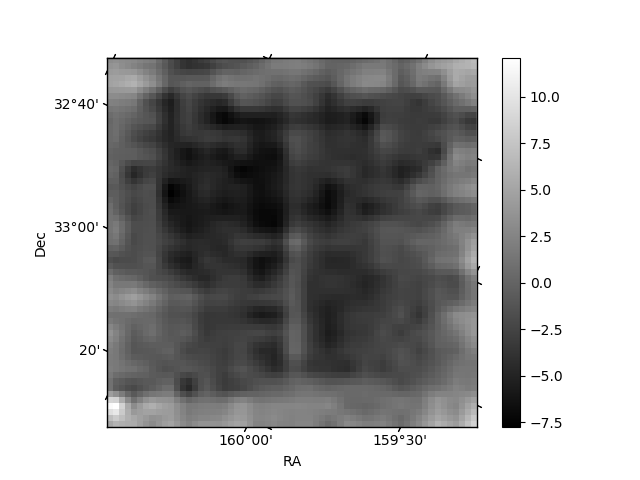
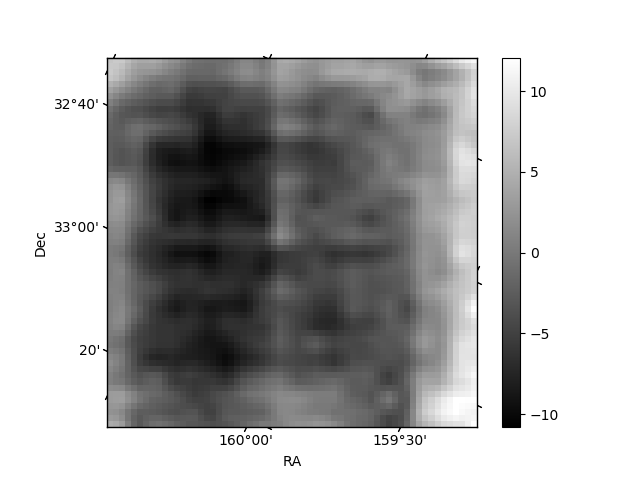
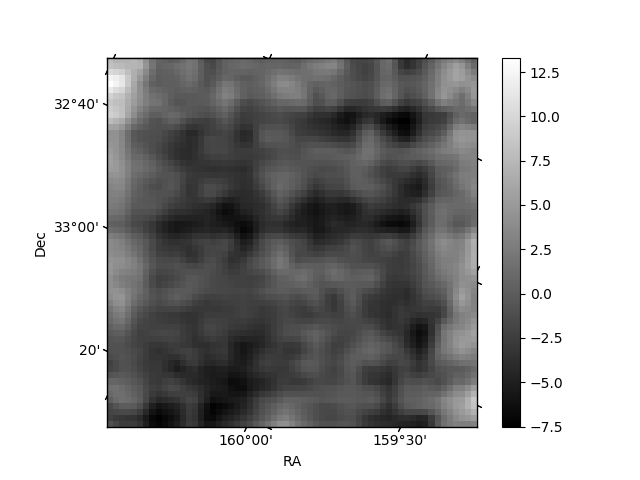
Histogram calculated using DETX and DETY for each event in the final _common_clean file
| Quadrant A | 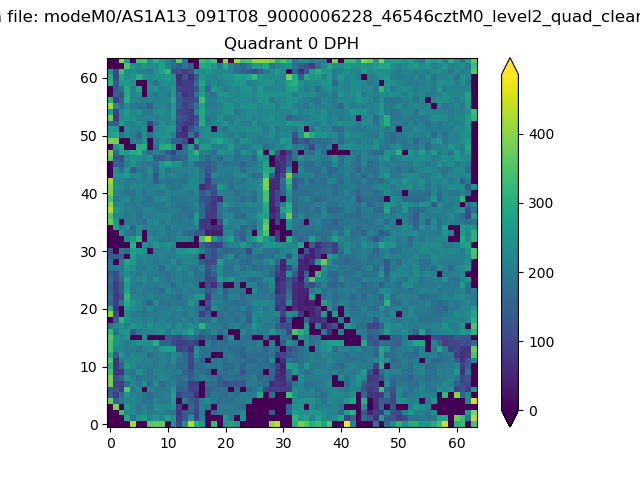 |
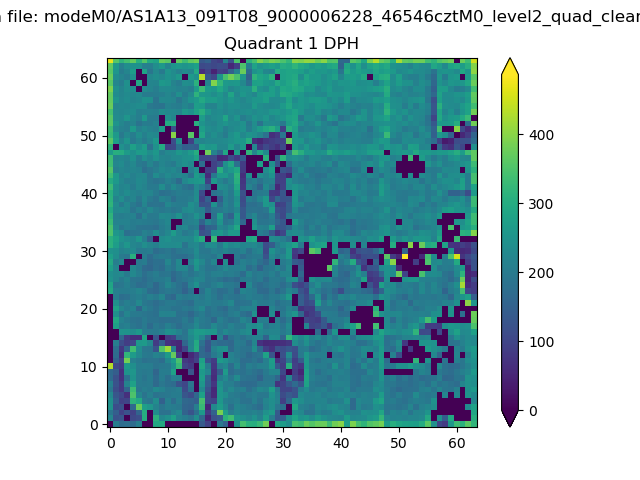 |
Quadrant B |
|---|---|---|---|
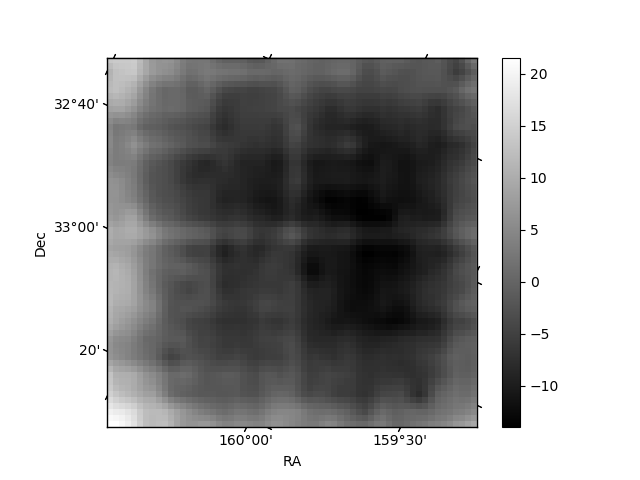
| Quadrant D | 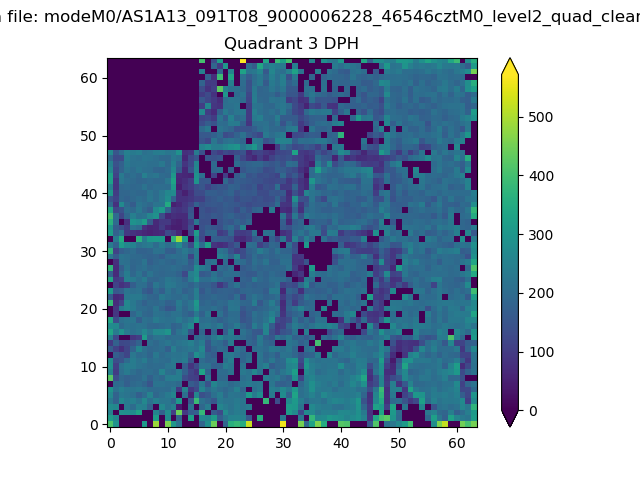 |
 |
Quadrant C |
| Plot type | Count rate plots | Images |
|---|---|---|
| Comparison with Poisson distribution Blue bars denote a histogram of data divided into 1 sec bins. Red curve is a Poisson curve with rate = median count rate of data. |
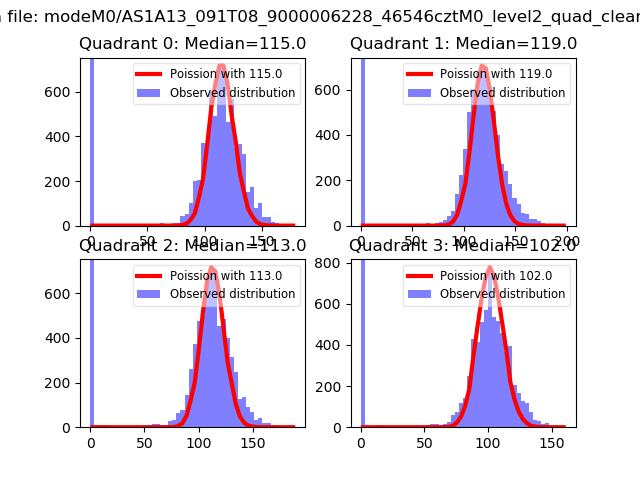 |
 |
| Quadrant-wise count rates Data is divided into 100 sec bins |
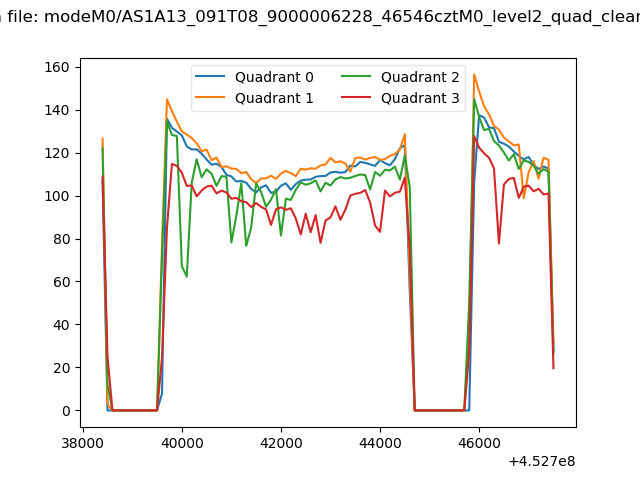 |
|
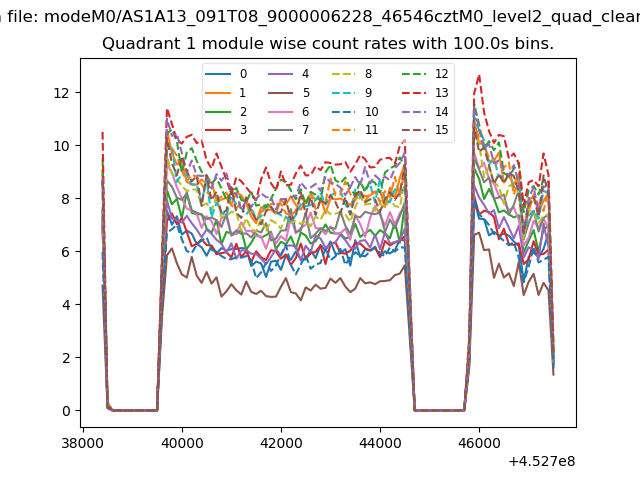
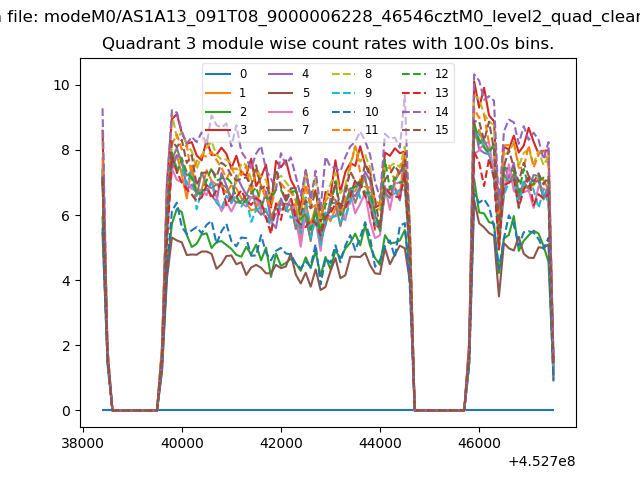
| Module-wise count rates for Quadrant A Data is divided into 100 sec bins |
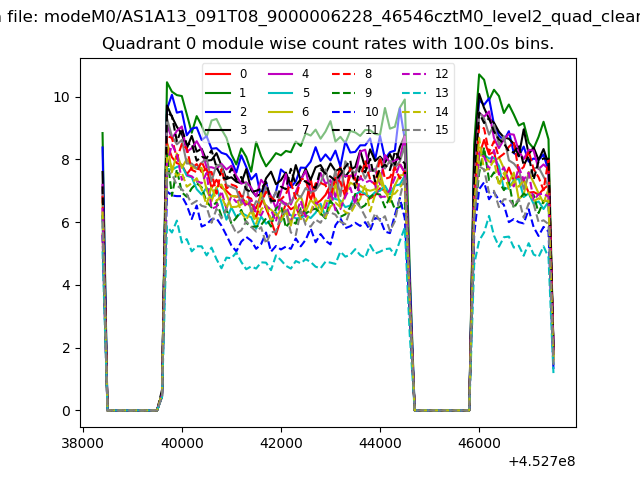 |
 |
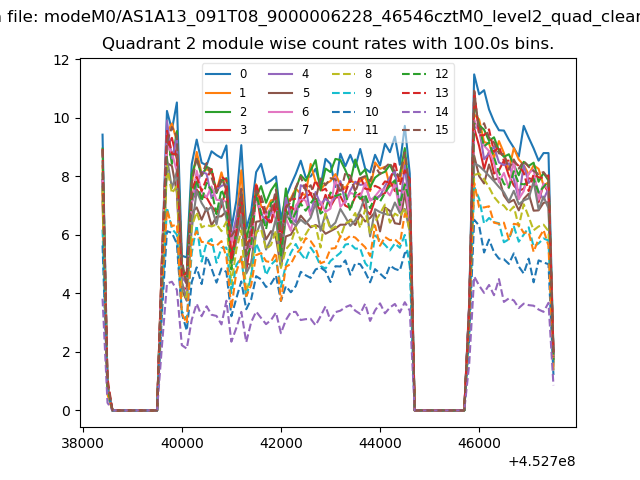
| Module-wise count rates for Quadrant B Data is divided into 100 sec bins |
 |
 |
| Module-wise count rates for Quadrant C Data is divided into 100 sec bins |
 |
 |
| Module-wise count rates for Quadrant D Data is divided into 100 sec bins |
 |
 |
| Parameter | Plot |
|---|---|
| CZT HV Monitor | 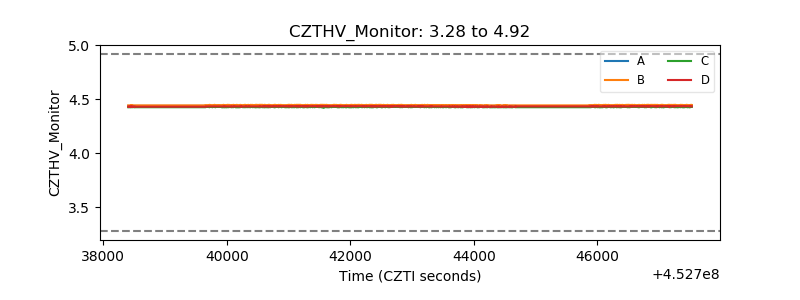 |
| D_VDD | 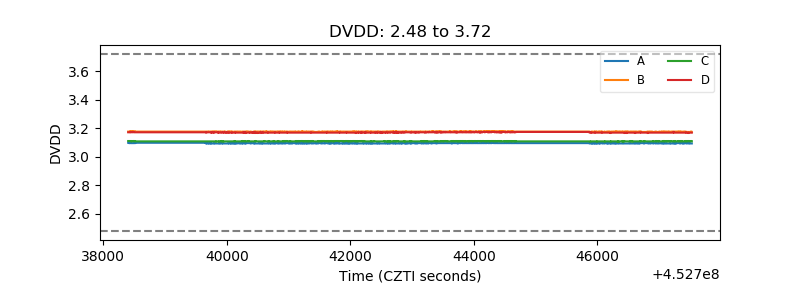 |
| Temperature 1 | 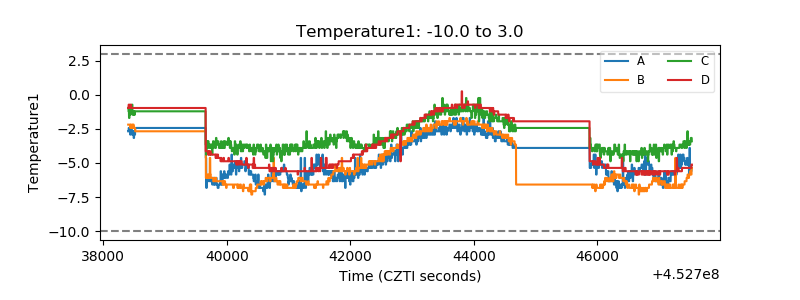 |
| Veto HV Monitor |  |
| Veto LLD | 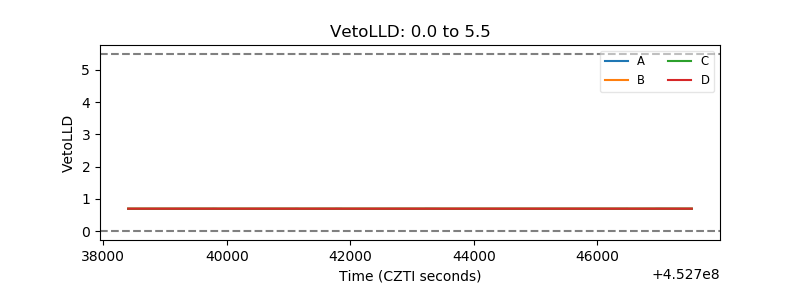 |
| Alpha Counter | 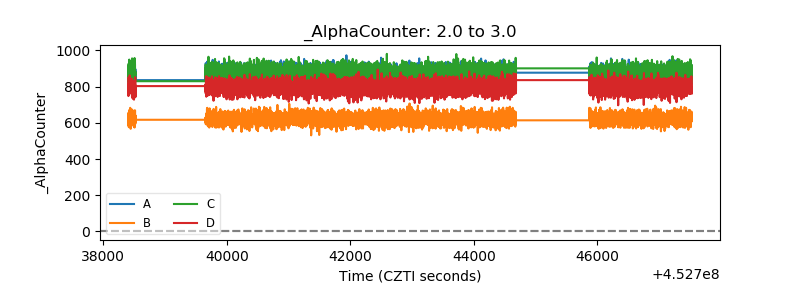 |
| _CPM_Rate | 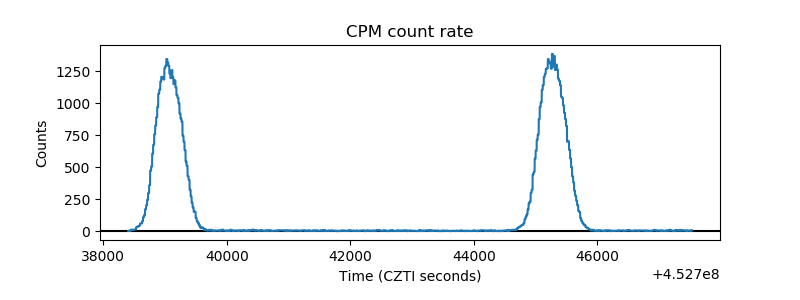 |
| CZT Counter | 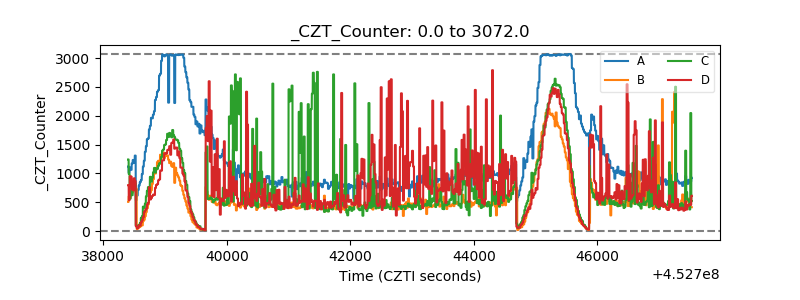 |
| +2.5 Volts monitor | 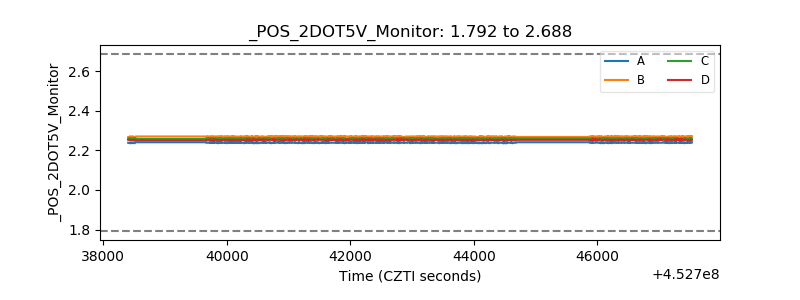 |
| +5 Volts monitor | 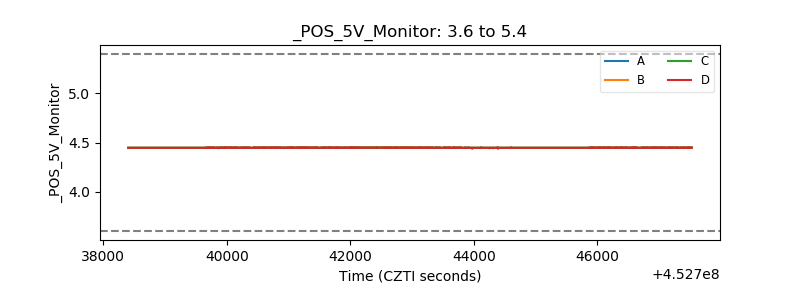 |
| _ROLL_ROT | 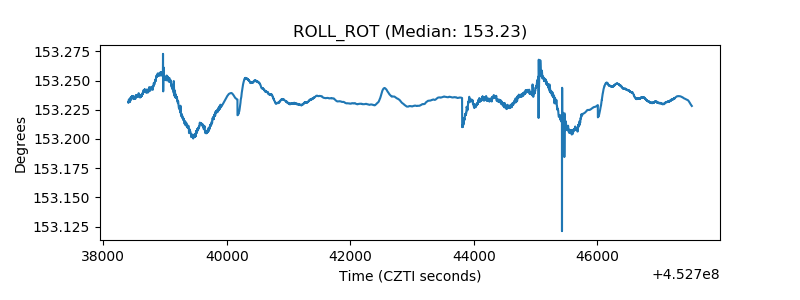 |
| _Roll_DEC | 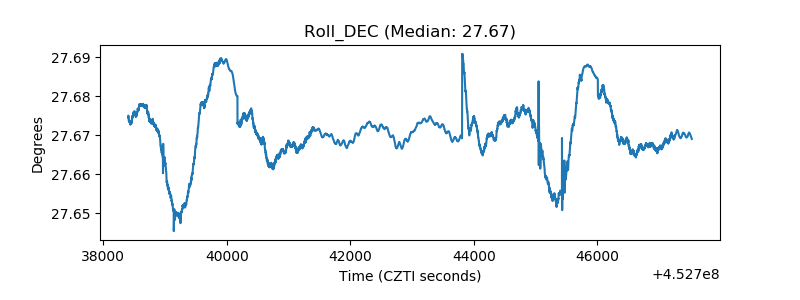 |
| _Roll_RA | 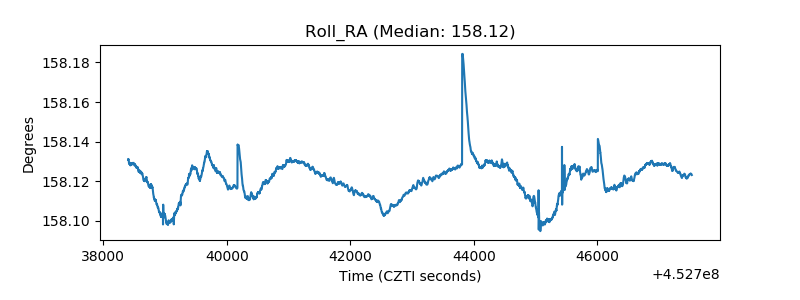 |
| Veto Counter | 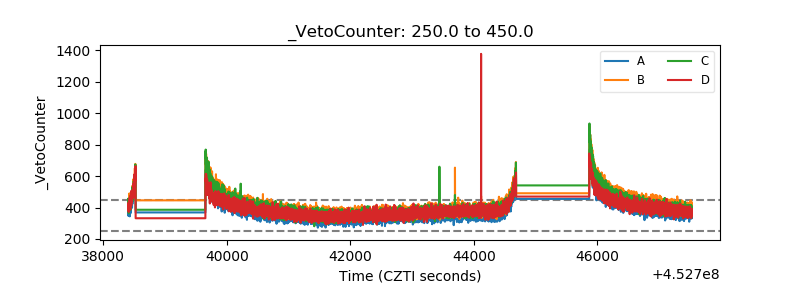 |