| Param | Original file | Final file |
|---|---|---|
| Filename | modeM0/AS1C03_005T02_9000006230_46565cztM0_level2.fits | modeM0/AS1C03_005T02_9000006230_46565cztM0_level2_quad_clean.evt |
| Size (bytes) | 303,704,640 | 63,941,760 |
| Size | 289.6 MB | 61.0 MB |
| Events in quadrant A | 3,513,457 | 425,419 |
| Events in quadrant B | 1,740,608 | 435,879 |
| Events in quadrant C | 1,631,475 | 423,040 |
| Events in quadrant D | 4,038,831 | 364,691 |
| Mode SS | |||
|---|---|---|---|
| Quadrant | BADHDUFLAG | Total packets | Discarded packets |
| A | 0 | 80 | 0 |
| B | 0 | 80 | 0 |
| C | 0 | 80 | 0 |
| D | 0 | 80 | 0 |
| Mode M0 | |||
|---|---|---|---|
| Quadrant | BADHDUFLAG | Total packets | Discarded packets |
| A | 0 | 12664 | 0 |
| B | 0 | 8255 | 0 |
| C | 0 | 8201 | 0 |
| D | 0 | 14860 | 0 |
| Quadrant | Total seconds | Saturated seconds | Saturation percentage |
|---|---|---|---|
| A | 4075 | 9 | 0.220859% |
| B | 4076 | 8 | 0.196271% |
| C | 4076 | 1 | 0.024534% |
| D | 4076 | 404 | 9.911678% |
Noise dominated data is calculated using 1-second bins in cleaned event files. If a bin has >2000 counts, and if more than 50% of those come from <1% of pixels, then it is considered to be noise-dominated and hence unusable.
| Quadrant | # 1 sec bins | Bins with >0 counts | Bins with >2000 counts | High rate bins dominated by noise | Noise dominated (total time) | Noise dominated (detector-on time) | Marked lightcurve |
|---|---|---|---|---|---|---|---|
| A | 4075 | 4075 | 3 | 3 | 0.07% | 0.07% |  |
| B | 4076 | 4076 | 3 | 3 | 0.07% | 0.07% |  |
| C | 4076 | 4076 | 3 | 3 | 0.07% | 0.07% |  |
| D | 4076 | 4076 | 363 | 363 | 8.91% | 8.91% |  |
Top three noisy pixels from each quadrant. If the there are fewer than three noisy pixels in the level2.evt file, extra rows are filled as -1
| Pixel properties | Quadrant properties | ||||||
|---|---|---|---|---|---|---|---|
| Quadrant | DetID | PixID | Counts | Sigma | Mean | Median | Sigma |
| A | 10 | 83 | 1833153 | 20865.26 | 421 | 411 | 87.8 |
| A | 9 | 191 | 14351 | 158.7 | 421 | 411 | 87.8 |
| A | 15 | 235 | 13270 | 146.4 | 421 | 411 | 87.8 |
| B | 3 | 112 | 24196 | 287.95 | 416 | 404 | 82.6 |
| B | 0 | 245 | 22472 | 267.08 | 416 | 404 | 82.6 |
| B | 0 | 158 | 15723 | 185.4 | 416 | 404 | 82.6 |
| C | 14 | 254 | 19805 | 200.21 | 410 | 412 | 96.9 |
| C | 12 | 250 | 6248 | 60.25 | 410 | 412 | 96.9 |
| C | 13 | 61 | 2687 | 23.49 | 410 | 412 | 96.9 |
| D | 1 | 52 | 966389 | 9520.96 | 398 | 384 | 101.5 |
| D | 13 | 249 | 655175 | 6453.63 | 398 | 384 | 101.5 |
| D | 8 | 176 | 286476 | 2819.73 | 398 | 384 | 101.5 |
Histogram calculated using DETX and DETY for each event in the final _common_clean file
| Quadrant A |  |
 |
Quadrant B |
|---|---|---|---|
| Quadrant D |  |
 |
Quadrant C |
| Plot type | Count rate plots | Images |
|---|---|---|
| Comparison with Poisson distribution Blue bars denote a histogram of data divided into 1 sec bins. Red curve is a Poisson curve with rate = median count rate of data. |
 |
 |
| Quadrant-wise count rates Data is divided into 100 sec bins |
 |
|
| Module-wise count rates for Quadrant A Data is divided into 100 sec bins |
 |
 |
| Module-wise count rates for Quadrant B Data is divided into 100 sec bins |
 |
 |
| Module-wise count rates for Quadrant C Data is divided into 100 sec bins |
 |
 |
| Module-wise count rates for Quadrant D Data is divided into 100 sec bins |
 |
 |
| Parameter | Plot |
|---|---|
| CZT HV Monitor |  |
| D_VDD |  |
| Temperature 1 |  |
| Veto HV Monitor |  |
| Veto LLD |  |
| Alpha Counter |  |
| _CPM_Rate |  |
| CZT Counter |  |
| +2.5 Volts monitor | 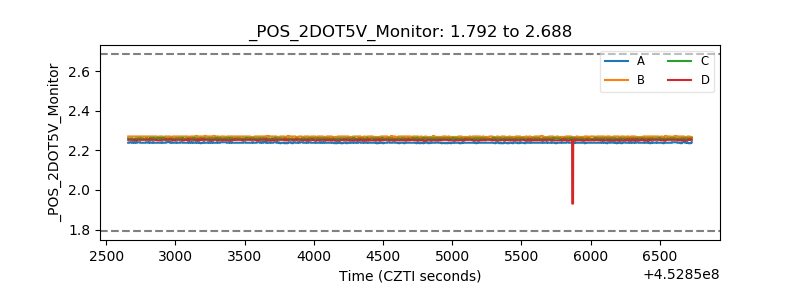 |
| +5 Volts monitor | 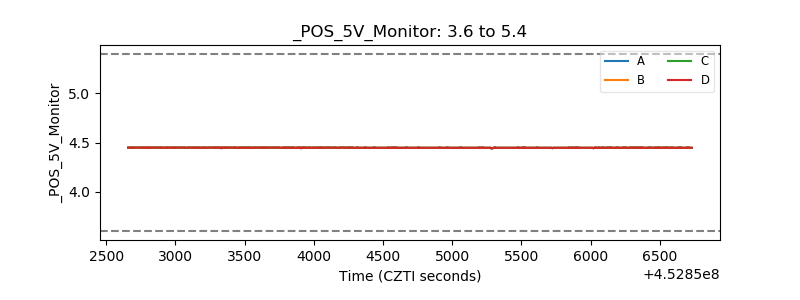 |
| _ROLL_ROT |  |
| _Roll_DEC |  |
| _Roll_RA |  |
| Veto Counter |  |