| Param | Original file | Final file |
|---|---|---|
| Filename | modeM0/AS1A13_092T16_9000006244_46637cztM0_level2.fits | modeM0/AS1A13_092T16_9000006244_46637cztM0_level2_quad_clean.evt |
| Size (bytes) | 573,649,920 | 136,895,040 |
| Size | 547.1 MB | 130.6 MB |
| Events in quadrant A | 7,209,997 | 934,891 |
| Events in quadrant B | 4,088,196 | 910,629 |
| Events in quadrant C | 3,578,510 | 908,104 |
| Events in quadrant D | 5,779,171 | 872,788 |
| Mode SS | |||
|---|---|---|---|
| Quadrant | BADHDUFLAG | Total packets | Discarded packets |
| A | 0 | 152 | 0 |
| B | 0 | 152 | 0 |
| C | 0 | 152 | 0 |
| D | 0 | 152 | 0 |
| Mode M9 | |||
|---|---|---|---|
| Quadrant | BADHDUFLAG | Total packets | Discarded packets |
| A | 0 | 13 | 0 |
| B | 0 | 13 | 0 |
| C | 0 | 13 | 0 |
| D | 0 | 13 | 0 |
| Mode M0 | |||
|---|---|---|---|
| Quadrant | BADHDUFLAG | Total packets | Discarded packets |
| A | 0 | 25999 | 3 |
| B | 0 | 17311 | 3 |
| C | 0 | 16311 | 3 |
| D | 0 | 22355 | 3 |
| Quadrant | Total seconds | Saturated seconds | Saturation percentage |
|---|---|---|---|
| A | 7463 | 607 | 8.133458% |
| B | 7464 | 477 | 6.390675% |
| C | 7464 | 214 | 2.867095% |
| D | 7464 | 558 | 7.475884% |
Noise dominated data is calculated using 1-second bins in cleaned event files. If a bin has >2000 counts, and if more than 50% of those come from <1% of pixels, then it is considered to be noise-dominated and hence unusable.
| Quadrant | # 1 sec bins | Bins with >0 counts | Bins with >2000 counts | High rate bins dominated by noise | Noise dominated (total time) | Noise dominated (detector-on time) | Marked lightcurve |
|---|---|---|---|---|---|---|---|
| A | 8708 | 7466 | 110 | 110 | 1.26% | 1.47% | 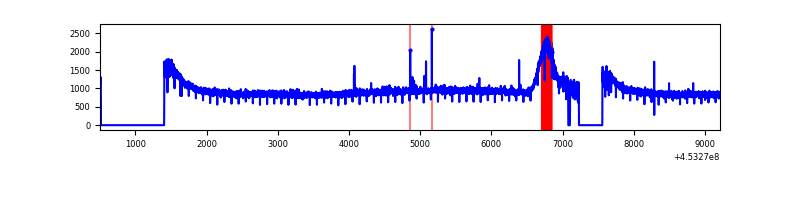 |
| B | 8709 | 7467 | 45 | 45 | 0.52% | 0.60% | 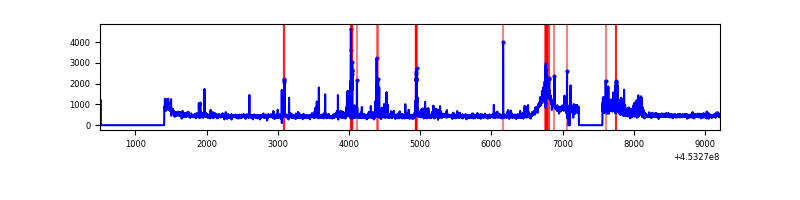 |
| C | 8709 | 7467 | 5 | 5 | 0.06% | 0.07% | 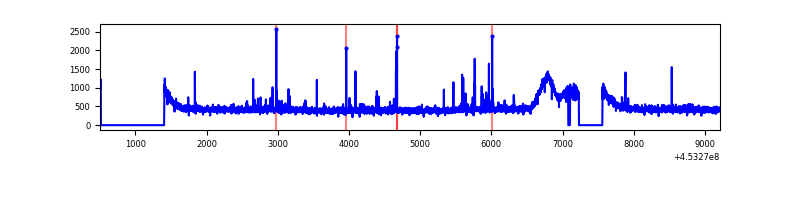 |
| D | 8709 | 7467 | 281 | 281 | 3.23% | 3.76% | 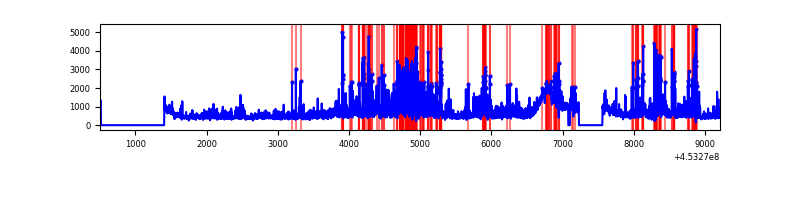 |
Top three noisy pixels from each quadrant. If the there are fewer than three noisy pixels in the level2.evt file, extra rows are filled as -1
| Pixel properties | Quadrant properties | ||||||
|---|---|---|---|---|---|---|---|
| Quadrant | DetID | PixID | Counts | Sigma | Mean | Median | Sigma |
| A | 10 | 83 | 3627467 | 18610.51 | 919 | 898 | 194.9 |
| A | 13 | 254 | 12599 | 60.05 | 919 | 898 | 194.9 |
| A | 0 | 243 | 10225 | 47.86 | 919 | 898 | 194.9 |
| B | 5 | 32 | 259406 | 1423.49 | 893 | 867 | 181.6 |
| B | 0 | 189 | 104990 | 573.29 | 893 | 867 | 181.6 |
| B | 15 | 201 | 53121 | 287.71 | 893 | 867 | 181.6 |
| C | 14 | 254 | 53045 | 245.98 | 889 | 896 | 212.0 |
| C | 12 | 249 | 36332 | 167.15 | 889 | 896 | 212.0 |
| C | 3 | 233 | 8590 | 36.29 | 889 | 896 | 212.0 |
| D | 1 | 52 | 1294042 | 5491.48 | 902 | 872 | 235.5 |
| D | 12 | 128 | 320828 | 1358.7 | 902 | 872 | 235.5 |
| D | 13 | 249 | 212119 | 897.07 | 902 | 872 | 235.5 |
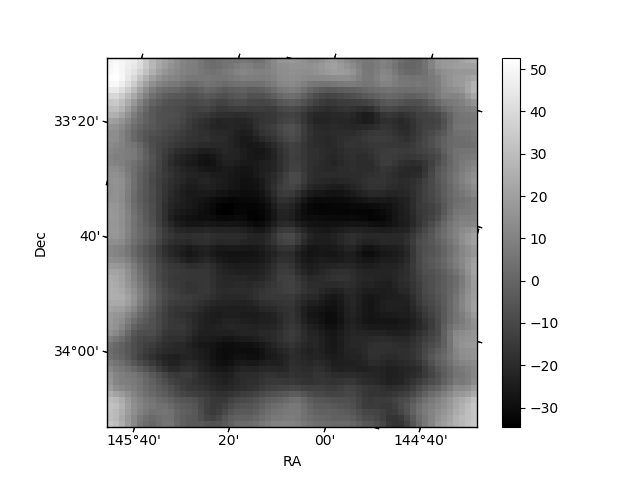
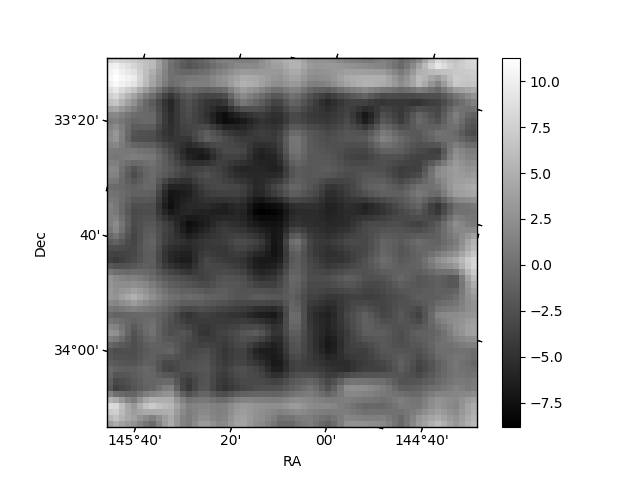
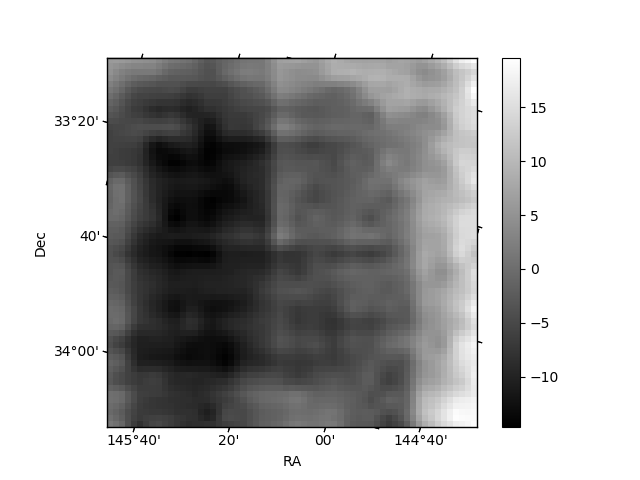
Histogram calculated using DETX and DETY for each event in the final _common_clean file
| Quadrant A | 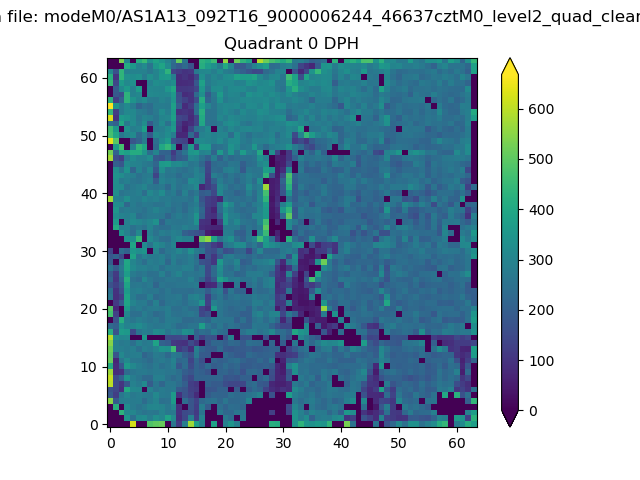 |
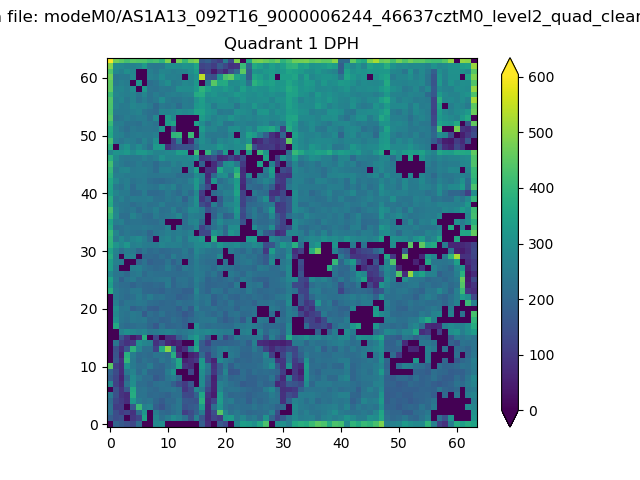 |
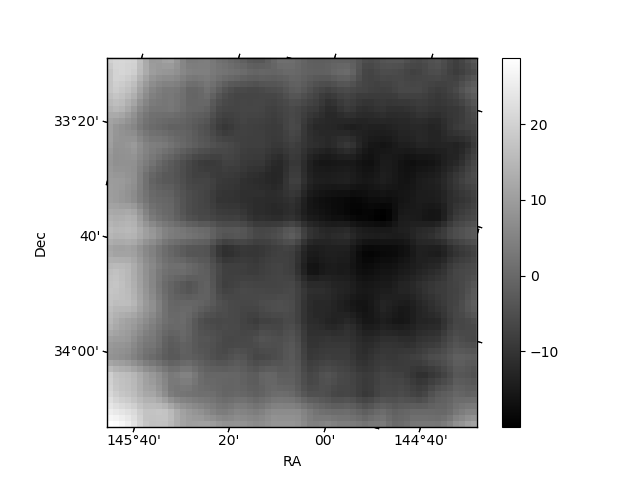
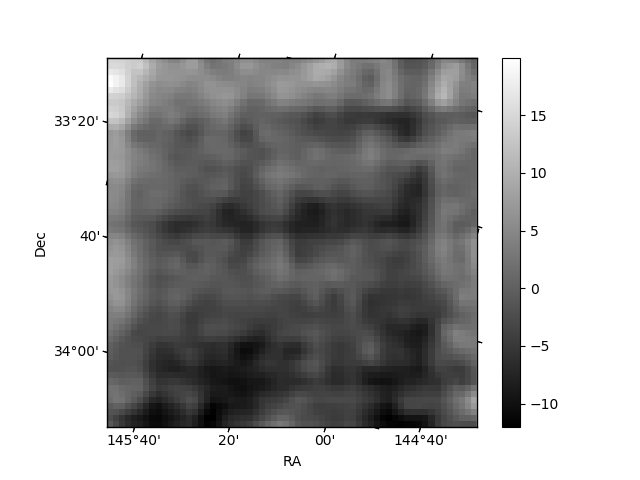
Quadrant B |
|---|---|---|---|
| Quadrant D | 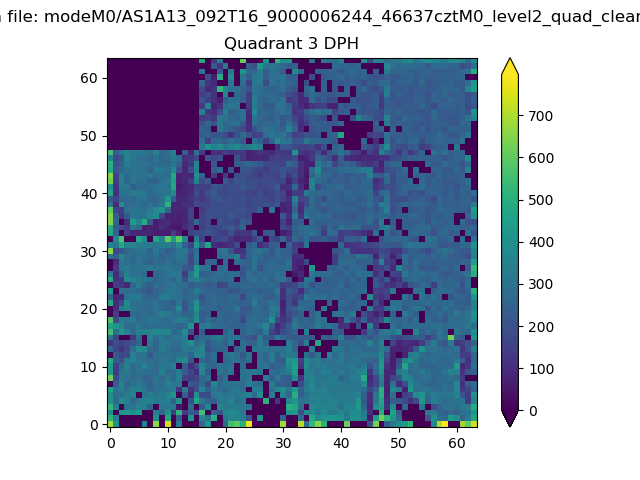 |
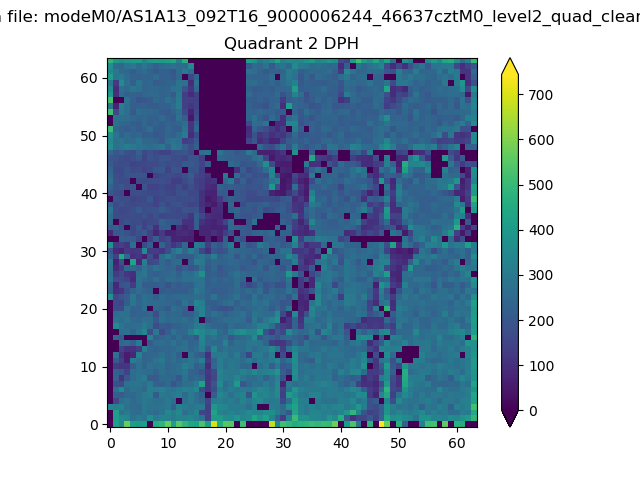 |
Quadrant C |
| Plot type | Count rate plots | Images |
|---|---|---|
| Comparison with Poisson distribution Blue bars denote a histogram of data divided into 1 sec bins. Red curve is a Poisson curve with rate = median count rate of data. |
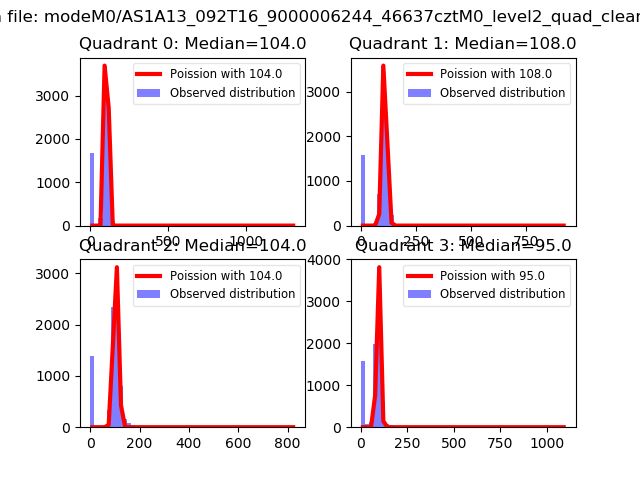 |
 |
| Quadrant-wise count rates Data is divided into 100 sec bins |
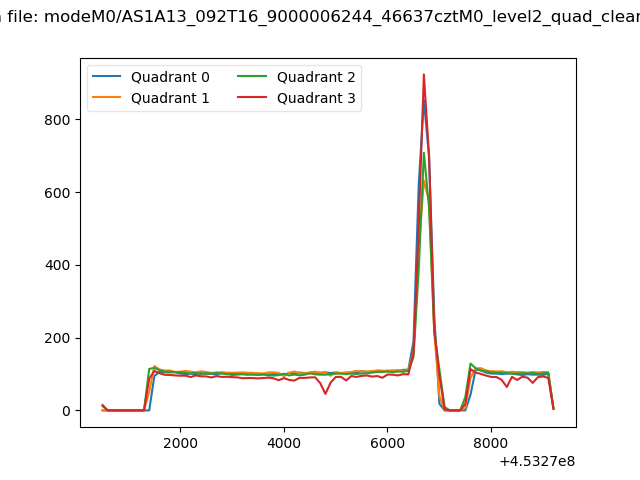 |
|
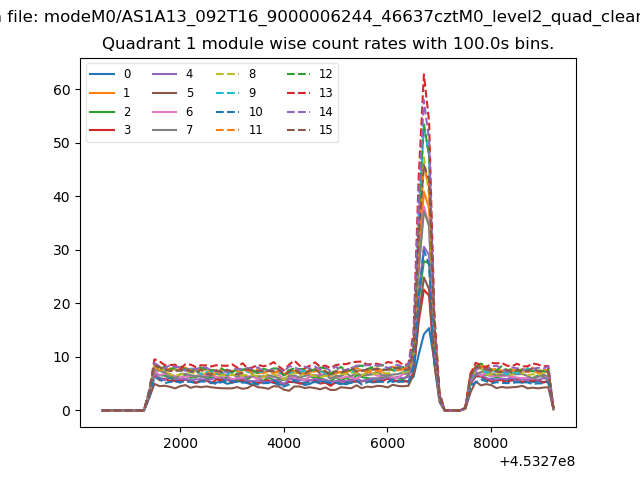
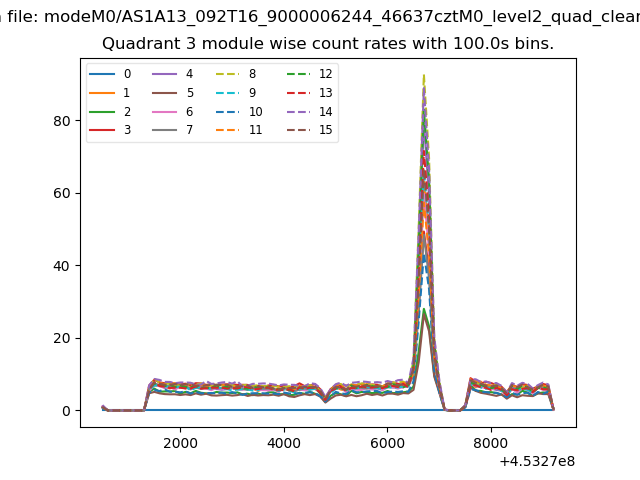
| Module-wise count rates for Quadrant A Data is divided into 100 sec bins |
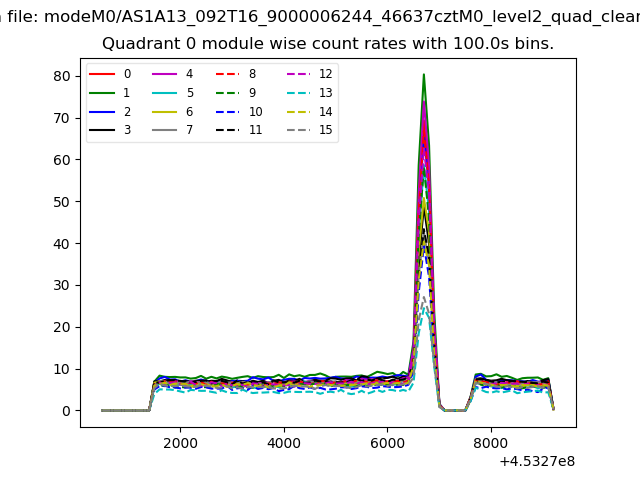 |
 |
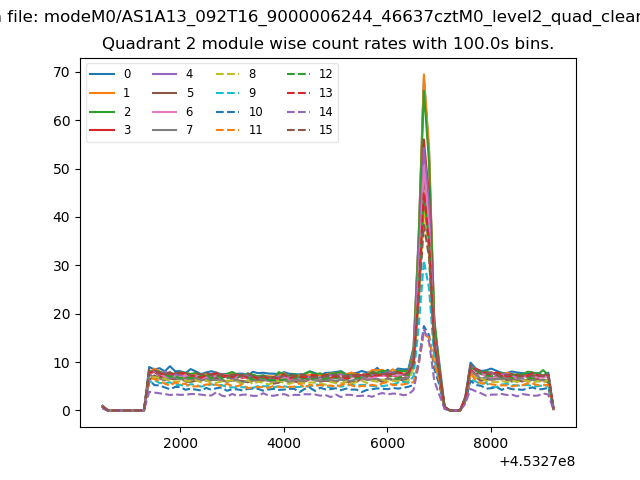
| Module-wise count rates for Quadrant B Data is divided into 100 sec bins |
 |
 |
| Module-wise count rates for Quadrant C Data is divided into 100 sec bins |
 |
 |
| Module-wise count rates for Quadrant D Data is divided into 100 sec bins |
 |
 |
| Parameter | Plot |
|---|---|
| CZT HV Monitor | 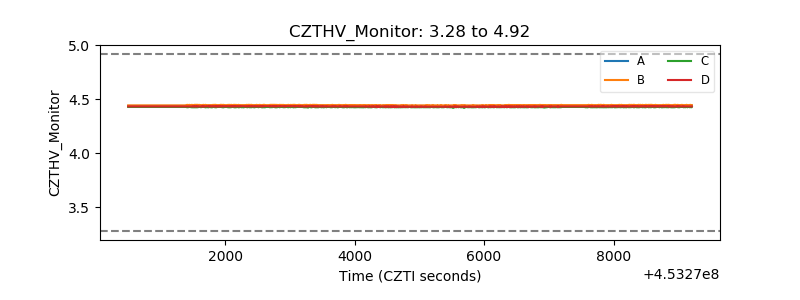 |
| D_VDD | 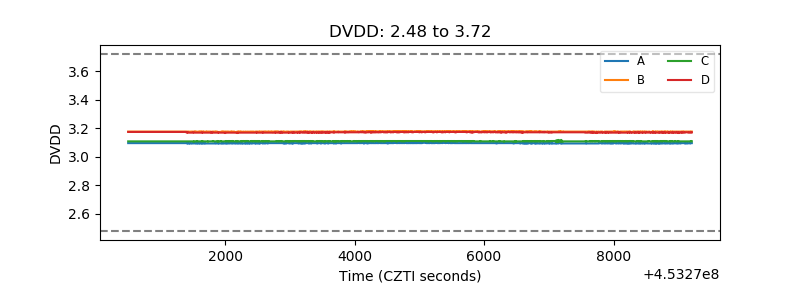 |
| Temperature 1 | 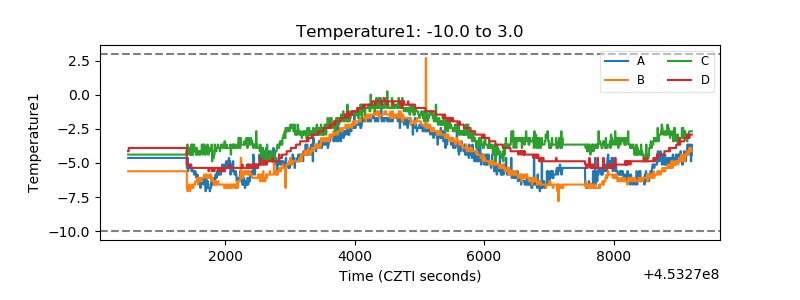 |
| Veto HV Monitor | 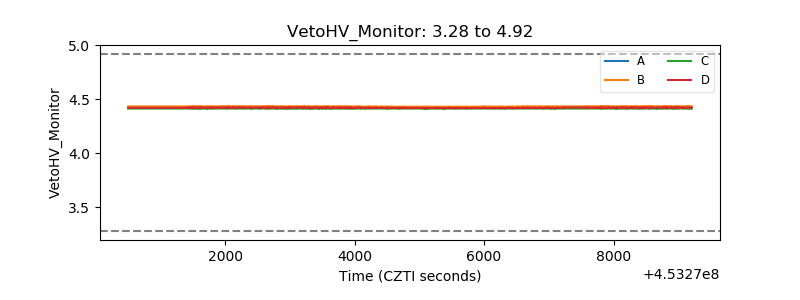 |
| Veto LLD | 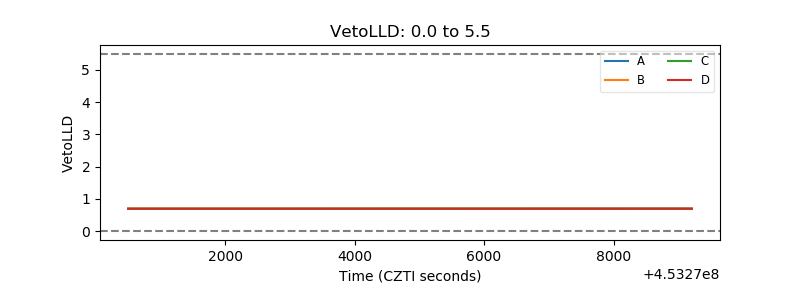 |
| Alpha Counter | 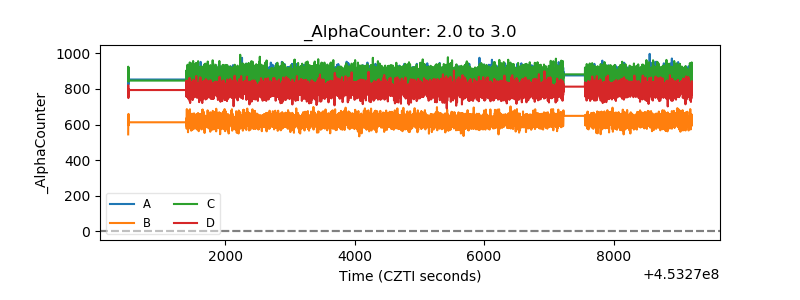 |
| _CPM_Rate | 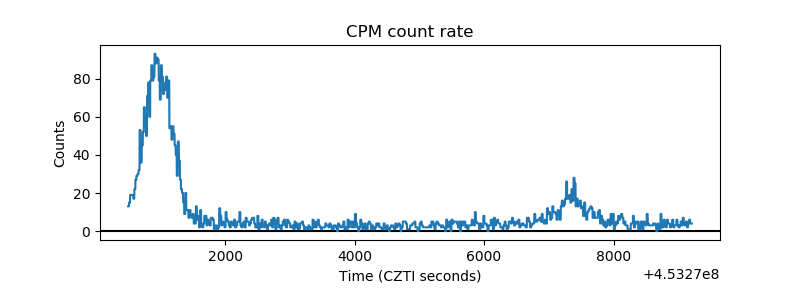 |
| CZT Counter | 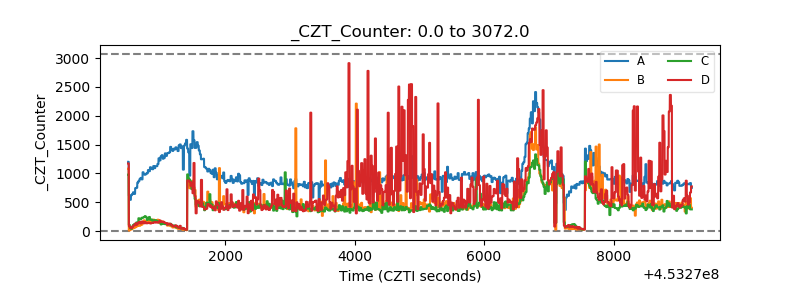 |
| +2.5 Volts monitor | 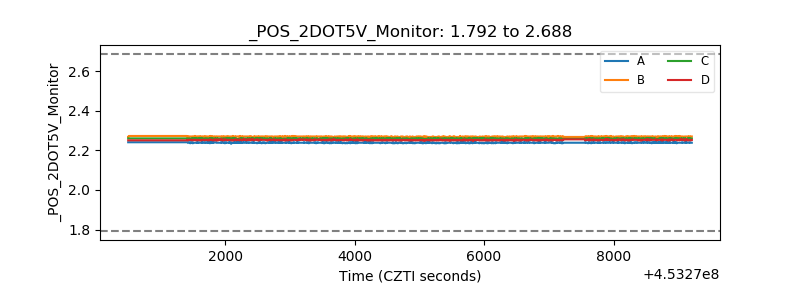 |
| +5 Volts monitor | 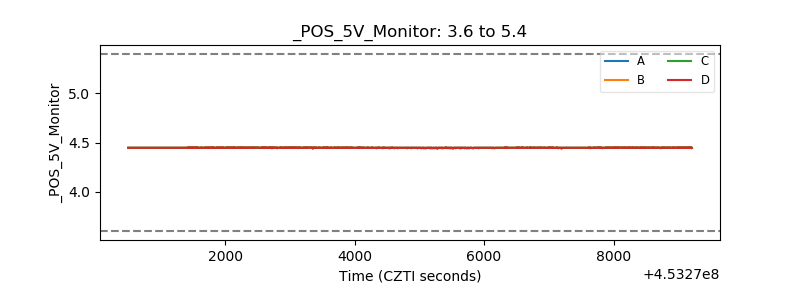 |
| _ROLL_ROT | 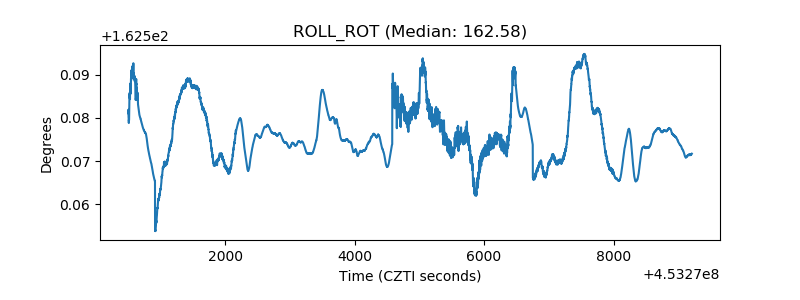 |
| _Roll_DEC | 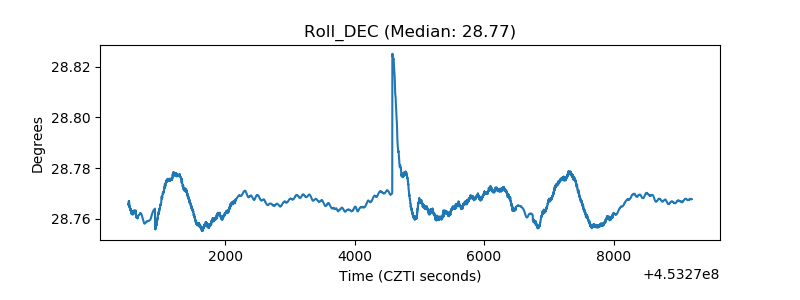 |
| _Roll_RA | 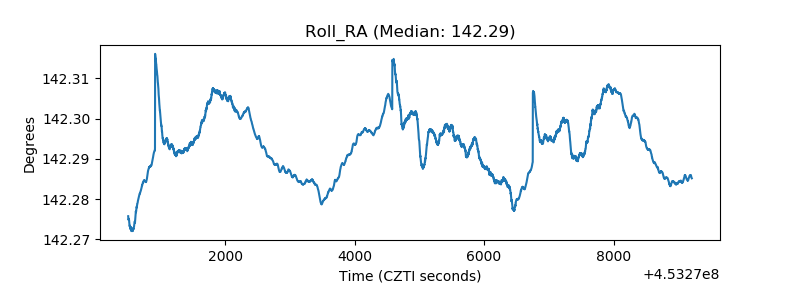 |
| Veto Counter | 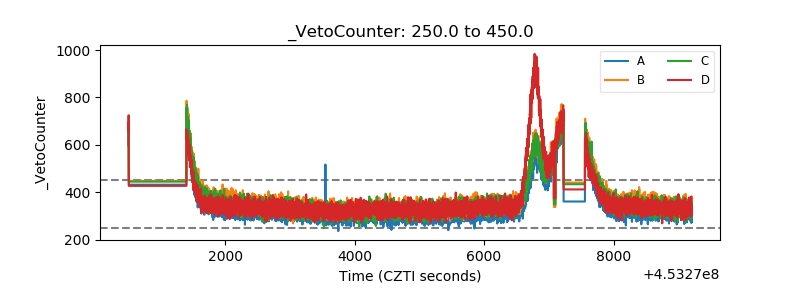 |