| Param | Original file | Final file |
|---|---|---|
| Filename | modeM0/AS1A13_092T16_9000006250_46675cztM0_level2.fits | modeM0/AS1A13_092T16_9000006250_46675cztM0_level2_quad_clean.evt |
| Size (bytes) | 14,287,680 | 1,336,320 |
| Size | 13.6 MB | 1.3 MB |
| Events in quadrant A | 281,085 | 3,585 |
| Events in quadrant B | 69,427 | 6,646 |
| Events in quadrant C | 59,378 | 6,454 |
| Events in quadrant D | 103,816 | 5,509 |
| Mode SS | |||
|---|---|---|---|
| Quadrant | BADHDUFLAG | Total packets | Discarded packets |
| A | 0 | 2 | 0 |
| B | 0 | 2 | 0 |
| C | 0 | 2 | 0 |
| D | 0 | 2 | 0 |
| Mode M0 | |||
|---|---|---|---|
| Quadrant | BADHDUFLAG | Total packets | Discarded packets |
| A | 0 | 932 | 0 |
| B | 0 | 309 | 0 |
| C | 0 | 294 | 0 |
| D | 0 | 420 | 0 |
| Quadrant | Total seconds | Saturated seconds | Saturation percentage |
|---|---|---|---|
| A | 146 | 46 | 31.506849% |
| B | 146 | 1 | 0.684932% |
| C | 146 | 0 | 0.000000% |
| D | 146 | 0 | 0.000000% |
Noise dominated data is calculated using 1-second bins in cleaned event files. If a bin has >2000 counts, and if more than 50% of those come from <1% of pixels, then it is considered to be noise-dominated and hence unusable.
| Quadrant | # 1 sec bins | Bins with >0 counts | Bins with >2000 counts | High rate bins dominated by noise | Noise dominated (total time) | Noise dominated (detector-on time) | Marked lightcurve |
|---|---|---|---|---|---|---|---|
| A | 146 | 146 | 59 | 59 | 40.41% | 40.41% |  |
| B | 146 | 146 | 0 | 0 | 0.00% | 0.00% |  |
| C | 146 | 146 | 0 | 0 | 0.00% | 0.00% |  |
| D | 146 | 146 | 0 | 0 | 0.00% | 0.00% |  |
Top three noisy pixels from each quadrant. If the there are fewer than three noisy pixels in the level2.evt file, extra rows are filled as -1
| Pixel properties | Quadrant properties | ||||||
|---|---|---|---|---|---|---|---|
| Quadrant | DetID | PixID | Counts | Sigma | Mean | Median | Sigma |
| A | 15 | 235 | 154494 | 33023.82 | 13 | 13 | 4.7 |
| A | 10 | 83 | 69407 | 14834.54 | 13 | 13 | 4.7 |
| A | 3 | 7 | 2659 | 565.64 | 13 | 13 | 4.7 |
| B | 4 | 171 | 7808 | 1587.98 | 14 | 14 | 4.9 |
| B | 5 | 32 | 561 | 111.45 | 14 | 14 | 4.9 |
| B | 5 | 172 | 553 | 109.82 | 14 | 14 | 4.9 |
| C | 12 | 250 | 1474 | 282.94 | 14 | 14 | 5.2 |
| C | 14 | 67 | 123 | 21.12 | 14 | 14 | 5.2 |
| C | 13 | 61 | 92 | 15.12 | 14 | 14 | 5.2 |
| D | 1 | 52 | 11773 | 2171.22 | 14 | 13 | 5.4 |
| D | 12 | 128 | 11437 | 2109.19 | 14 | 13 | 5.4 |
| D | 13 | 169 | 9851 | 1816.37 | 14 | 13 | 5.4 |
Histogram calculated using DETX and DETY for each event in the final _common_clean file
| Quadrant A |  |
 |
Quadrant B |
|---|---|---|---|
| Quadrant D |  |
 |
Quadrant C |
| Plot type | Count rate plots | Images |
|---|---|---|
| Comparison with Poisson distribution Blue bars denote a histogram of data divided into 1 sec bins. Red curve is a Poisson curve with rate = median count rate of data. |
 |
 |
| Quadrant-wise count rates Data is divided into 100 sec bins |
 |
|
| Module-wise count rates for Quadrant A Data is divided into 100 sec bins |
 |
 |
| Module-wise count rates for Quadrant B Data is divided into 100 sec bins |
 |
 |
| Module-wise count rates for Quadrant C Data is divided into 100 sec bins |
 |
 |
| Module-wise count rates for Quadrant D Data is divided into 100 sec bins |
 |
 |
| Parameter | Plot |
|---|---|
| CZT HV Monitor |  |
| D_VDD |  |
| Temperature 1 |  |
| Veto HV Monitor |  |
| Veto LLD |  |
| Alpha Counter |  |
| _CPM_Rate |  |
| CZT Counter |  |
| +2.5 Volts monitor | 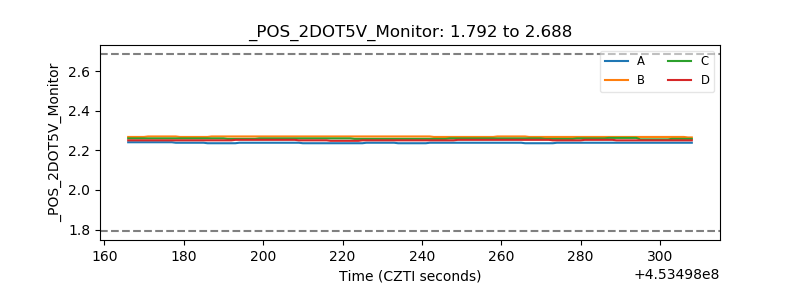 |
| +5 Volts monitor | 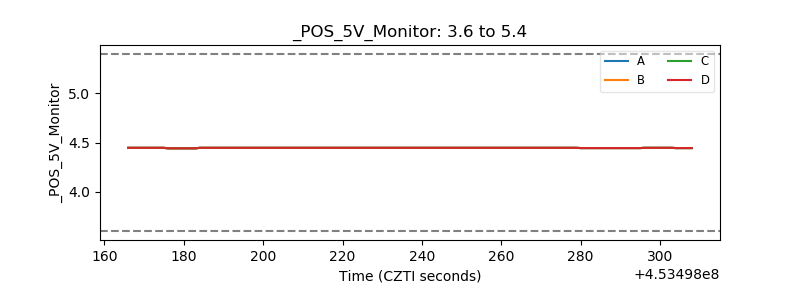 |
| _ROLL_ROT |  |
| _Roll_DEC |  |
| _Roll_RA |  |
| Veto Counter |  |