| Param | Original file | Final file |
|---|---|---|
| Filename | modeM0/AS1A13_092T19_9000006252_46678cztM0_level2.fits | modeM0/AS1A13_092T19_9000006252_46678cztM0_level2_quad_clean.evt |
| Size (bytes) | 470,557,440 | 105,897,600 |
| Size | 448.8 MB | 101.0 MB |
| Events in quadrant A | 6,267,341 | 693,312 |
| Events in quadrant B | 3,422,580 | 735,828 |
| Events in quadrant C | 2,868,083 | 715,825 |
| Events in quadrant D | 4,359,981 | 611,555 |
| Mode SS | |||
|---|---|---|---|
| Quadrant | BADHDUFLAG | Total packets | Discarded packets |
| A | 0 | 132 | 0 |
| B | 0 | 132 | 0 |
| C | 0 | 132 | 0 |
| D | 0 | 132 | 0 |
| Mode M9 | |||
|---|---|---|---|
| Quadrant | BADHDUFLAG | Total packets | Discarded packets |
| A | 0 | 11 | 0 |
| B | 0 | 11 | 0 |
| C | 0 | 11 | 0 |
| D | 0 | 11 | 0 |
| Mode M0 | |||
|---|---|---|---|
| Quadrant | BADHDUFLAG | Total packets | Discarded packets |
| A | 0 | 22689 | 2 |
| B | 0 | 14485 | 2 |
| C | 0 | 13204 | 2 |
| D | 0 | 17536 | 2 |
| Quadrant | Total seconds | Saturated seconds | Saturation percentage |
|---|---|---|---|
| A | 6447 | 259 | 4.017372% |
| B | 6448 | 119 | 1.845533% |
| C | 6448 | 22 | 0.341191% |
| D | 6448 | 427 | 6.622208% |
Noise dominated data is calculated using 1-second bins in cleaned event files. If a bin has >2000 counts, and if more than 50% of those come from <1% of pixels, then it is considered to be noise-dominated and hence unusable.
| Quadrant | # 1 sec bins | Bins with >0 counts | Bins with >2000 counts | High rate bins dominated by noise | Noise dominated (total time) | Noise dominated (detector-on time) | Marked lightcurve |
|---|---|---|---|---|---|---|---|
| A | 7592 | 6448 | 107 | 107 | 1.41% | 1.66% | 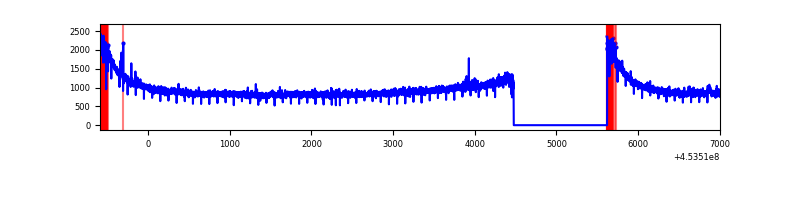 |
| B | 7593 | 6449 | 7 | 7 | 0.09% | 0.11% | 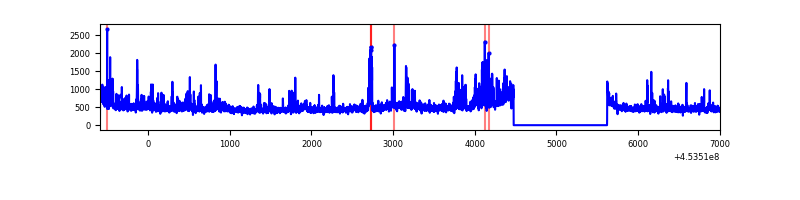 |
| C | 7593 | 6449 | 0 | 0 | 0.00% | 0.00% | 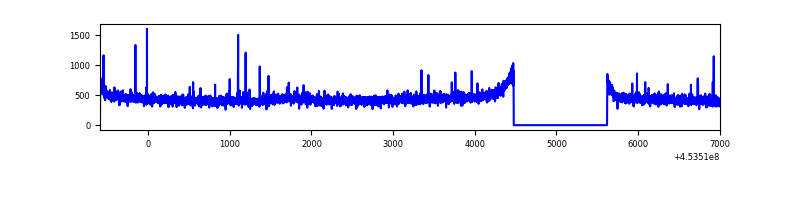 |
| D | 7593 | 6449 | 318 | 318 | 4.19% | 4.93% | 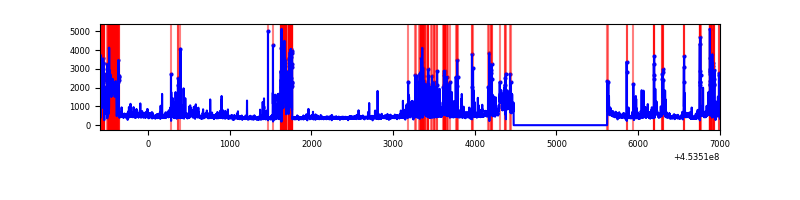 |
Top three noisy pixels from each quadrant. If the there are fewer than three noisy pixels in the level2.evt file, extra rows are filled as -1
| Pixel properties | Quadrant properties | ||||||
|---|---|---|---|---|---|---|---|
| Quadrant | DetID | PixID | Counts | Sigma | Mean | Median | Sigma |
| A | 10 | 83 | 3417720 | 23029.43 | 715 | 700 | 148.4 |
| A | 9 | 191 | 18445 | 119.59 | 715 | 700 | 148.4 |
| A | 0 | 243 | 16698 | 107.82 | 715 | 700 | 148.4 |
| B | 0 | 189 | 278044 | 1940.94 | 728 | 705 | 142.9 |
| B | 4 | 171 | 93960 | 652.64 | 728 | 705 | 142.9 |
| B | 0 | 198 | 44271 | 304.89 | 728 | 705 | 142.9 |
| C | 9 | 54 | 37757 | 218.72 | 716 | 719 | 169.3 |
| C | 14 | 254 | 17094 | 96.7 | 716 | 719 | 169.3 |
| C | 1 | 3 | 8905 | 48.34 | 716 | 719 | 169.3 |
| D | 1 | 52 | 436291 | 2548.01 | 681 | 662 | 171.0 |
| D | 5 | 171 | 396627 | 2316.01 | 681 | 662 | 171.0 |
| D | 12 | 238 | 297835 | 1738.18 | 681 | 662 | 171.0 |
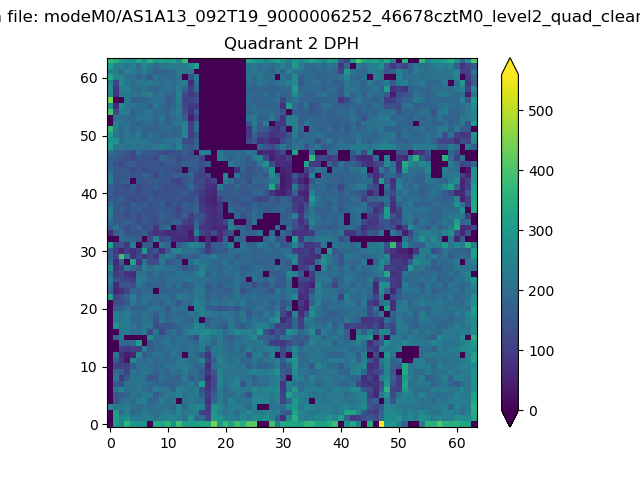
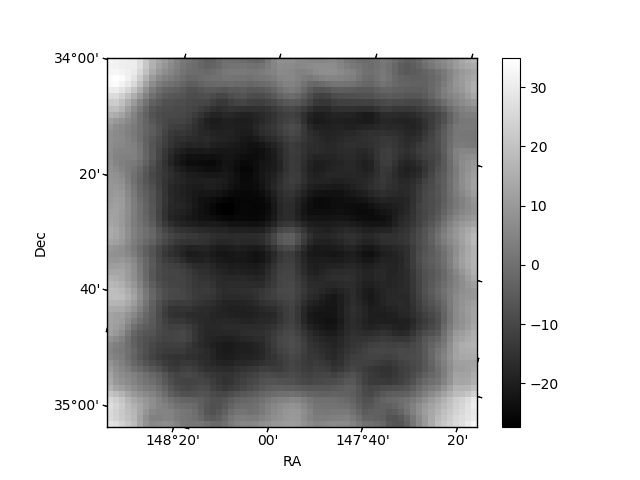
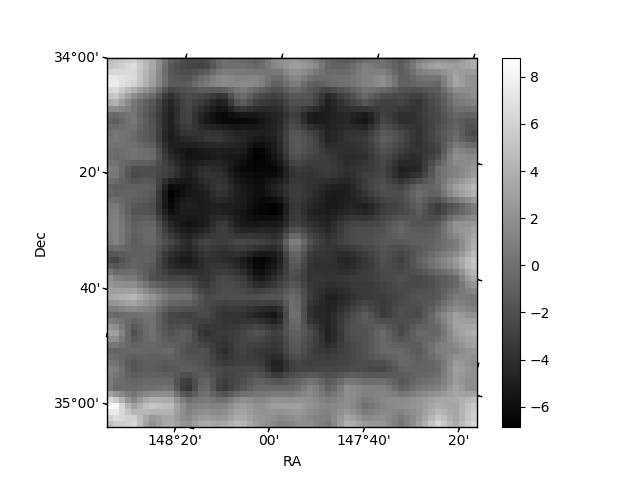
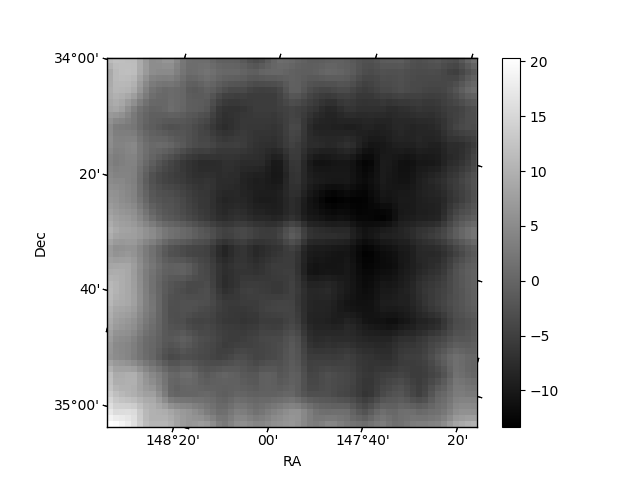
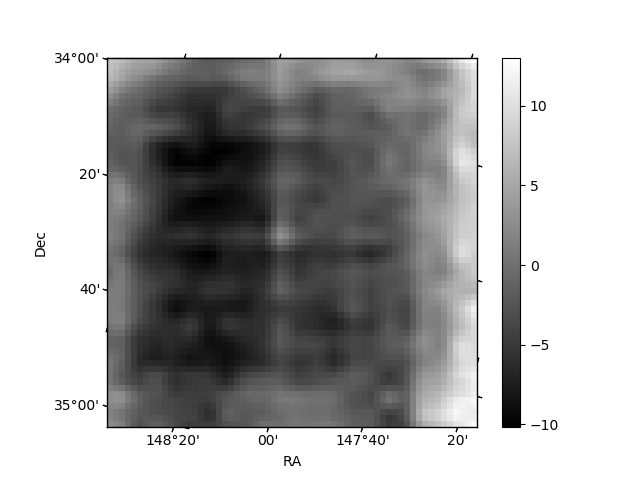
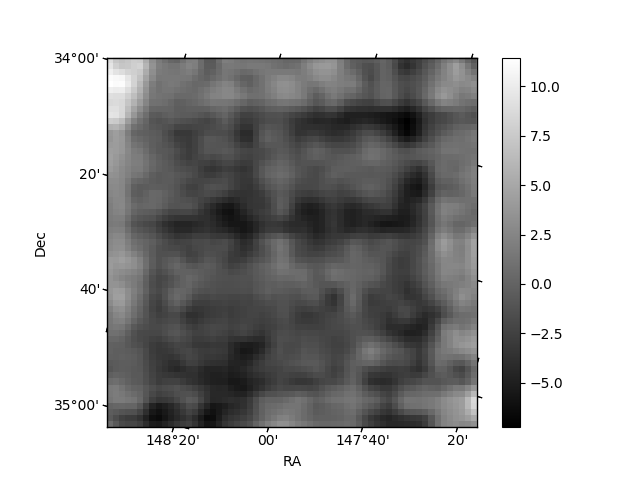
Histogram calculated using DETX and DETY for each event in the final _common_clean file
| Quadrant A | 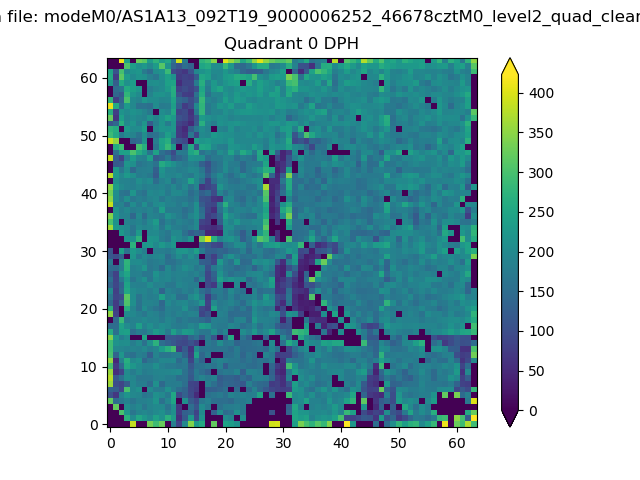 |
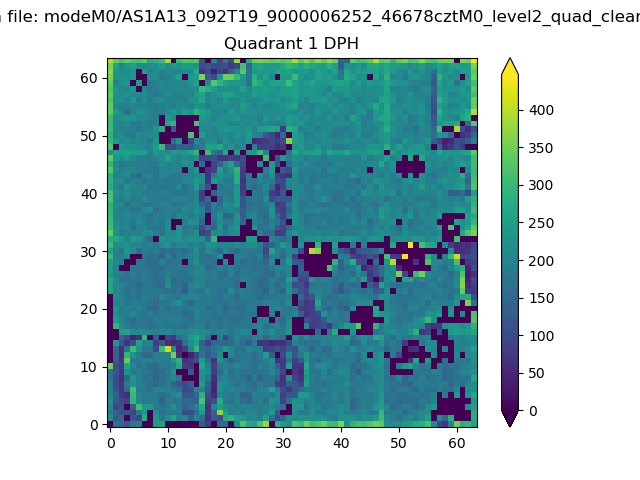 |
Quadrant B |
|---|---|---|---|
| Quadrant D | 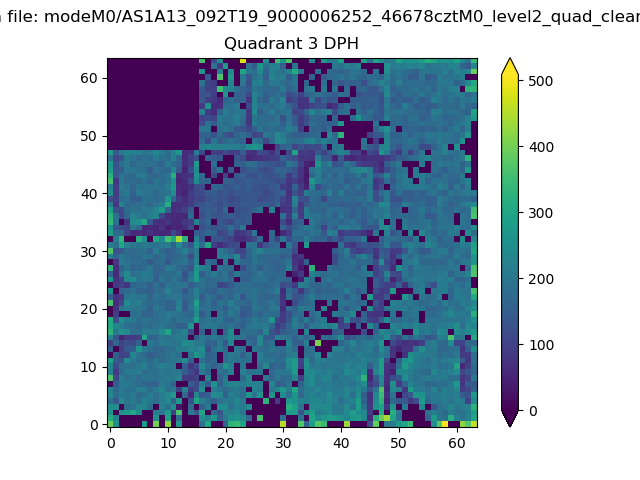 |
 |
Quadrant C |
| Plot type | Count rate plots | Images |
|---|---|---|
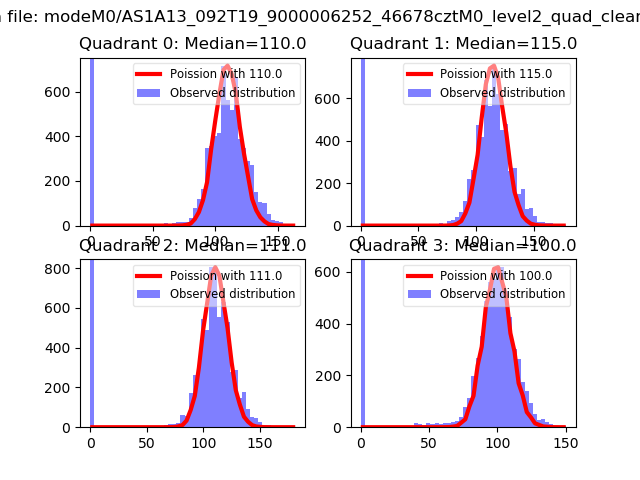
| Comparison with Poisson distribution Blue bars denote a histogram of data divided into 1 sec bins. Red curve is a Poisson curve with rate = median count rate of data. |
 |
 |
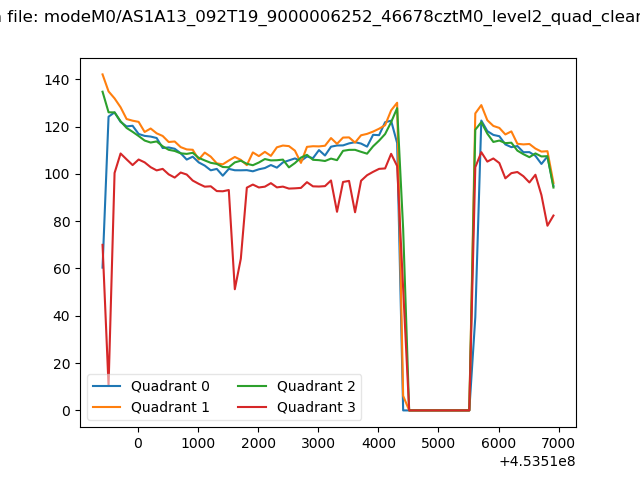
| Quadrant-wise count rates Data is divided into 100 sec bins |
 |
|
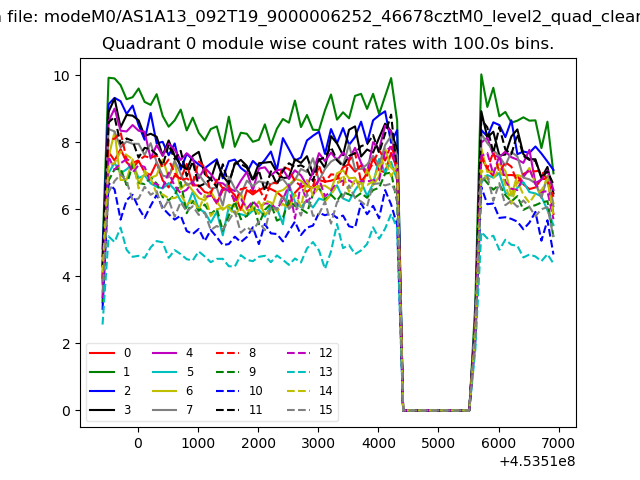
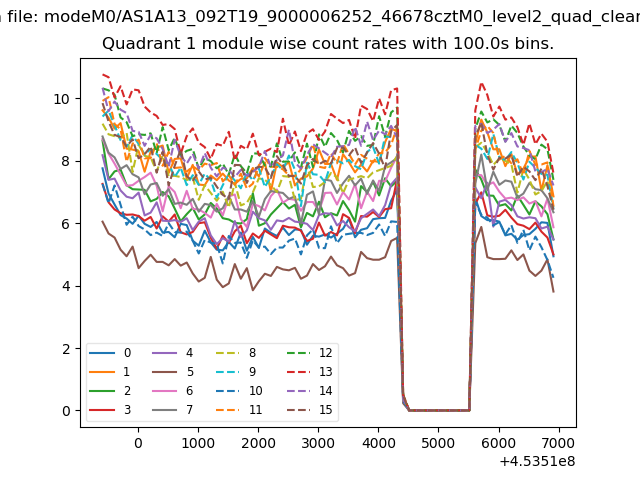
| Module-wise count rates for Quadrant A Data is divided into 100 sec bins |
 |
 |
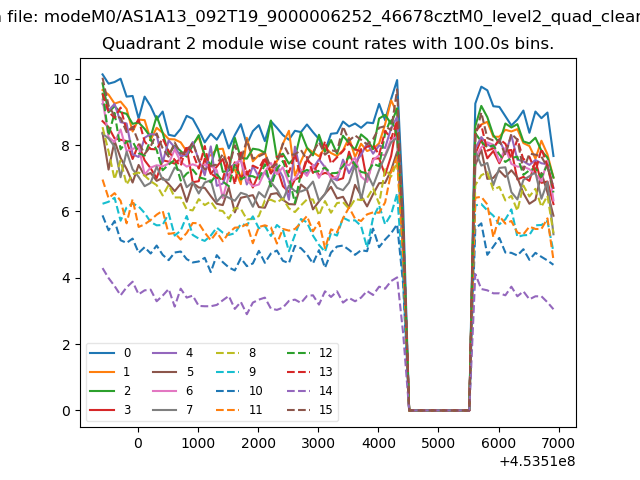
| Module-wise count rates for Quadrant B Data is divided into 100 sec bins |
 |
 |
| Module-wise count rates for Quadrant C Data is divided into 100 sec bins |
 |
 |
| Module-wise count rates for Quadrant D Data is divided into 100 sec bins |
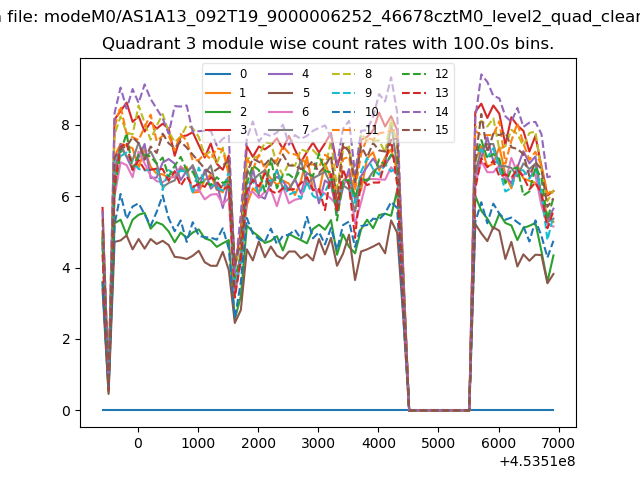 |
 |
| Parameter | Plot |
|---|---|
| CZT HV Monitor | 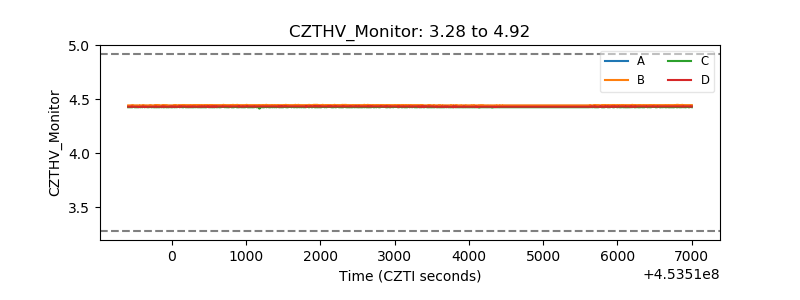 |
| D_VDD | 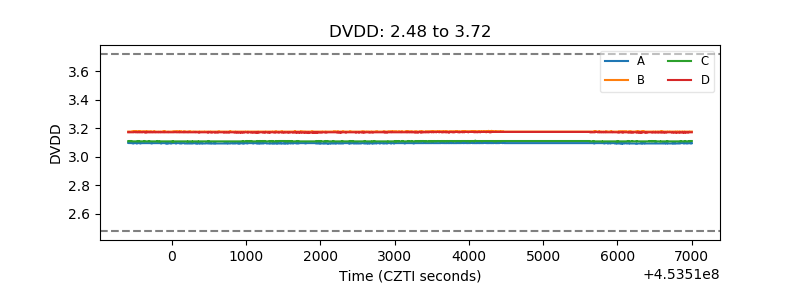 |
| Temperature 1 | 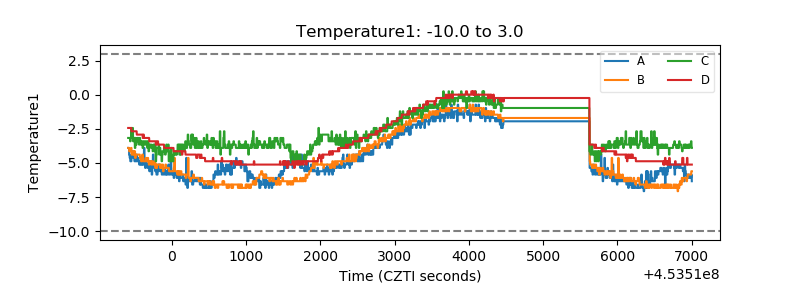 |
| Veto HV Monitor | 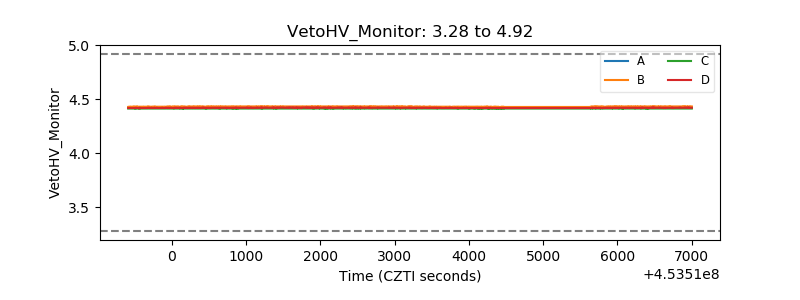 |
| Veto LLD | 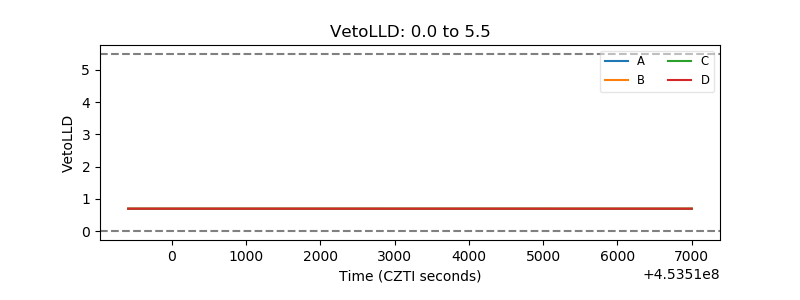 |
| Alpha Counter | 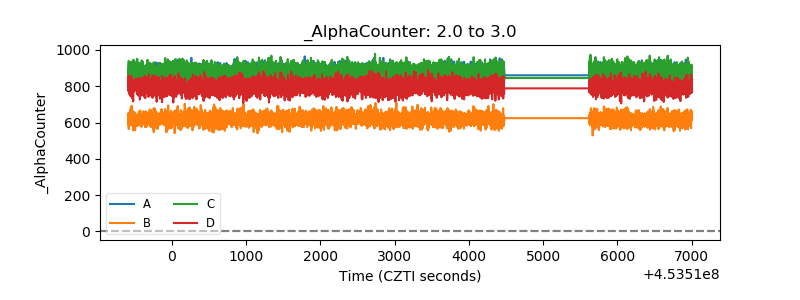 |
| _CPM_Rate | 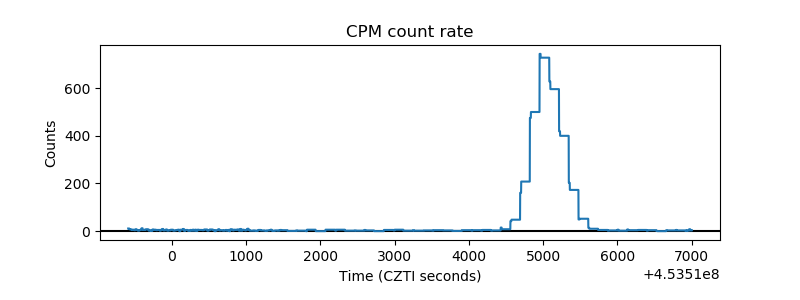 |
| CZT Counter | 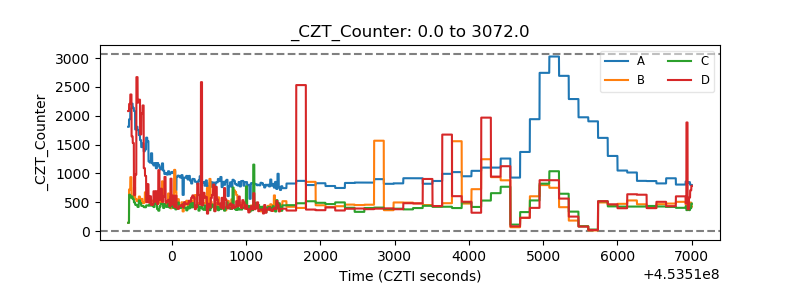 |
| +2.5 Volts monitor | 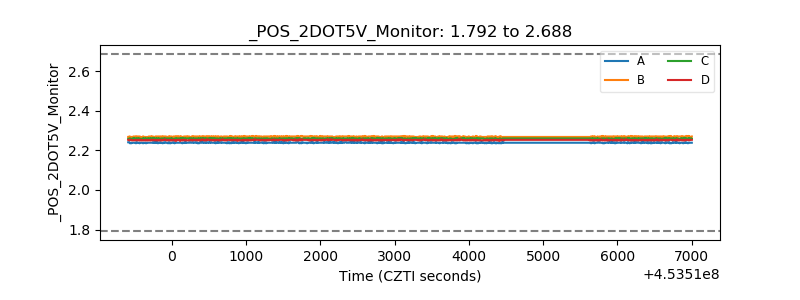 |
| +5 Volts monitor |  |
| _ROLL_ROT | 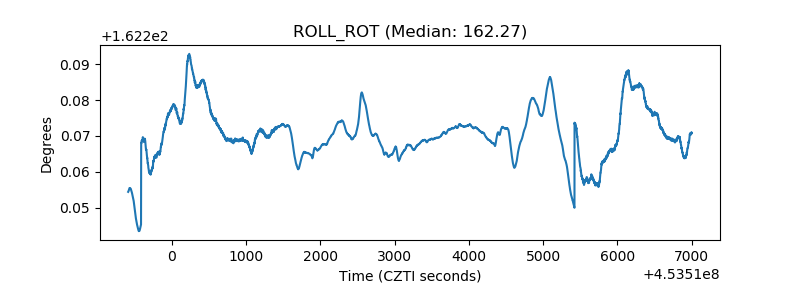 |
| _Roll_DEC | 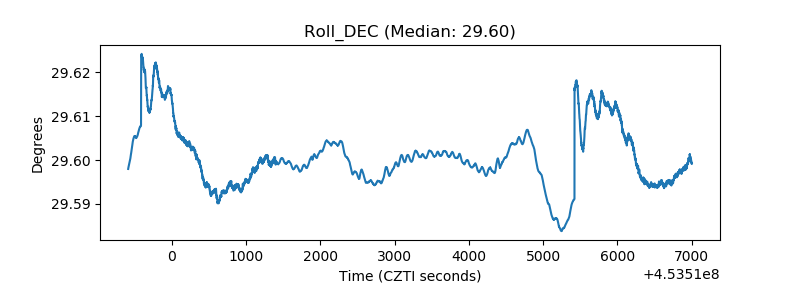 |
| _Roll_RA | 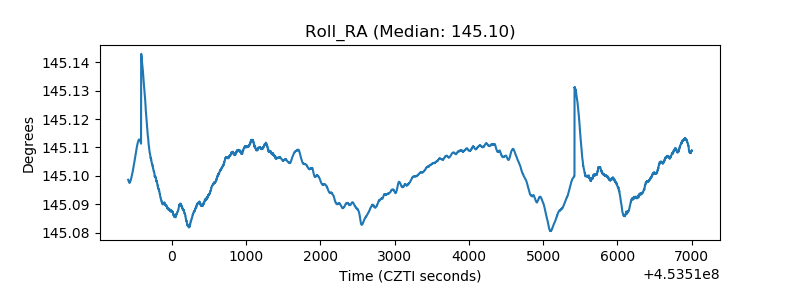 |
| Veto Counter | 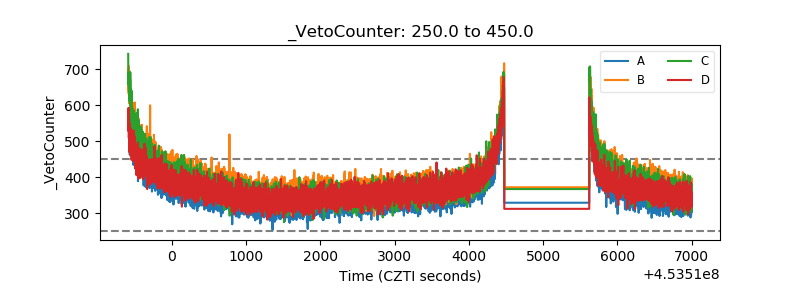 |