| Param | Original file | Final file |
|---|---|---|
| Filename | modeM0/AS1A13_092T09_9000006258_46731cztM0_level2.fits | modeM0/AS1A13_092T09_9000006258_46731cztM0_level2_quad_clean.evt |
| Size (bytes) | 489,813,120 | 99,443,520 |
| Size | 467.1 MB | 94.8 MB |
| Events in quadrant A | 6,512,682 | 650,248 |
| Events in quadrant B | 3,424,979 | 677,942 |
| Events in quadrant C | 2,783,518 | 658,675 |
| Events in quadrant D | 4,923,790 | 586,109 |
| Mode M0 | |||
|---|---|---|---|
| Quadrant | BADHDUFLAG | Total packets | Discarded packets |
| A | 0 | 23595 | 1 |
| B | 0 | 14639 | 2 |
| C | 0 | 13073 | 1 |
| D | 0 | 18981 | 1 |
| Mode M9 | |||
|---|---|---|---|
| Quadrant | BADHDUFLAG | Total packets | Discarded packets |
| A | 0 | 10 | 0 |
| B | 0 | 10 | 0 |
| C | 0 | 10 | 0 |
| D | 0 | 10 | 0 |
| Mode SS | |||
|---|---|---|---|
| Quadrant | BADHDUFLAG | Total packets | Discarded packets |
| A | 0 | 128 | 0 |
| B | 0 | 128 | 0 |
| C | 0 | 128 | 0 |
| D | 0 | 128 | 0 |
| Quadrant | Total seconds | Saturated seconds | Saturation percentage |
|---|---|---|---|
| A | 6270 | 295 | 4.704944% |
| B | 6269 | 138 | 2.201308% |
| C | 6270 | 22 | 0.350877% |
| D | 6270 | 399 | 6.363636% |
Noise dominated data is calculated using 1-second bins in cleaned event files. If a bin has >2000 counts, and if more than 50% of those come from <1% of pixels, then it is considered to be noise-dominated and hence unusable.
| Quadrant | # 1 sec bins | Bins with >0 counts | Bins with >2000 counts | High rate bins dominated by noise | Noise dominated (total time) | Noise dominated (detector-on time) | Marked lightcurve |
|---|---|---|---|---|---|---|---|
| A | 7270 | 6270 | 153 | 153 | 2.10% | 2.44% | 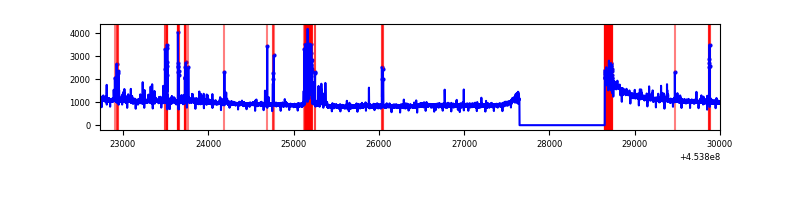 |
| B | 7270 | 6270 | 65 | 65 | 0.89% | 1.04% | 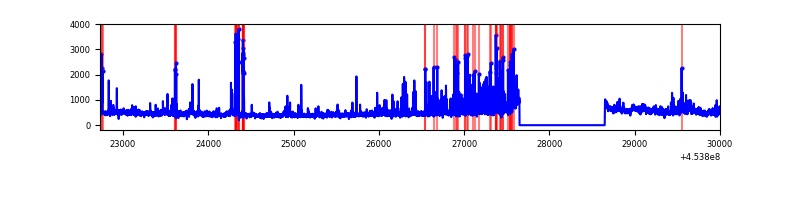 |
| C | 7270 | 6271 | 3 | 3 | 0.04% | 0.05% | 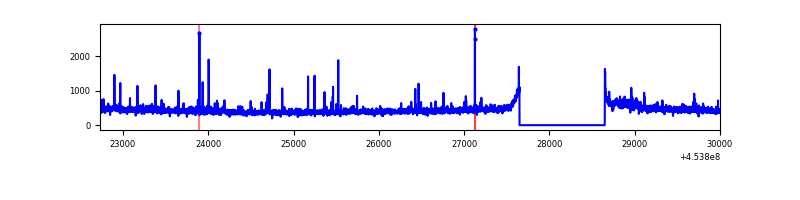 |
| D | 7270 | 6271 | 369 | 369 | 5.08% | 5.88% | 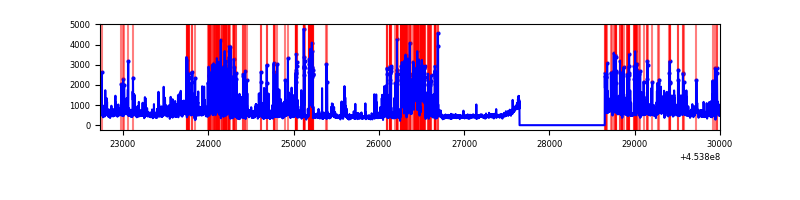 |
Top three noisy pixels from each quadrant. If the there are fewer than three noisy pixels in the level2.evt file, extra rows are filled as -1
| Pixel properties | Quadrant properties | ||||||
|---|---|---|---|---|---|---|---|
| Quadrant | DetID | PixID | Counts | Sigma | Mean | Median | Sigma |
| A | 10 | 83 | 3427888 | 24712.84 | 668 | 653 | 138.7 |
| A | 13 | 248 | 265436 | 1909.28 | 668 | 653 | 138.7 |
| A | 9 | 191 | 152976 | 1098.36 | 668 | 653 | 138.7 |
| B | 12 | 16 | 317340 | 2358.25 | 673 | 653 | 134.3 |
| B | 3 | 112 | 97338 | 719.98 | 673 | 653 | 134.3 |
| B | 4 | 171 | 92029 | 680.44 | 673 | 653 | 134.3 |
| C | 3 | 233 | 93359 | 580.71 | 670 | 674 | 159.6 |
| C | 14 | 254 | 53128 | 328.65 | 670 | 674 | 159.6 |
| C | 12 | 250 | 13251 | 78.8 | 670 | 674 | 159.6 |
| D | 1 | 52 | 1786637 | 10641.4 | 658 | 638 | 167.8 |
| D | 5 | 171 | 192500 | 1143.16 | 658 | 638 | 167.8 |
| D | 12 | 128 | 163033 | 967.59 | 658 | 638 | 167.8 |
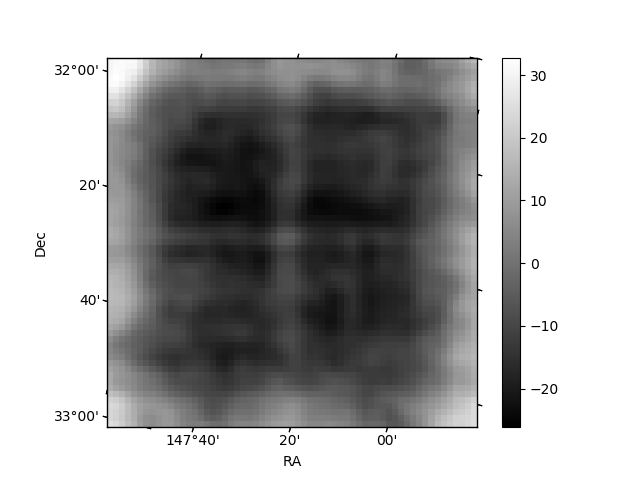
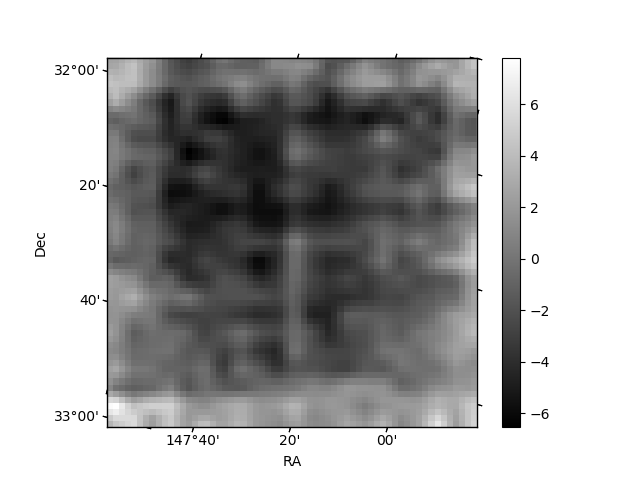
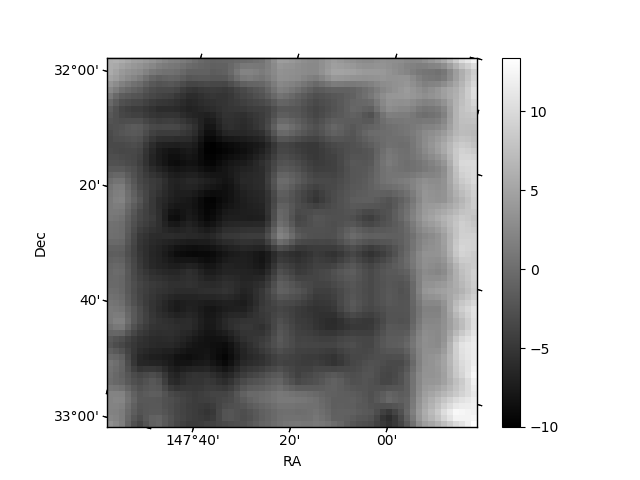
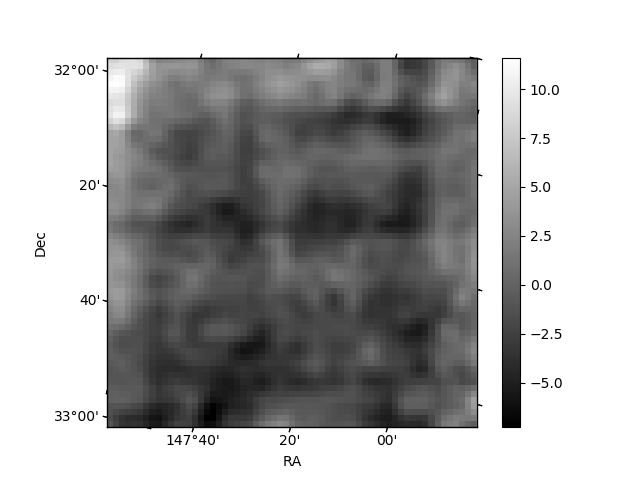
Histogram calculated using DETX and DETY for each event in the final _common_clean file
| Quadrant A | 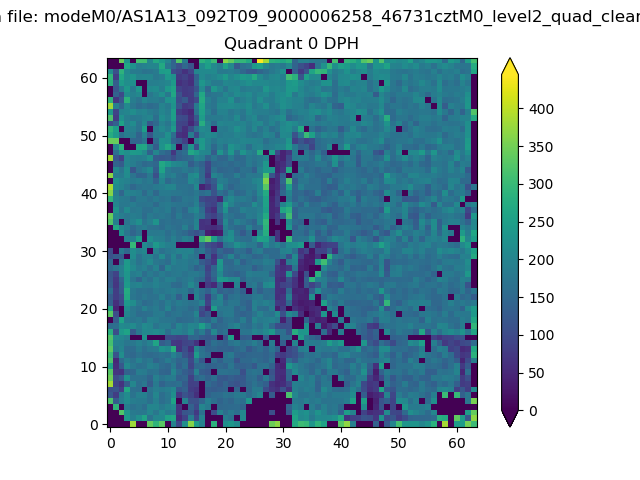 |
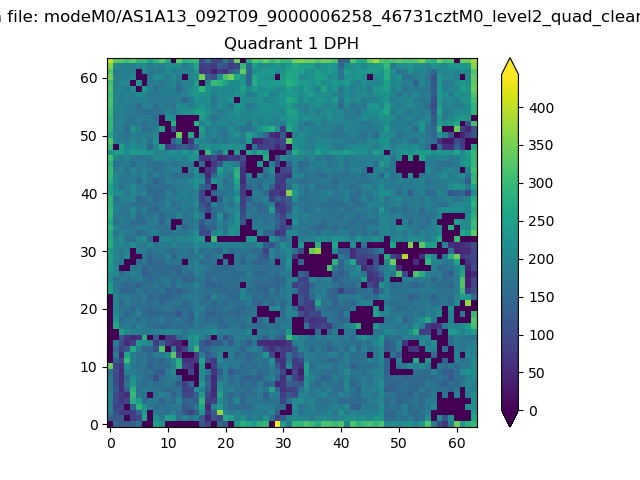 |
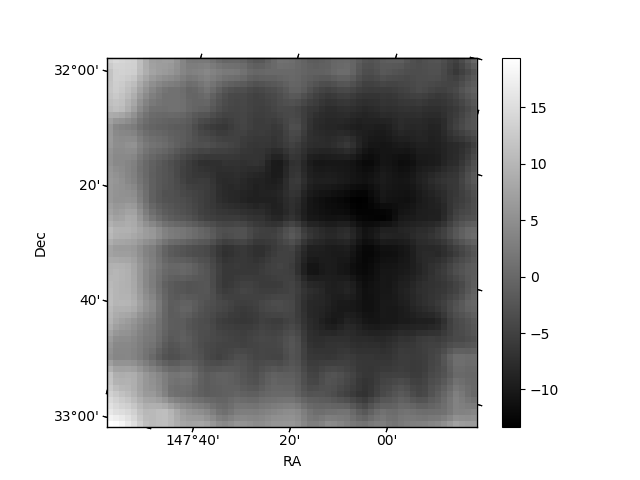
Quadrant B |
|---|---|---|---|
| Quadrant D | 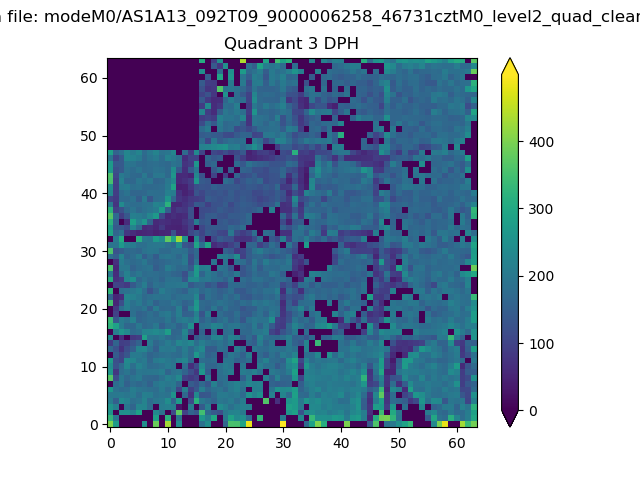 |
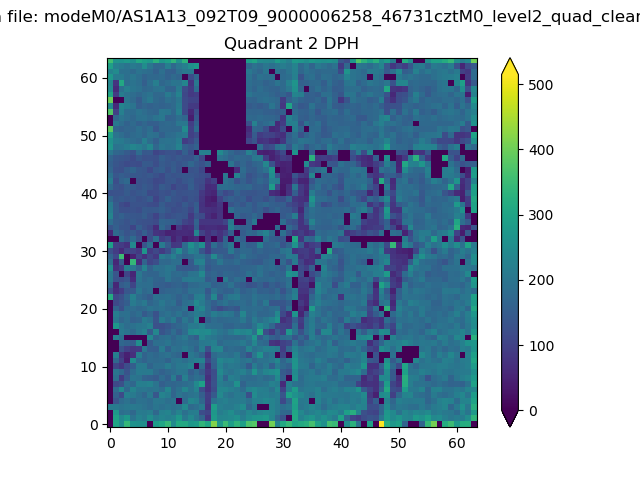 |
Quadrant C |
| Plot type | Count rate plots | Images |
|---|---|---|
| Comparison with Poisson distribution Blue bars denote a histogram of data divided into 1 sec bins. Red curve is a Poisson curve with rate = median count rate of data. |
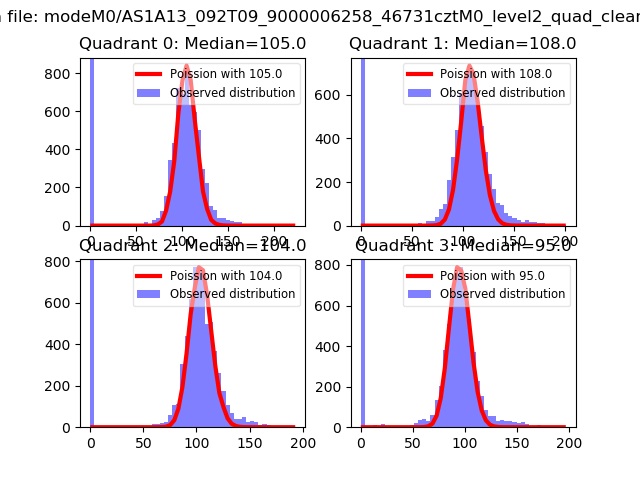 |
 |
| Quadrant-wise count rates Data is divided into 100 sec bins |
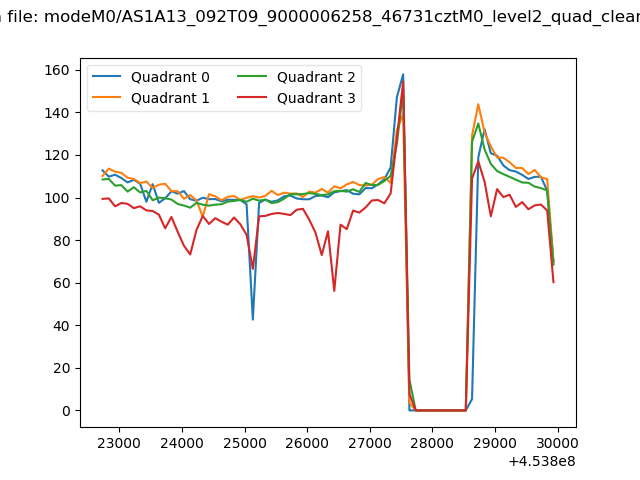 |
|
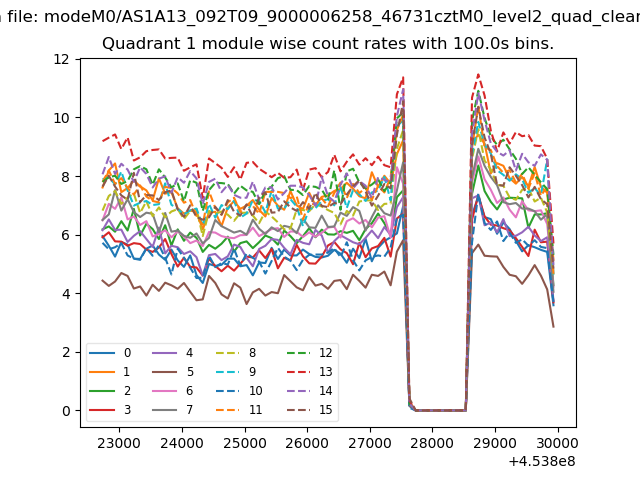
| Module-wise count rates for Quadrant A Data is divided into 100 sec bins |
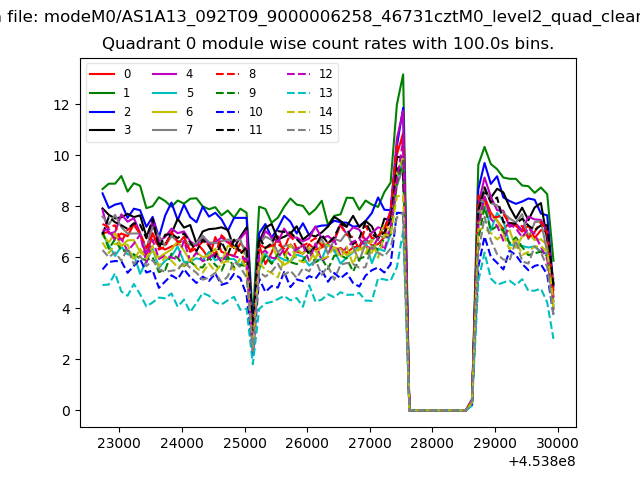 |
 |
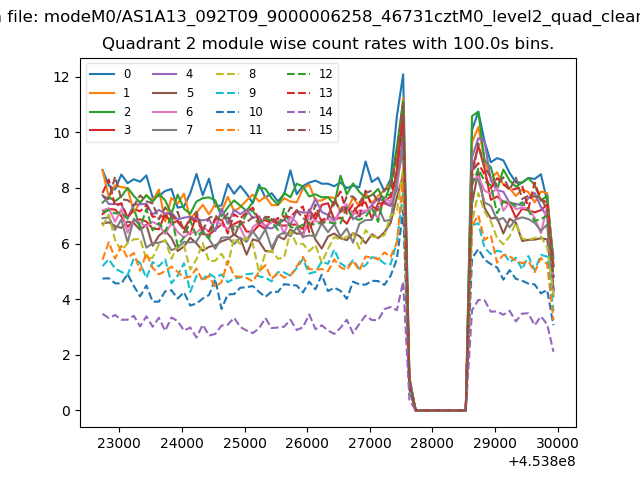
| Module-wise count rates for Quadrant B Data is divided into 100 sec bins |
 |
 |
| Module-wise count rates for Quadrant C Data is divided into 100 sec bins |
 |
 |
| Module-wise count rates for Quadrant D Data is divided into 100 sec bins |
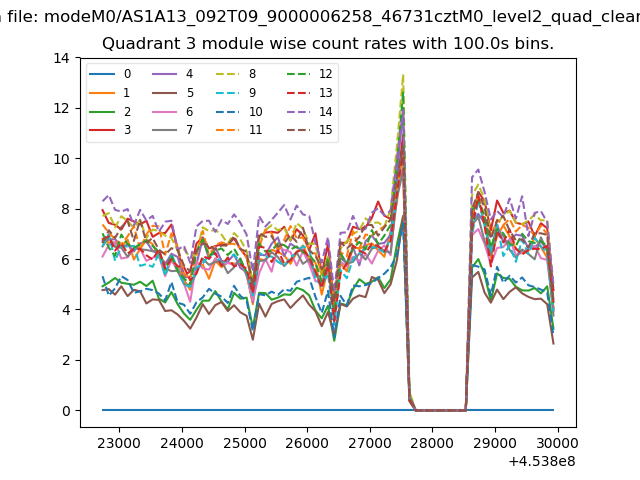 |
 |
| Parameter | Plot |
|---|---|
| CZT HV Monitor | 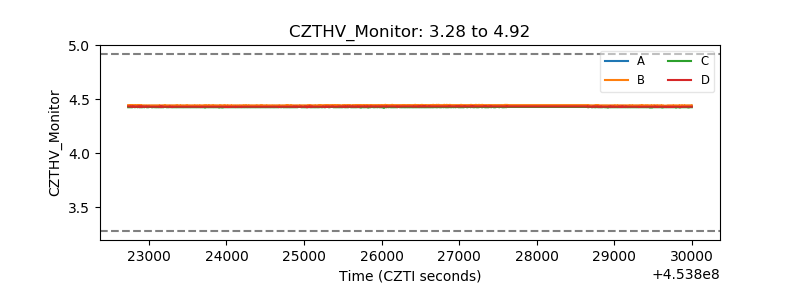 |
| D_VDD | 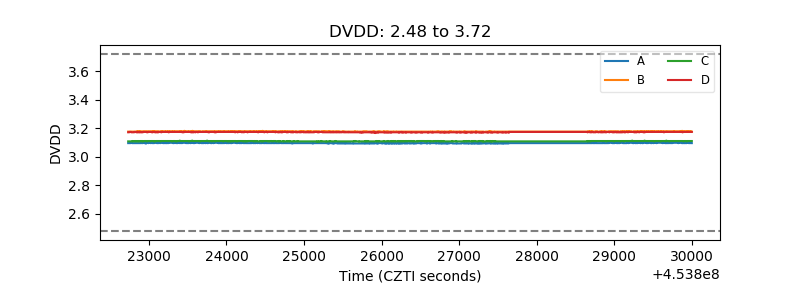 |
| Temperature 1 | 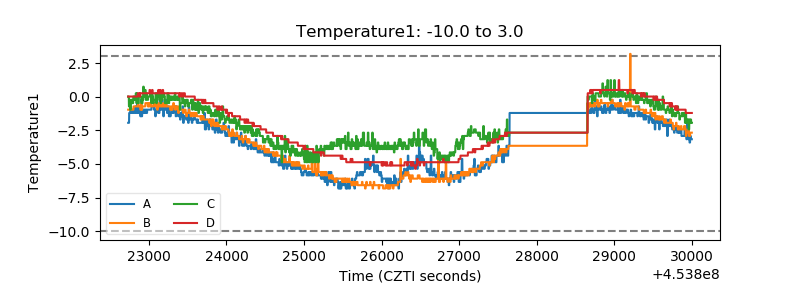 |
| Veto HV Monitor | 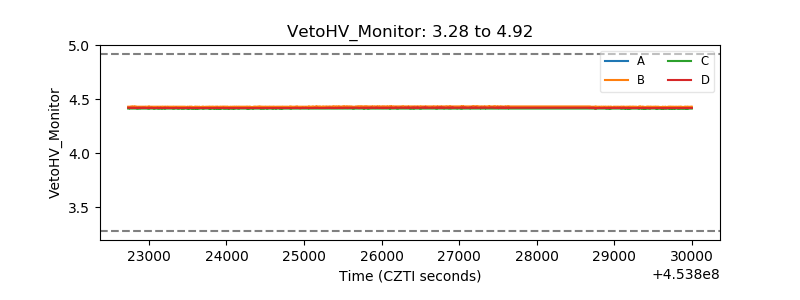 |
| Veto LLD | 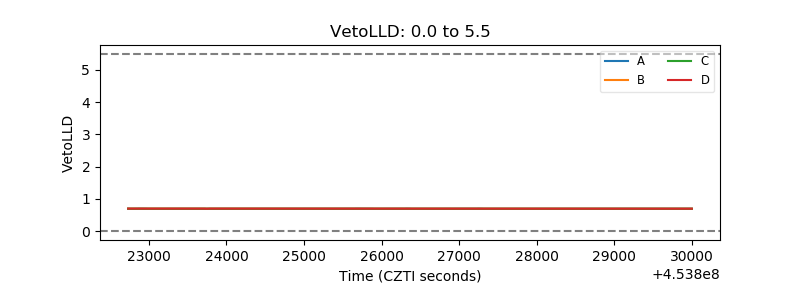 |
| Alpha Counter | 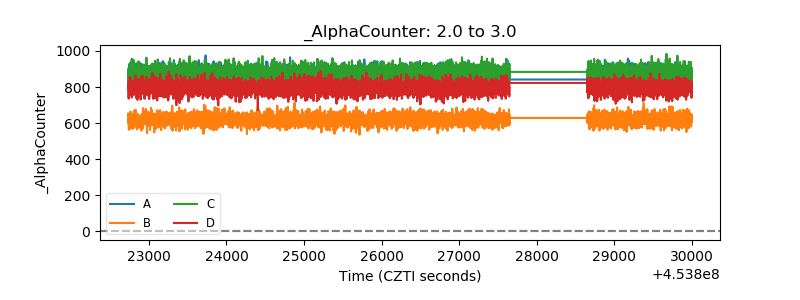 |
| _CPM_Rate | 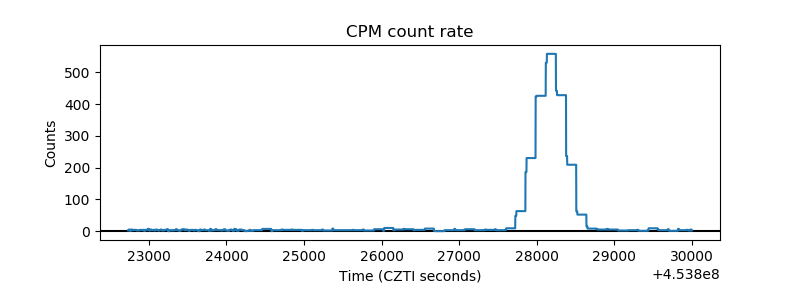 |
| CZT Counter | 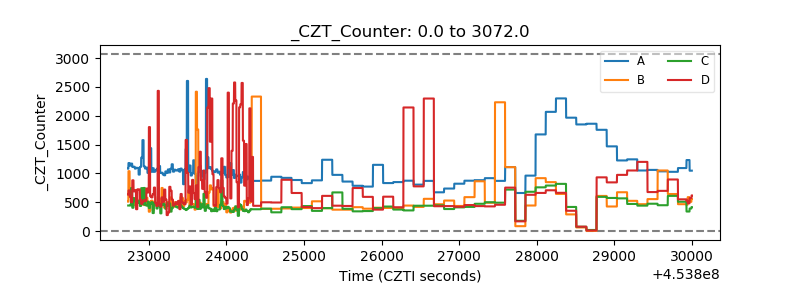 |
| +2.5 Volts monitor | 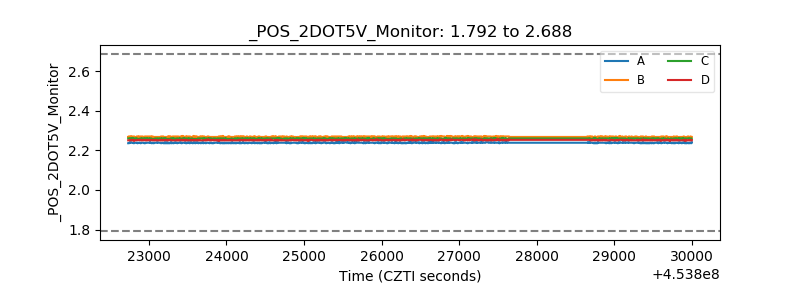 |
| +5 Volts monitor | 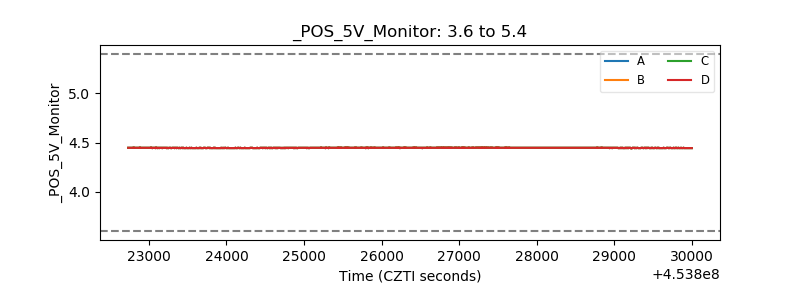 |
| _ROLL_ROT | 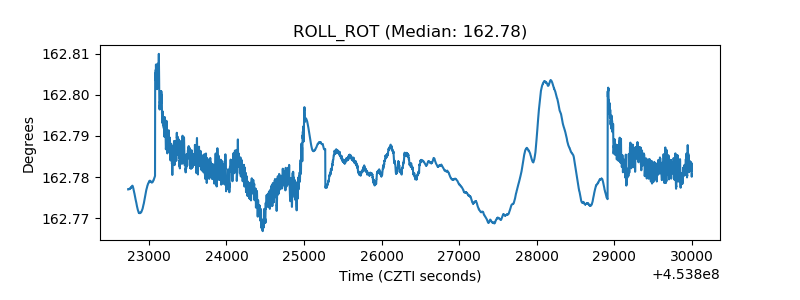 |
| _Roll_DEC | 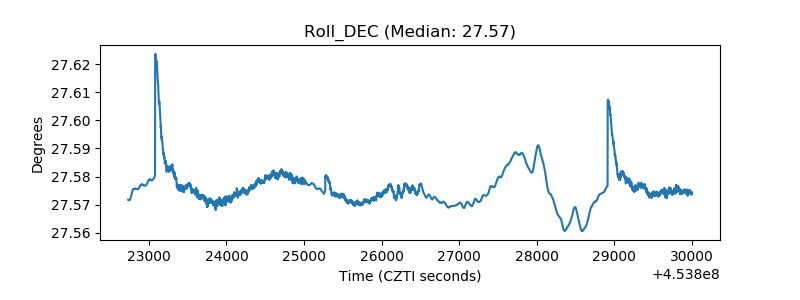 |
| _Roll_RA | 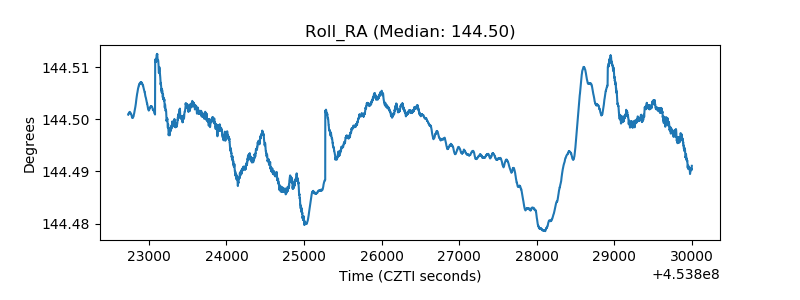 |
| Veto Counter | 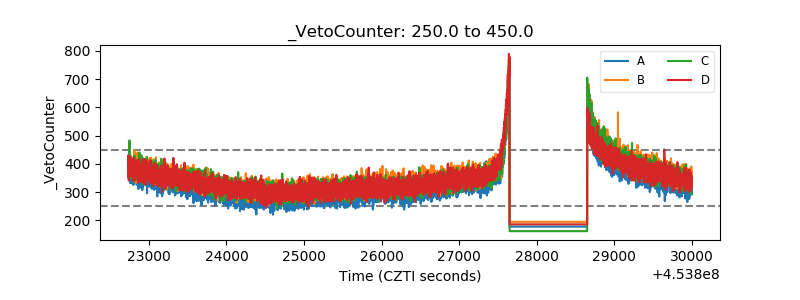 |