| Param | Original file | Final file |
|---|---|---|
| Filename | modeM0/AS1A13_092T17_9000006262_46755cztM0_level2.fits | modeM0/AS1A13_092T17_9000006262_46755cztM0_level2_quad_clean.evt |
| Size (bytes) | 620,755,200 | 125,881,920 |
| Size | 592.0 MB | 120.1 MB |
| Events in quadrant A | 9,236,016 | 815,315 |
| Events in quadrant B | 4,705,910 | 855,940 |
| Events in quadrant C | 3,692,320 | 829,274 |
| Events in quadrant D | 4,720,054 | 750,148 |
| Mode SS | |||
|---|---|---|---|
| Quadrant | BADHDUFLAG | Total packets | Discarded packets |
| A | 0 | 162 | 0 |
| B | 0 | 162 | 0 |
| C | 0 | 162 | 0 |
| D | 0 | 162 | 0 |
| Mode M0 | |||
|---|---|---|---|
| Quadrant | BADHDUFLAG | Total packets | Discarded packets |
| A | 0 | 33073 | 0 |
| B | 0 | 19595 | 0 |
| C | 0 | 16911 | 0 |
| D | 0 | 19600 | 2 |
| Quadrant | Total seconds | Saturated seconds | Saturation percentage |
|---|---|---|---|
| A | 8063 | 405 | 5.022944% |
| B | 8063 | 137 | 1.699119% |
| C | 8064 | 10 | 0.124008% |
| D | 8063 | 137 | 1.699119% |
Noise dominated data is calculated using 1-second bins in cleaned event files. If a bin has >2000 counts, and if more than 50% of those come from <1% of pixels, then it is considered to be noise-dominated and hence unusable.
| Quadrant | # 1 sec bins | Bins with >0 counts | Bins with >2000 counts | High rate bins dominated by noise | Noise dominated (total time) | Noise dominated (detector-on time) | Marked lightcurve |
|---|---|---|---|---|---|---|---|
| A | 8064 | 8064 | 221 | 221 | 2.74% | 2.74% | 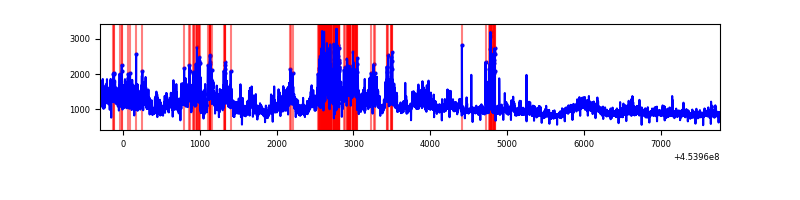 |
| B | 8064 | 8064 | 78 | 78 | 0.97% | 0.97% | 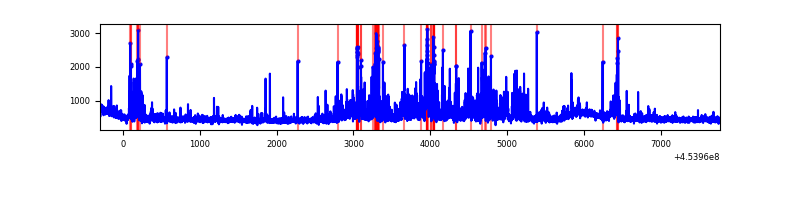 |
| C | 8065 | 8065 | 8 | 8 | 0.10% | 0.10% | 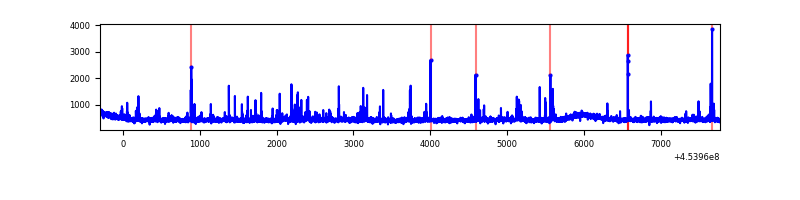 |
| D | 8065 | 8065 | 110 | 110 | 1.36% | 1.36% | 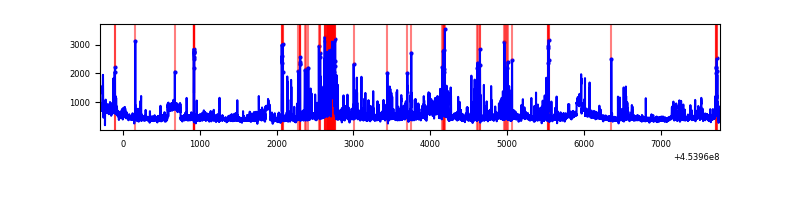 |
Top three noisy pixels from each quadrant. If the there are fewer than three noisy pixels in the level2.evt file, extra rows are filled as -1
| Pixel properties | Quadrant properties | ||||||
|---|---|---|---|---|---|---|---|
| Quadrant | DetID | PixID | Counts | Sigma | Mean | Median | Sigma |
| A | 10 | 83 | 3643795 | 19403.28 | 884 | 862 | 187.7 |
| A | 9 | 191 | 1813231 | 9653.18 | 884 | 862 | 187.7 |
| A | 13 | 248 | 300174 | 1594.22 | 884 | 862 | 187.7 |
| B | 4 | 171 | 456290 | 2564.17 | 891 | 862 | 177.6 |
| B | 15 | 201 | 287829 | 1615.69 | 891 | 862 | 177.6 |
| B | 3 | 112 | 200396 | 1123.42 | 891 | 862 | 177.6 |
| C | 14 | 254 | 140137 | 665.43 | 881 | 886 | 209.3 |
| C | 3 | 233 | 82368 | 389.37 | 881 | 886 | 209.3 |
| C | 9 | 237 | 13696 | 61.21 | 881 | 886 | 209.3 |
| D | 9 | 49 | 371904 | 1678.33 | 871 | 844 | 221.1 |
| D | 13 | 249 | 331844 | 1497.14 | 871 | 844 | 221.1 |
| D | 13 | 138 | 236242 | 1064.72 | 871 | 844 | 221.1 |
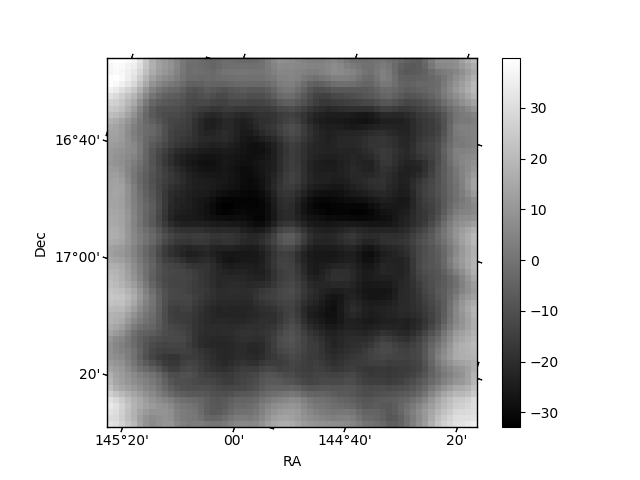
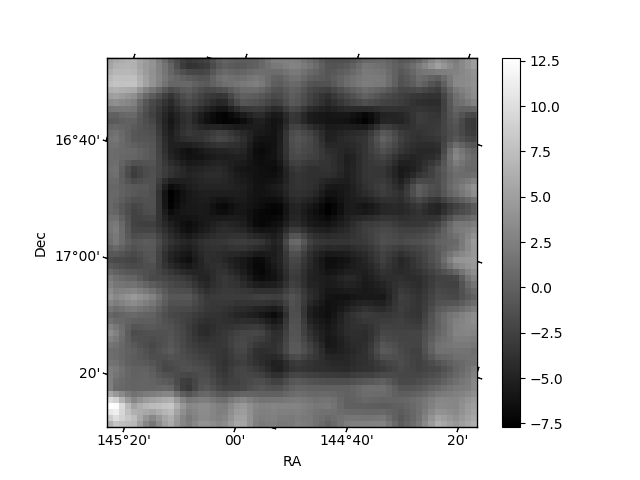
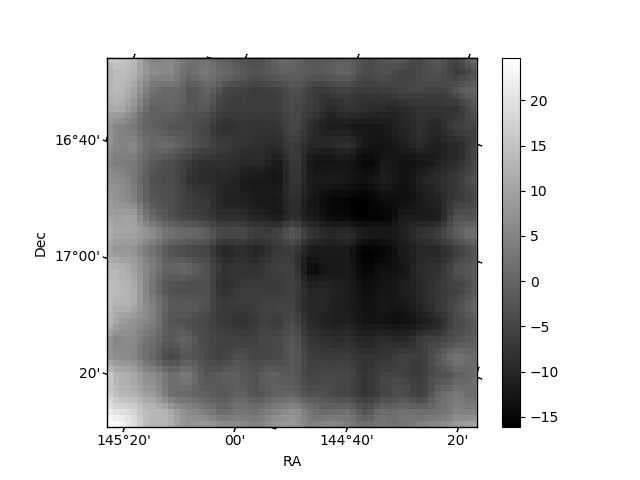
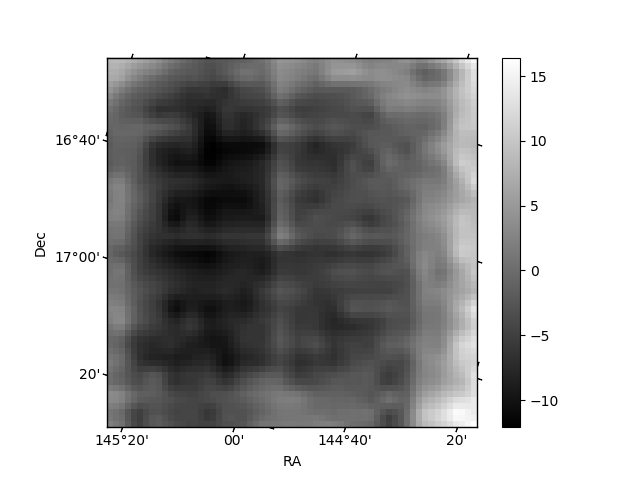
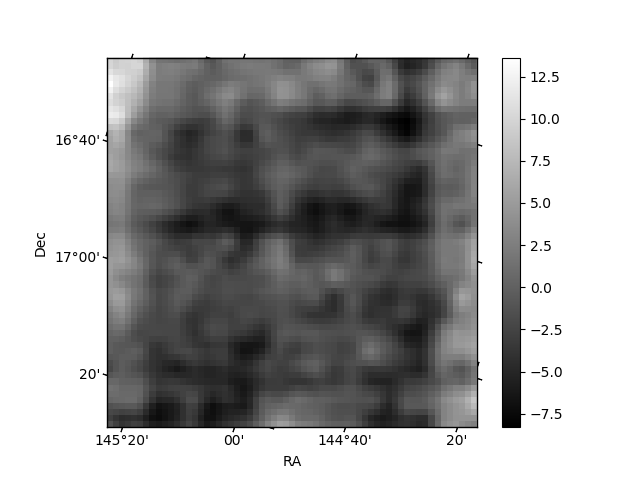
Histogram calculated using DETX and DETY for each event in the final _common_clean file
| Quadrant A | 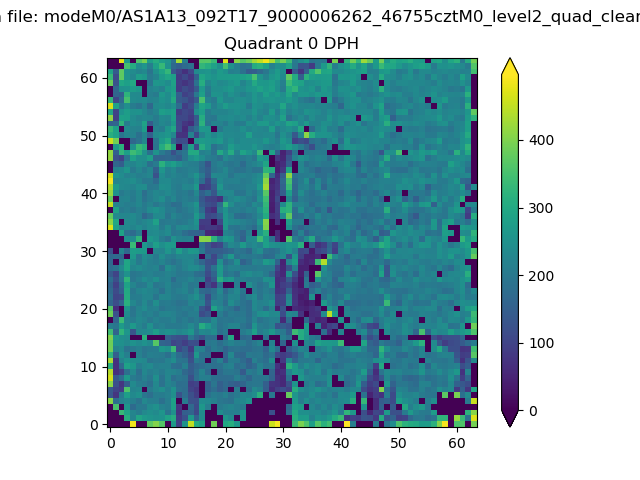 |
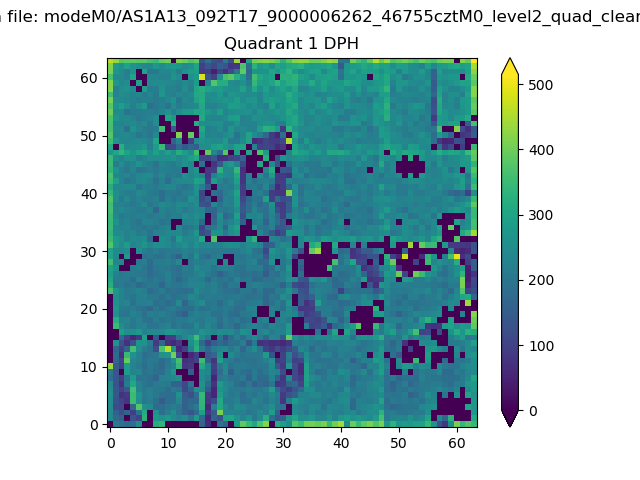 |
Quadrant B |
|---|---|---|---|
| Quadrant D | 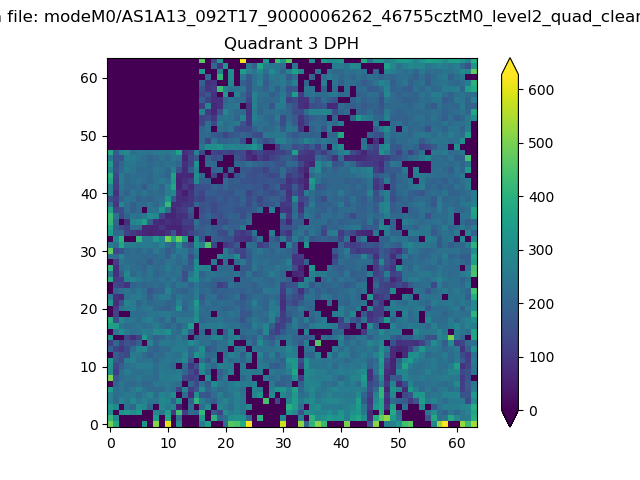 |
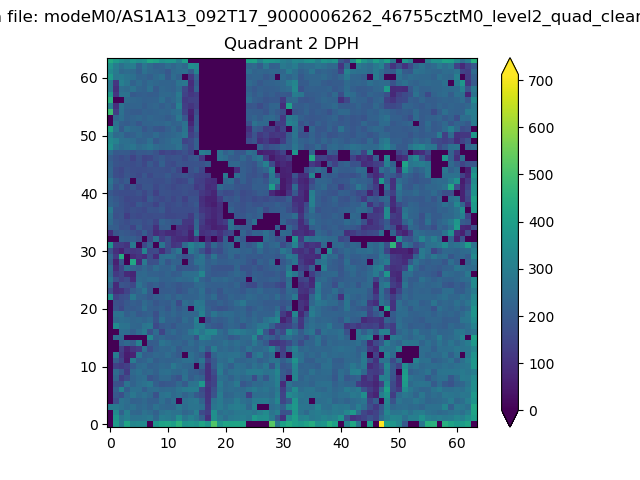 |
Quadrant C |
| Plot type | Count rate plots | Images |
|---|---|---|
| Comparison with Poisson distribution Blue bars denote a histogram of data divided into 1 sec bins. Red curve is a Poisson curve with rate = median count rate of data. |
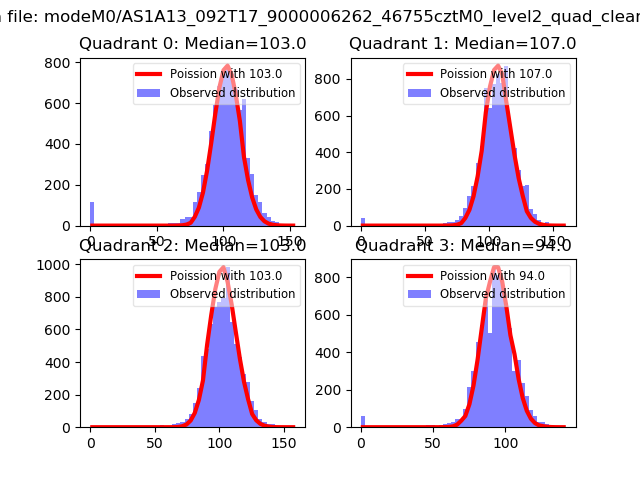 |
 |
| Quadrant-wise count rates Data is divided into 100 sec bins |
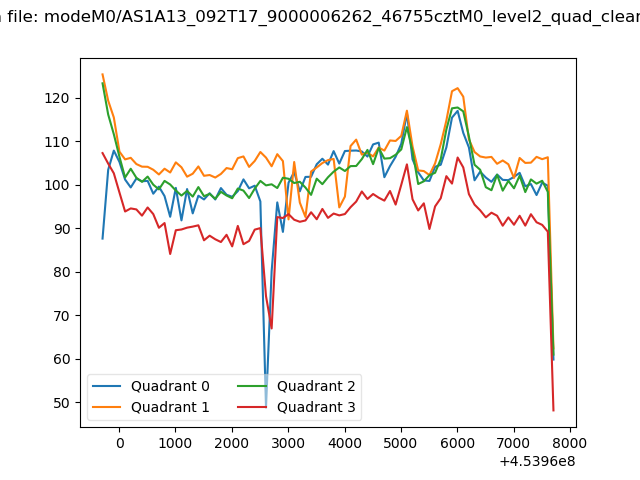 |
|
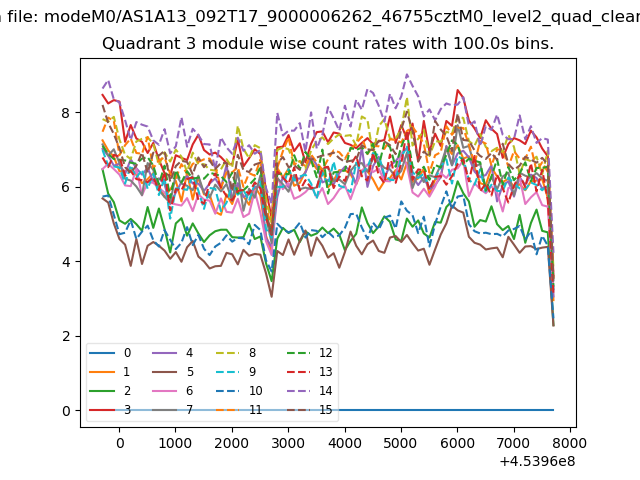
| Module-wise count rates for Quadrant A Data is divided into 100 sec bins |
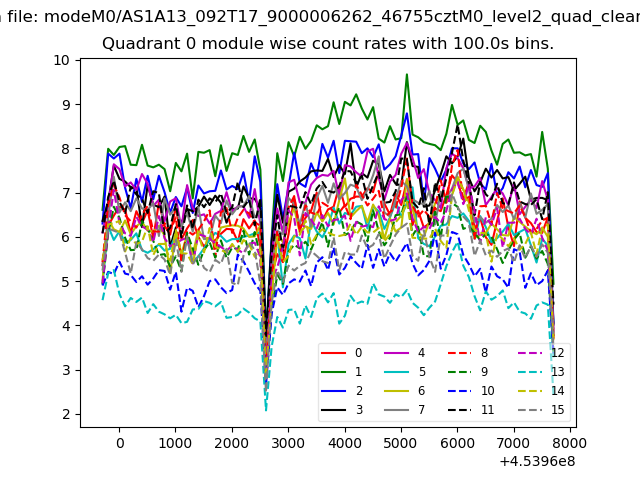 |
 |
| Module-wise count rates for Quadrant B Data is divided into 100 sec bins |
 |
 |
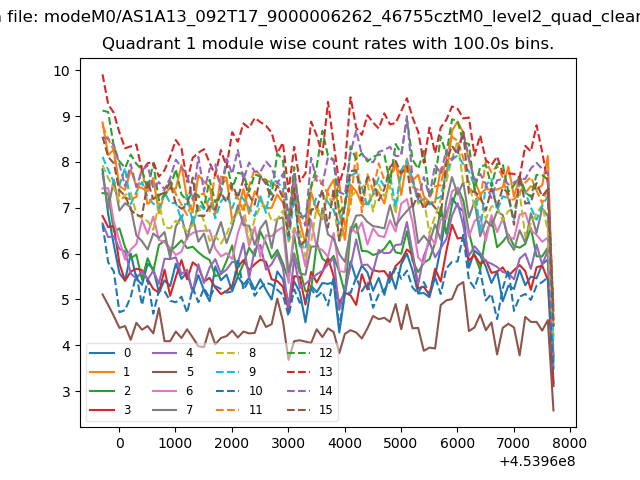
| Module-wise count rates for Quadrant C Data is divided into 100 sec bins |
 |
 |
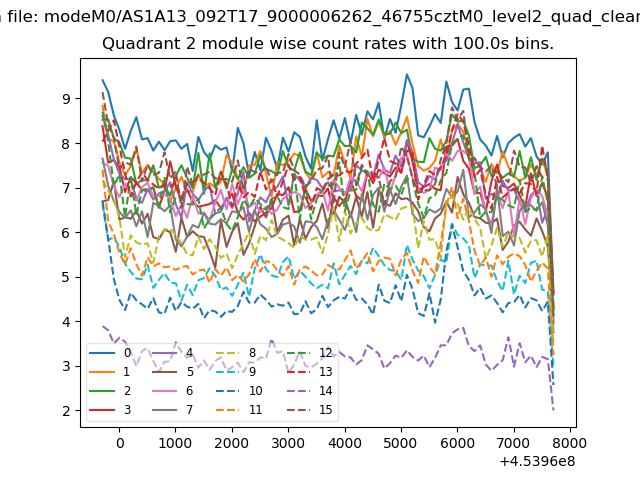
| Module-wise count rates for Quadrant D Data is divided into 100 sec bins |
 |
 |
| Parameter | Plot |
|---|---|
| CZT HV Monitor |  |
| D_VDD | 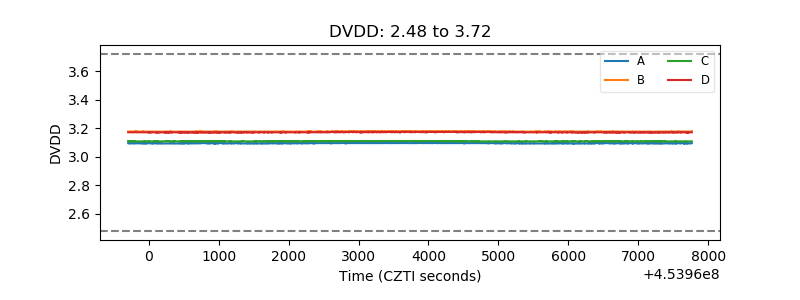 |
| Temperature 1 | 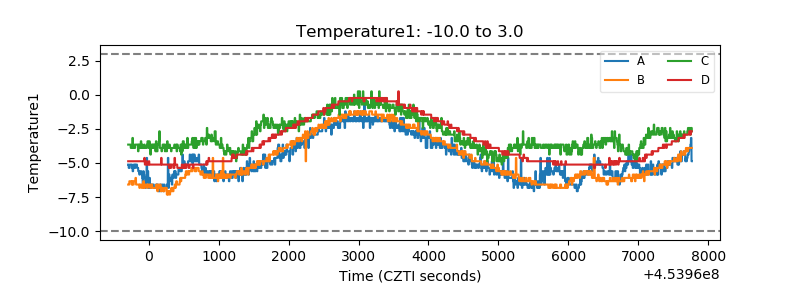 |
| Veto HV Monitor | 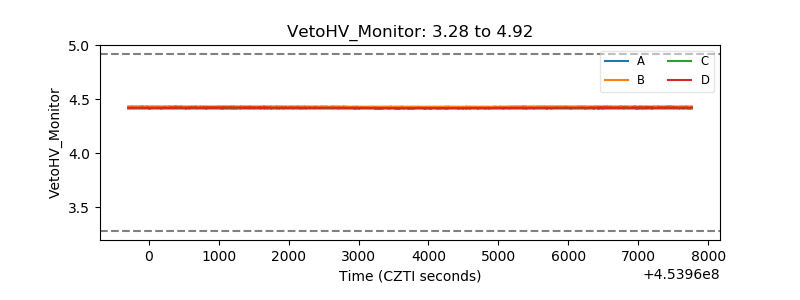 |
| Veto LLD | 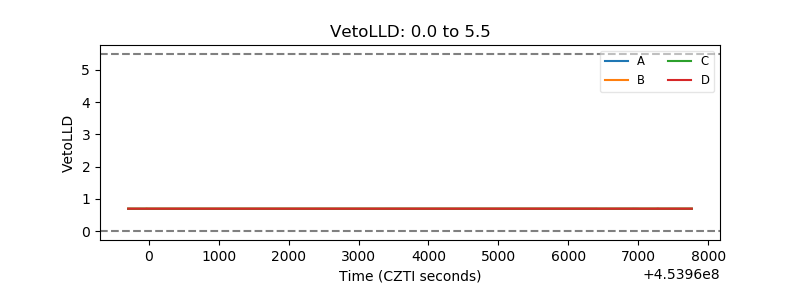 |
| Alpha Counter | 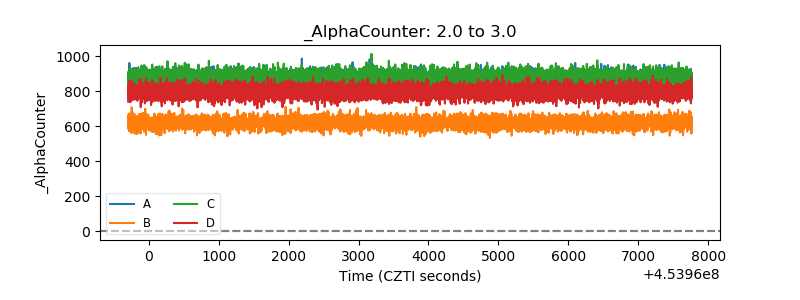 |
| _CPM_Rate | 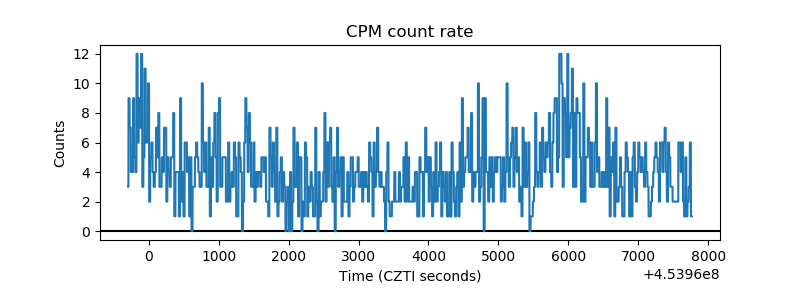 |
| CZT Counter | 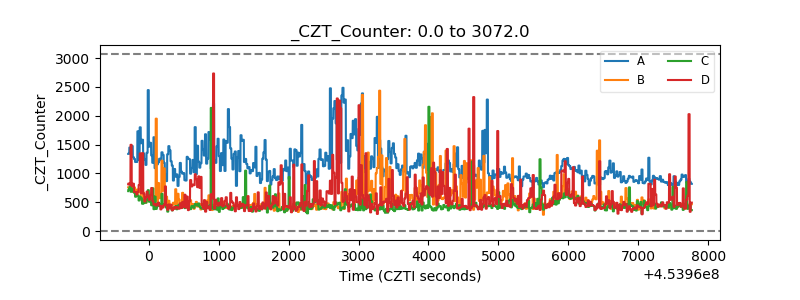 |
| +2.5 Volts monitor | 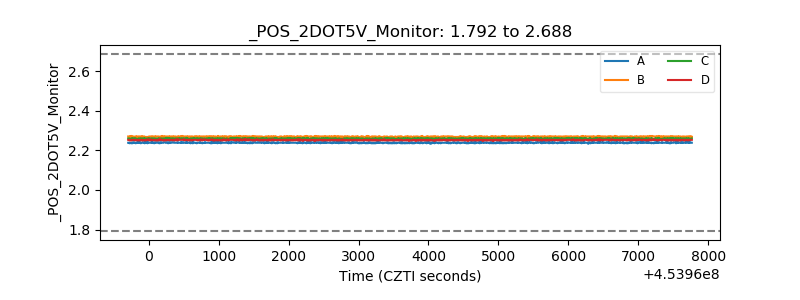 |
| +5 Volts monitor | 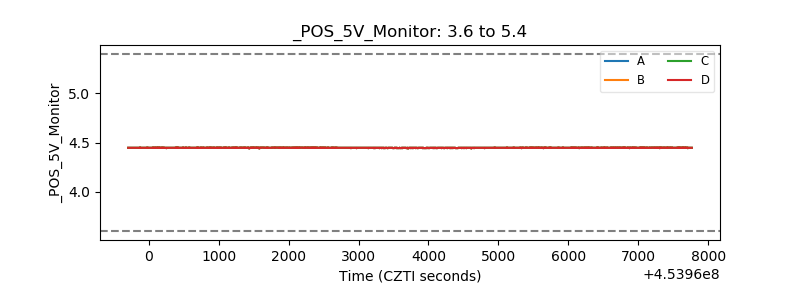 |
| _ROLL_ROT | 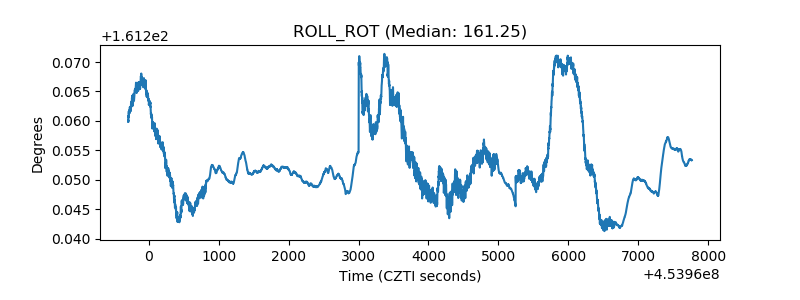 |
| _Roll_DEC | 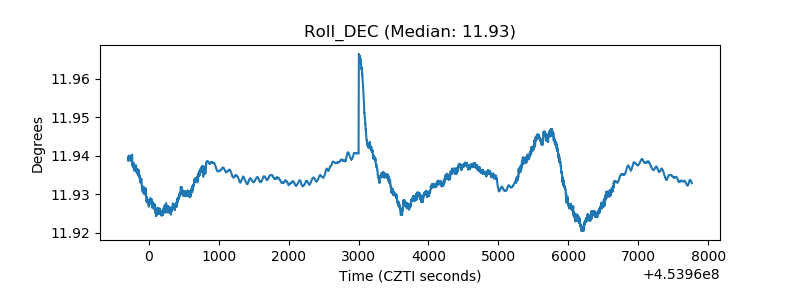 |
| _Roll_RA | 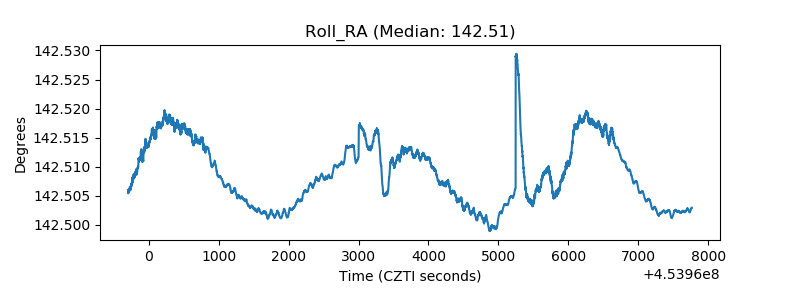 |
| Veto Counter | 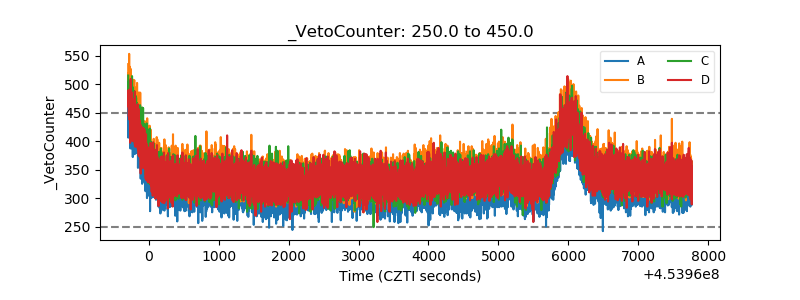 |