| Param | Original file | Final file |
|---|---|---|
| Filename | modeM0/AS1A13_053T01_9000006266_46785cztM0_level2.fits | modeM0/AS1A13_053T01_9000006266_46785cztM0_level2_quad_clean.evt |
| Size (bytes) | 507,709,440 | 114,652,800 |
| Size | 484.2 MB | 109.3 MB |
| Events in quadrant A | 6,710,364 | 759,724 |
| Events in quadrant B | 3,531,040 | 785,544 |
| Events in quadrant C | 3,142,833 | 753,269 |
| Events in quadrant D | 4,844,062 | 666,018 |
| Mode SS | |||
|---|---|---|---|
| Quadrant | BADHDUFLAG | Total packets | Discarded packets |
| A | 0 | 144 | 0 |
| B | 0 | 144 | 0 |
| C | 0 | 144 | 0 |
| D | 0 | 144 | 0 |
| Mode M0 | |||
|---|---|---|---|
| Quadrant | BADHDUFLAG | Total packets | Discarded packets |
| A | 0 | 24320 | 0 |
| B | 0 | 15676 | 0 |
| C | 0 | 14950 | 0 |
| D | 0 | 19521 | 0 |
| Quadrant | Total seconds | Saturated seconds | Saturation percentage |
|---|---|---|---|
| A | 7286 | 194 | 2.662641% |
| B | 7286 | 72 | 0.988197% |
| C | 7286 | 14 | 0.192149% |
| D | 7286 | 381 | 5.229207% |
Noise dominated data is calculated using 1-second bins in cleaned event files. If a bin has >2000 counts, and if more than 50% of those come from <1% of pixels, then it is considered to be noise-dominated and hence unusable.
| Quadrant | # 1 sec bins | Bins with >0 counts | Bins with >2000 counts | High rate bins dominated by noise | Noise dominated (total time) | Noise dominated (detector-on time) | Marked lightcurve |
|---|---|---|---|---|---|---|---|
| A | 7286 | 7286 | 100 | 100 | 1.37% | 1.37% |  |
| B | 7286 | 7286 | 22 | 22 | 0.30% | 0.30% |  |
| C | 7286 | 7286 | 1 | 1 | 0.01% | 0.01% |  |
| D | 7286 | 7286 | 360 | 360 | 4.94% | 4.94% |  |
Top three noisy pixels from each quadrant. If the there are fewer than three noisy pixels in the level2.evt file, extra rows are filled as -1
| Pixel properties | Quadrant properties | ||||||
|---|---|---|---|---|---|---|---|
| Quadrant | DetID | PixID | Counts | Sigma | Mean | Median | Sigma |
| A | 10 | 83 | 3272563 | 19803.66 | 787 | 766 | 165.2 |
| A | 13 | 248 | 351206 | 2121.16 | 787 | 766 | 165.2 |
| A | 2 | 79 | 23971 | 140.46 | 787 | 766 | 165.2 |
| B | 3 | 112 | 246413 | 1582.29 | 784 | 760 | 155.3 |
| B | 5 | 255 | 50797 | 322.3 | 784 | 760 | 155.3 |
| B | 5 | 172 | 34260 | 215.78 | 784 | 760 | 155.3 |
| C | 15 | 208 | 39639 | 211.03 | 782 | 785 | 184.1 |
| C | 14 | 254 | 23064 | 121.0 | 782 | 785 | 184.1 |
| C | 3 | 233 | 15126 | 77.89 | 782 | 785 | 184.1 |
| D | 13 | 249 | 918389 | 4795.84 | 766 | 742 | 191.3 |
| D | 1 | 52 | 398094 | 2076.66 | 766 | 742 | 191.3 |
| D | 2 | 249 | 311589 | 1624.56 | 766 | 742 | 191.3 |
Histogram calculated using DETX and DETY for each event in the final _common_clean file
| Quadrant A |  |
 |
Quadrant B |
|---|---|---|---|
| Quadrant D |  |
 |
Quadrant C |
| Plot type | Count rate plots | Images |
|---|---|---|
| Comparison with Poisson distribution Blue bars denote a histogram of data divided into 1 sec bins. Red curve is a Poisson curve with rate = median count rate of data. |
 |
 |
| Quadrant-wise count rates Data is divided into 100 sec bins |
 |
|
| Module-wise count rates for Quadrant A Data is divided into 100 sec bins |
 |
 |
| Module-wise count rates for Quadrant B Data is divided into 100 sec bins |
 |
 |
| Module-wise count rates for Quadrant C Data is divided into 100 sec bins |
 |
 |
| Module-wise count rates for Quadrant D Data is divided into 100 sec bins |
 |
 |
| Parameter | Plot |
|---|---|
| CZT HV Monitor |  |
| D_VDD |  |
| Temperature 1 |  |
| Veto HV Monitor |  |
| Veto LLD |  |
| Alpha Counter |  |
| _CPM_Rate |  |
| CZT Counter |  |
| +2.5 Volts monitor | 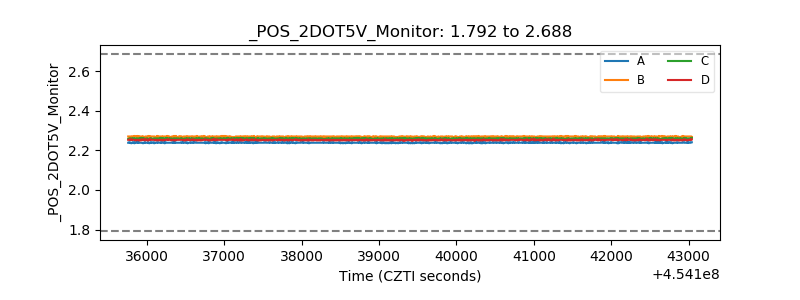 |
| +5 Volts monitor | 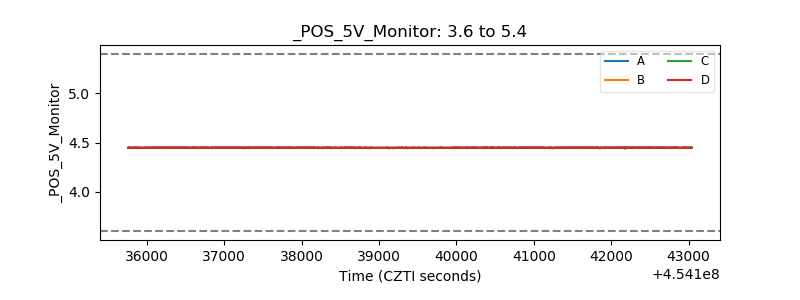 |
| _ROLL_ROT |  |
| _Roll_DEC |  |
| _Roll_RA |  |
| Veto Counter |  |