| Param | Original file | Final file |
|---|---|---|
| Filename | modeM0/AS1A13_068T13_9000006268_46799cztM0_level2.fits | modeM0/AS1A13_068T13_9000006268_46799cztM0_level2_quad_clean.evt |
| Size (bytes) | 605,914,560 | 133,649,280 |
| Size | 577.8 MB | 127.5 MB |
| Events in quadrant A | 7,624,762 | 885,055 |
| Events in quadrant B | 4,143,605 | 913,423 |
| Events in quadrant C | 3,731,810 | 885,078 |
| Events in quadrant D | 6,271,579 | 774,207 |
| Mode M0 | |||
|---|---|---|---|
| Quadrant | BADHDUFLAG | Total packets | Discarded packets |
| A | 0 | 28069 | 0 |
| B | 0 | 18200 | 0 |
| C | 0 | 17401 | 0 |
| D | 0 | 24561 | 1 |
| Mode SS | |||
|---|---|---|---|
| Quadrant | BADHDUFLAG | Total packets | Discarded packets |
| A | 0 | 168 | 0 |
| B | 0 | 168 | 0 |
| C | 0 | 168 | 0 |
| D | 0 | 168 | 0 |
| Quadrant | Total seconds | Saturated seconds | Saturation percentage |
|---|---|---|---|
| A | 8481 | 90 | 1.061196% |
| B | 8481 | 70 | 0.825374% |
| C | 8482 | 10 | 0.117897% |
| D | 8481 | 500 | 5.895531% |
Noise dominated data is calculated using 1-second bins in cleaned event files. If a bin has >2000 counts, and if more than 50% of those come from <1% of pixels, then it is considered to be noise-dominated and hence unusable.
| Quadrant | # 1 sec bins | Bins with >0 counts | Bins with >2000 counts | High rate bins dominated by noise | Noise dominated (total time) | Noise dominated (detector-on time) | Marked lightcurve |
|---|---|---|---|---|---|---|---|
| A | 8481 | 8481 | 36 | 36 | 0.42% | 0.42% |  |
| B | 8481 | 8481 | 38 | 38 | 0.45% | 0.45% |  |
| C | 8482 | 8482 | 13 | 13 | 0.15% | 0.15% |  |
| D | 8481 | 8481 | 440 | 440 | 5.19% | 5.19% |  |
Top three noisy pixels from each quadrant. If the there are fewer than three noisy pixels in the level2.evt file, extra rows are filled as -1
| Pixel properties | Quadrant properties | ||||||
|---|---|---|---|---|---|---|---|
| Quadrant | DetID | PixID | Counts | Sigma | Mean | Median | Sigma |
| A | 10 | 83 | 3825898 | 19815.24 | 923 | 900 | 193.0 |
| A | 13 | 248 | 112911 | 580.27 | 923 | 900 | 193.0 |
| A | 15 | 235 | 58724 | 299.55 | 923 | 900 | 193.0 |
| B | 3 | 112 | 220298 | 1196.48 | 927 | 896 | 183.4 |
| B | 5 | 172 | 120377 | 651.58 | 927 | 896 | 183.4 |
| B | 0 | 198 | 37530 | 199.78 | 927 | 896 | 183.4 |
| C | 3 | 233 | 85768 | 393.8 | 914 | 917 | 215.5 |
| C | 14 | 254 | 55864 | 255.01 | 914 | 917 | 215.5 |
| C | 12 | 249 | 19501 | 86.25 | 914 | 917 | 215.5 |
| D | 13 | 249 | 1108082 | 4993.5 | 887 | 857 | 221.7 |
| D | 1 | 52 | 729793 | 3287.45 | 887 | 857 | 221.7 |
| D | 13 | 138 | 483340 | 2175.96 | 887 | 857 | 221.7 |
Histogram calculated using DETX and DETY for each event in the final _common_clean file
| Quadrant A |  |
 |
Quadrant B |
|---|---|---|---|
| Quadrant D |  |
 |
Quadrant C |
| Plot type | Count rate plots | Images |
|---|---|---|
| Comparison with Poisson distribution Blue bars denote a histogram of data divided into 1 sec bins. Red curve is a Poisson curve with rate = median count rate of data. |
 |
 |
| Quadrant-wise count rates Data is divided into 100 sec bins |
 |
|
| Module-wise count rates for Quadrant A Data is divided into 100 sec bins |
 |
 |
| Module-wise count rates for Quadrant B Data is divided into 100 sec bins |
 |
 |
| Module-wise count rates for Quadrant C Data is divided into 100 sec bins |
 |
 |
| Module-wise count rates for Quadrant D Data is divided into 100 sec bins |
 |
 |
| Parameter | Plot |
|---|---|
| CZT HV Monitor |  |
| D_VDD |  |
| Temperature 1 |  |
| Veto HV Monitor |  |
| Veto LLD |  |
| Alpha Counter |  |
| _CPM_Rate |  |
| CZT Counter |  |
| +2.5 Volts monitor | 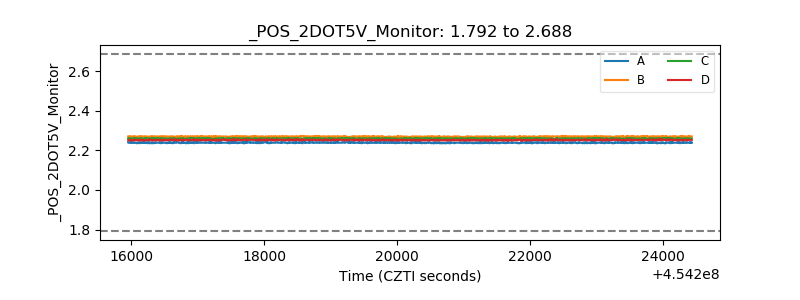 |
| +5 Volts monitor | 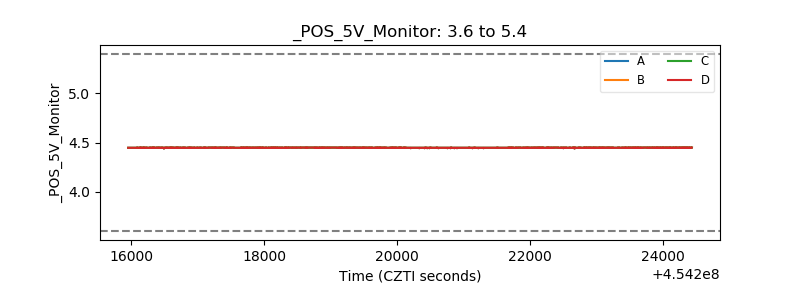 |
| _ROLL_ROT |  |
| _Roll_DEC |  |
| _Roll_RA |  |
| Veto Counter |  |