| Param | Original file | Final file |
|---|---|---|
| Filename | modeM0/AS1A13_053T01_9000006274_46840cztM0_level2.fits | modeM0/AS1A13_053T01_9000006274_46840cztM0_level2_quad_clean.evt |
| Size (bytes) | 504,702,720 | 115,807,680 |
| Size | 481.3 MB | 110.4 MB |
| Events in quadrant A | 6,778,103 | 762,831 |
| Events in quadrant B | 3,783,537 | 795,374 |
| Events in quadrant C | 3,454,162 | 760,196 |
| Events in quadrant D | 4,108,182 | 687,070 |
| Mode M0 | |||
|---|---|---|---|
| Quadrant | BADHDUFLAG | Total packets | Discarded packets |
| A | 0 | 24527 | 3 |
| B | 0 | 16092 | 2 |
| C | 0 | 15643 | 2 |
| D | 0 | 17454 | 2 |
| Mode M9 | |||
|---|---|---|---|
| Quadrant | BADHDUFLAG | Total packets | Discarded packets |
| A | 0 | 9 | 0 |
| B | 0 | 9 | 0 |
| C | 0 | 10 | 0 |
| D | 0 | 10 | 0 |
| Mode SS | |||
|---|---|---|---|
| Quadrant | BADHDUFLAG | Total packets | Discarded packets |
| A | 0 | 146 | 0 |
| B | 0 | 146 | 0 |
| C | 0 | 146 | 0 |
| D | 0 | 146 | 0 |
| Quadrant | Total seconds | Saturated seconds | Saturation percentage |
|---|---|---|---|
| A | 7196 | 359 | 4.988883% |
| B | 7196 | 128 | 1.778766% |
| C | 7196 | 87 | 1.209005% |
| D | 7196 | 281 | 3.904947% |
Noise dominated data is calculated using 1-second bins in cleaned event files. If a bin has >2000 counts, and if more than 50% of those come from <1% of pixels, then it is considered to be noise-dominated and hence unusable.
| Quadrant | # 1 sec bins | Bins with >0 counts | Bins with >2000 counts | High rate bins dominated by noise | Noise dominated (total time) | Noise dominated (detector-on time) | Marked lightcurve |
|---|---|---|---|---|---|---|---|
| A | 7786 | 7197 | 20 | 20 | 0.26% | 0.28% | 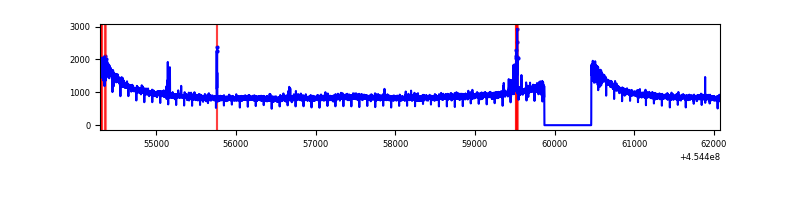 |
| B | 7786 | 7197 | 17 | 17 | 0.22% | 0.24% | 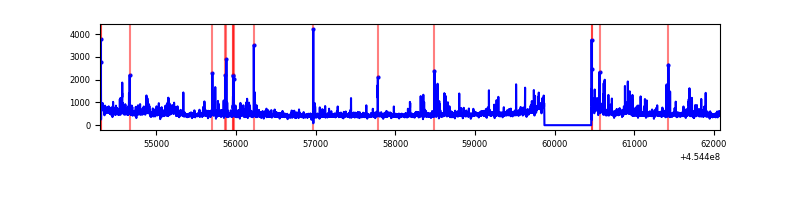 |
| C | 7786 | 7197 | 36 | 36 | 0.46% | 0.50% | 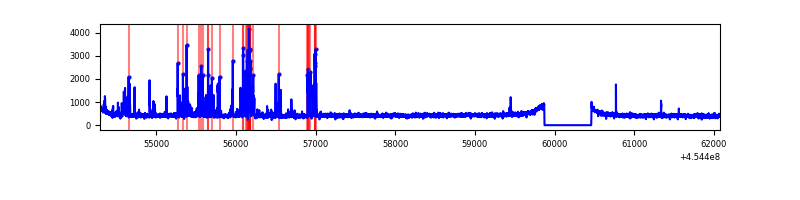 |
| D | 7786 | 7197 | 171 | 171 | 2.20% | 2.38% | 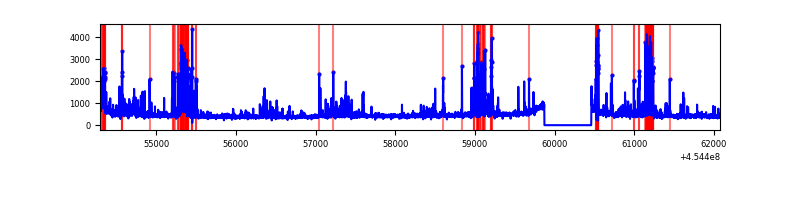 |
Top three noisy pixels from each quadrant. If the there are fewer than three noisy pixels in the level2.evt file, extra rows are filled as -1
| Pixel properties | Quadrant properties | ||||||
|---|---|---|---|---|---|---|---|
| Quadrant | DetID | PixID | Counts | Sigma | Mean | Median | Sigma |
| A | 10 | 83 | 3634707 | 22000.65 | 793 | 775 | 165.2 |
| A | 13 | 248 | 43344 | 257.72 | 793 | 775 | 165.2 |
| A | 7 | 3 | 15679 | 90.23 | 793 | 775 | 165.2 |
| B | 3 | 112 | 488113 | 3120.72 | 795 | 769 | 156.2 |
| B | 0 | 198 | 30077 | 187.67 | 795 | 769 | 156.2 |
| B | 5 | 172 | 27557 | 171.54 | 795 | 769 | 156.2 |
| C | 14 | 254 | 248104 | 1346.91 | 781 | 783 | 183.6 |
| C | 1 | 241 | 148237 | 803.03 | 781 | 783 | 183.6 |
| C | 3 | 233 | 6799 | 32.76 | 781 | 783 | 183.6 |
| D | 13 | 249 | 647472 | 3326.39 | 775 | 751 | 194.4 |
| D | 1 | 52 | 361291 | 1854.43 | 775 | 751 | 194.4 |
| D | 2 | 249 | 63304 | 321.74 | 775 | 751 | 194.4 |
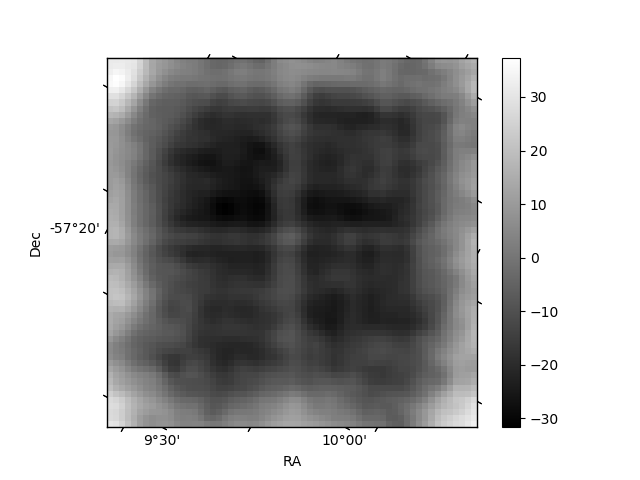
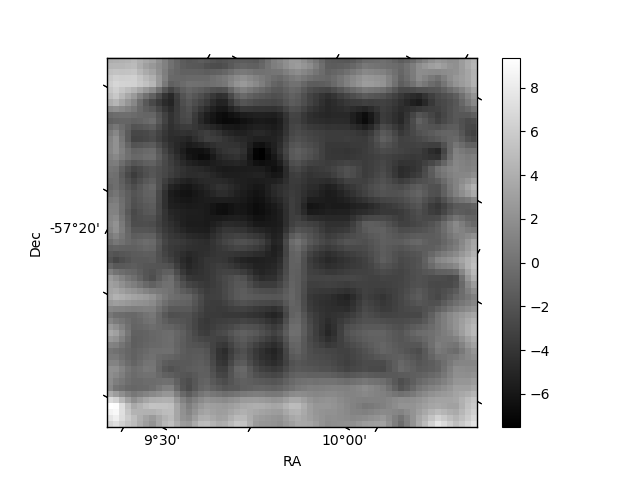
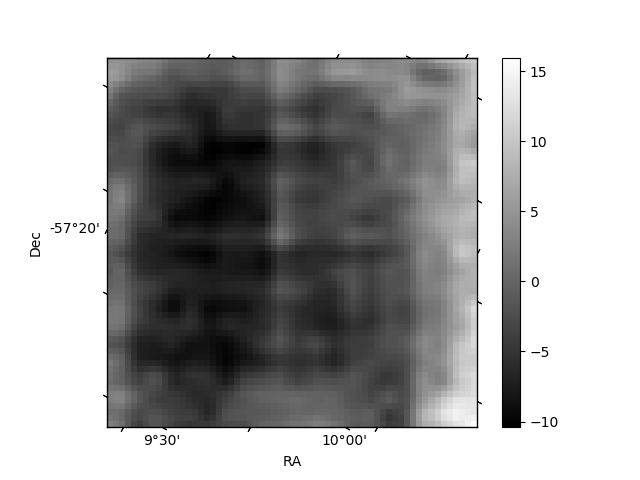
Histogram calculated using DETX and DETY for each event in the final _common_clean file
| Quadrant A | 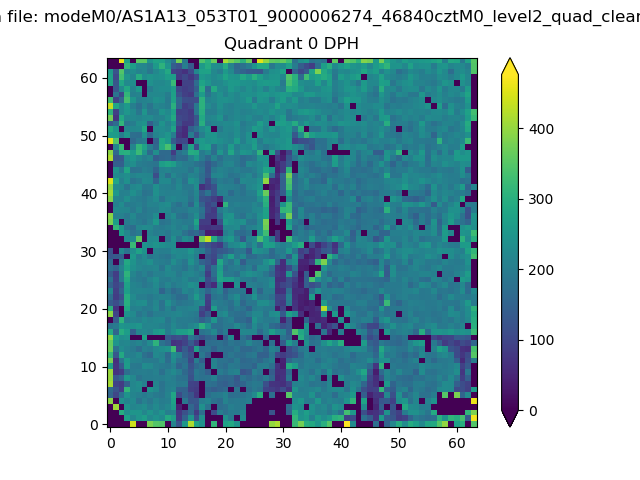 |
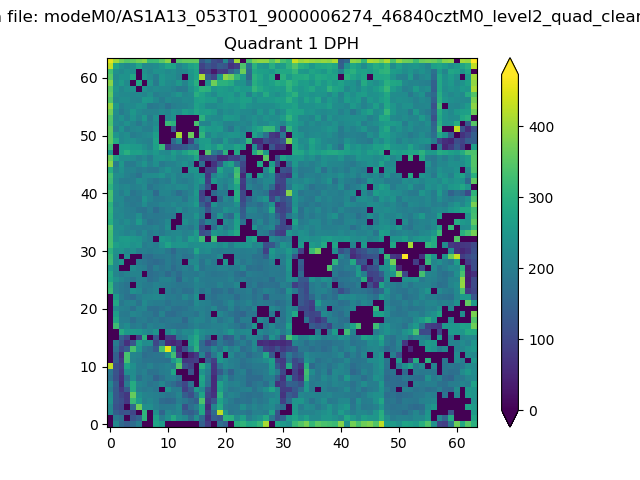 |
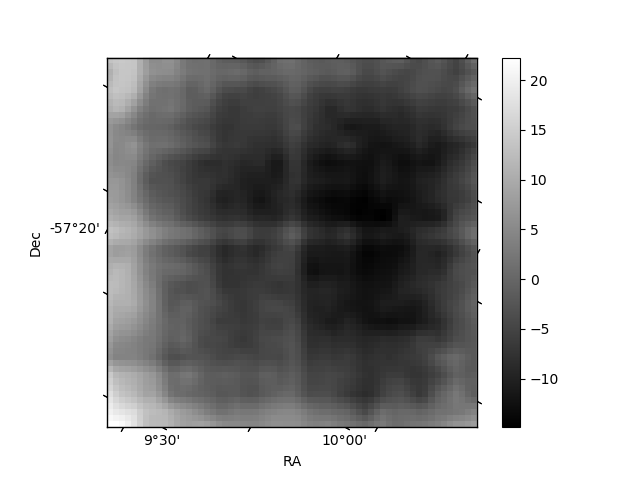
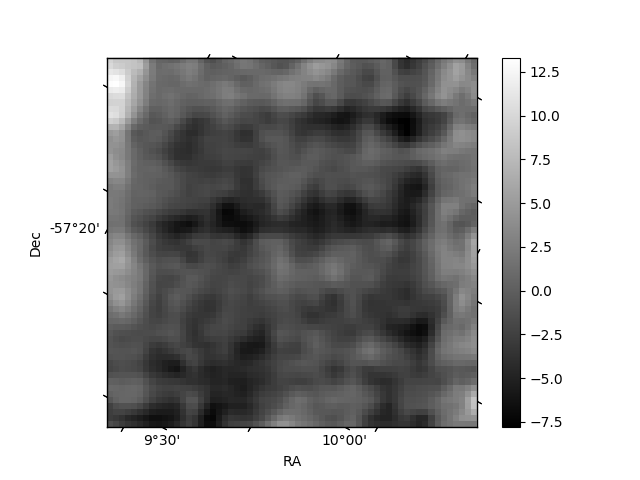
Quadrant B |
|---|---|---|---|
| Quadrant D | 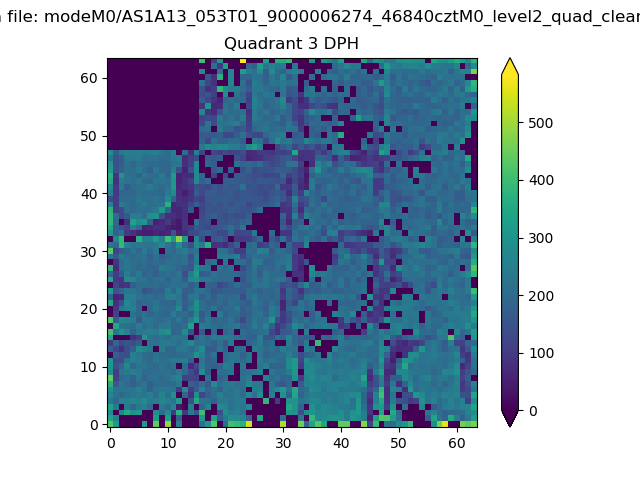 |
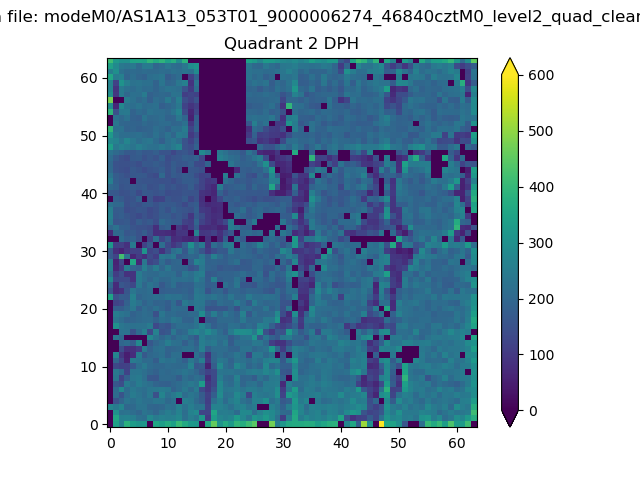 |
Quadrant C |
| Plot type | Count rate plots | Images |
|---|---|---|
| Comparison with Poisson distribution Blue bars denote a histogram of data divided into 1 sec bins. Red curve is a Poisson curve with rate = median count rate of data. |
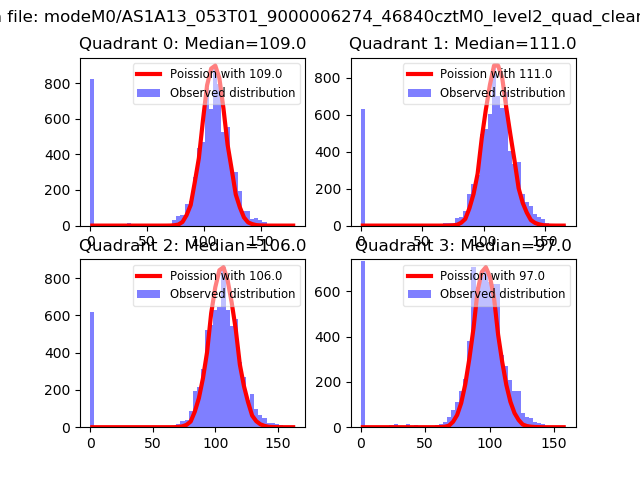 |
 |
| Quadrant-wise count rates Data is divided into 100 sec bins |
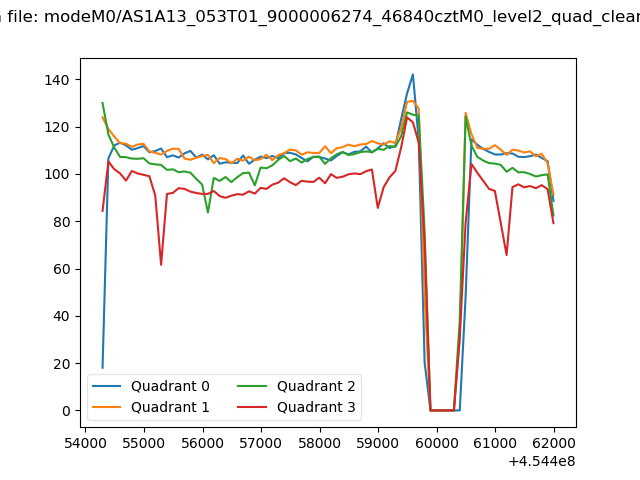 |
|
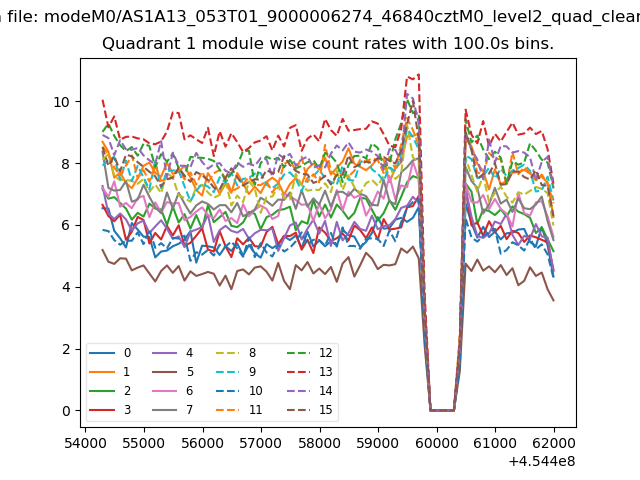
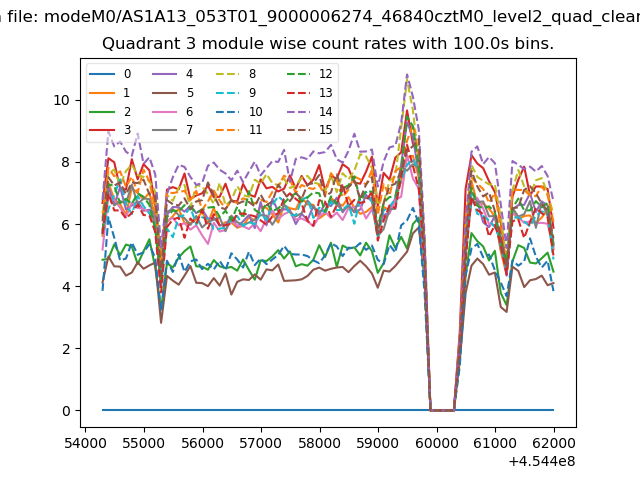
| Module-wise count rates for Quadrant A Data is divided into 100 sec bins |
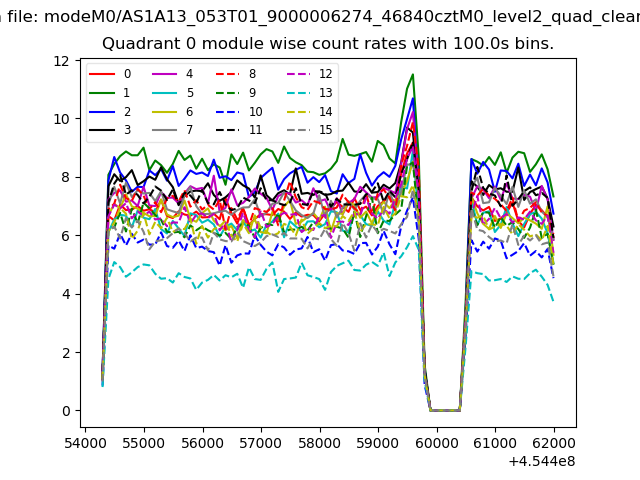 |
 |
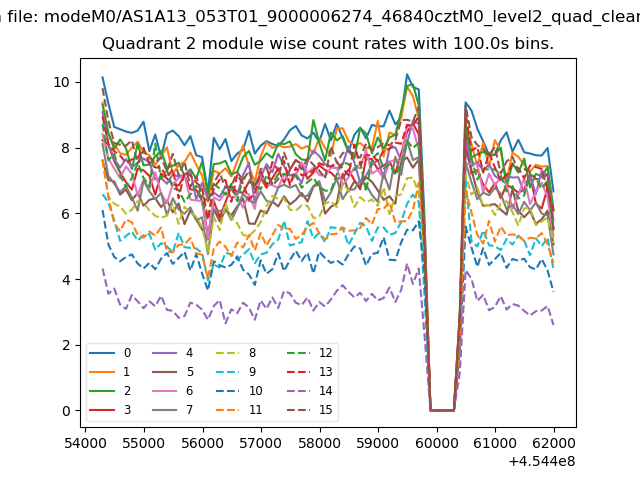
| Module-wise count rates for Quadrant B Data is divided into 100 sec bins |
 |
 |
| Module-wise count rates for Quadrant C Data is divided into 100 sec bins |
 |
 |
| Module-wise count rates for Quadrant D Data is divided into 100 sec bins |
 |
 |
| Parameter | Plot |
|---|---|
| CZT HV Monitor | 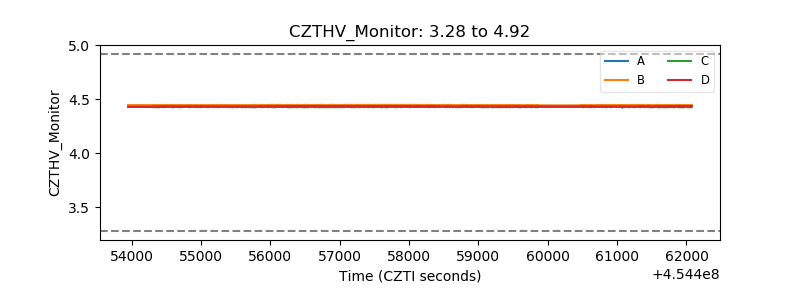 |
| D_VDD | 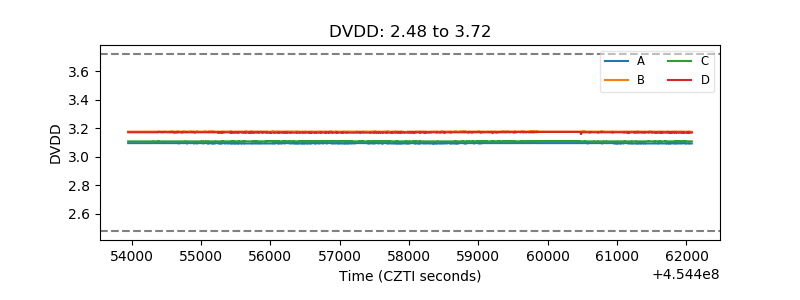 |
| Temperature 1 | 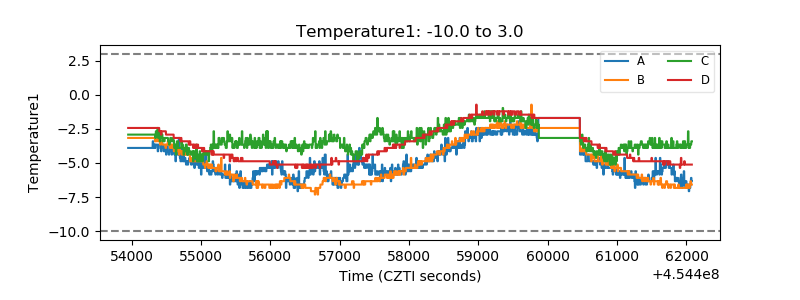 |
| Veto HV Monitor | 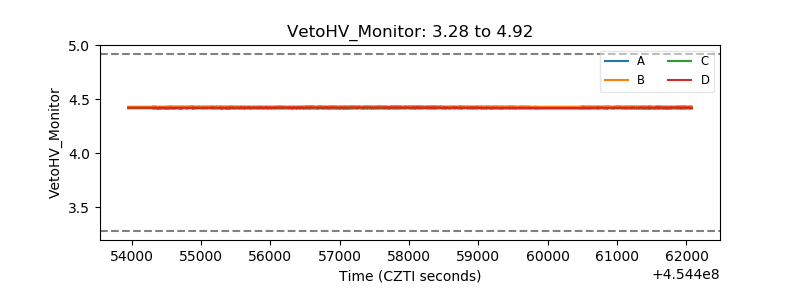 |
| Veto LLD | 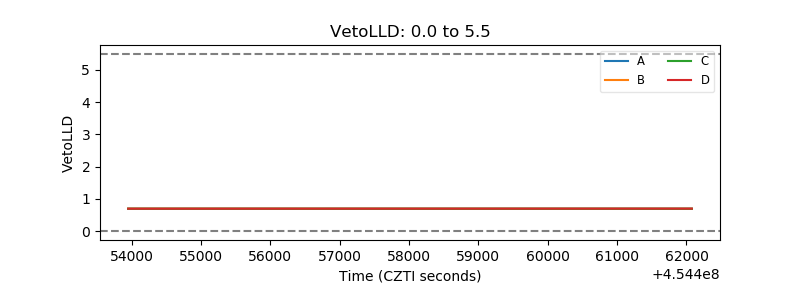 |
| Alpha Counter | 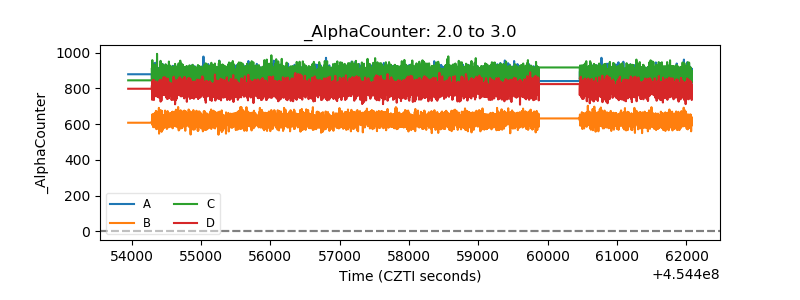 |
| _CPM_Rate | 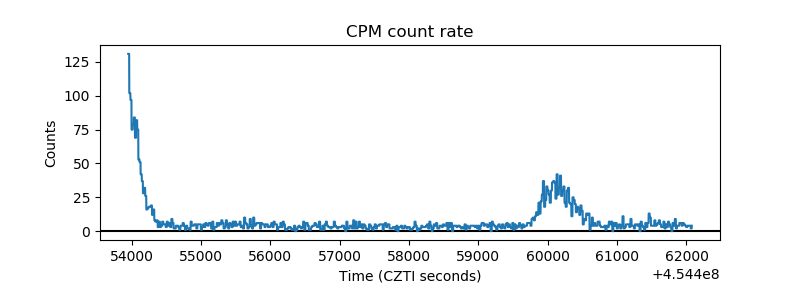 |
| CZT Counter | 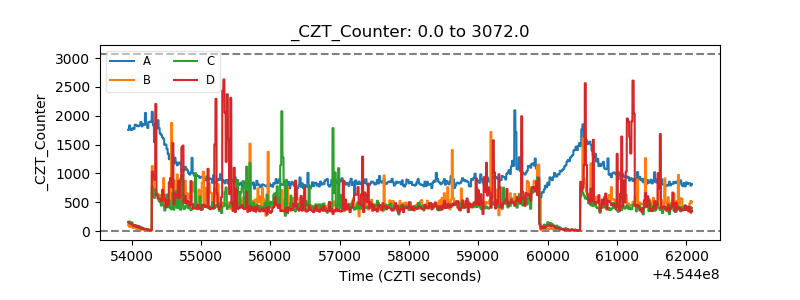 |
| +2.5 Volts monitor | 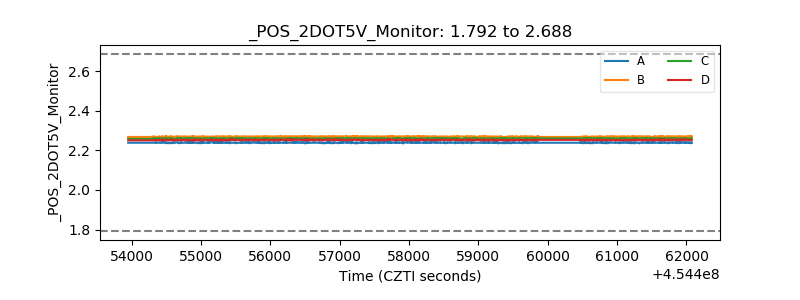 |
| +5 Volts monitor | 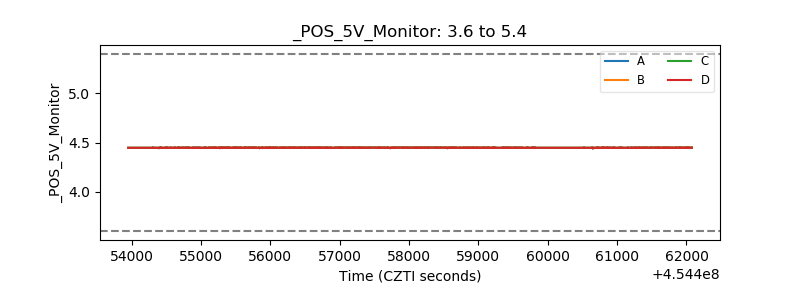 |
| _ROLL_ROT | 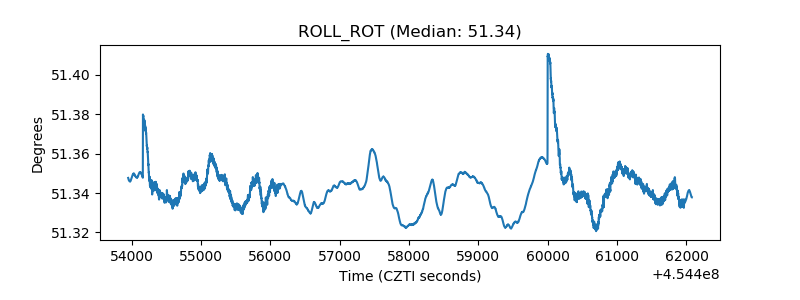 |
| _Roll_DEC | 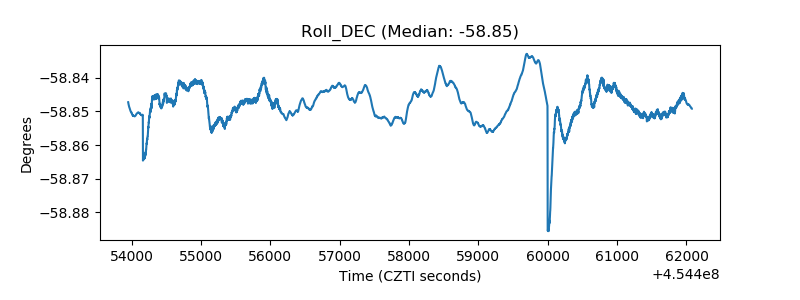 |
| _Roll_RA | 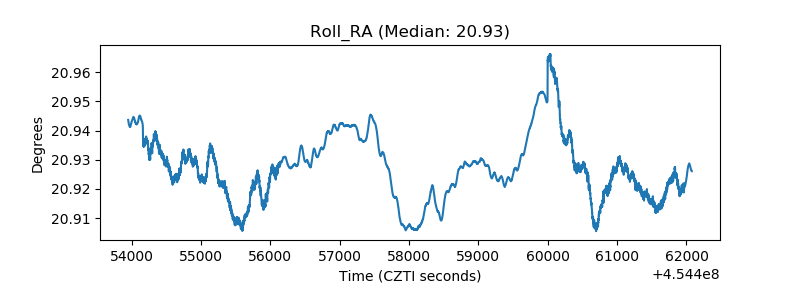 |
| Veto Counter | 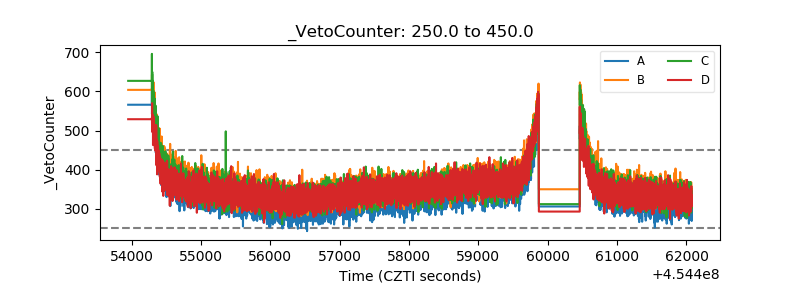 |