| Param | Original file | Final file |
|---|---|---|
| Filename | modeM0/AS1A13_053T01_9000006274_46857cztM0_level2.fits | modeM0/AS1A13_053T01_9000006274_46857cztM0_level2_quad_clean.evt |
| Size (bytes) | 557,645,760 | 131,405,760 |
| Size | 531.8 MB | 125.3 MB |
| Events in quadrant A | 7,255,121 | 883,193 |
| Events in quadrant B | 4,134,191 | 900,949 |
| Events in quadrant C | 3,676,746 | 857,538 |
| Events in quadrant D | 4,936,252 | 763,591 |
| Mode M0 | |||
|---|---|---|---|
| Quadrant | BADHDUFLAG | Total packets | Discarded packets |
| A | 0 | 26636 | 0 |
| B | 0 | 17990 | 0 |
| C | 0 | 17037 | 0 |
| D | 0 | 20796 | 5 |
| Mode SS | |||
|---|---|---|---|
| Quadrant | BADHDUFLAG | Total packets | Discarded packets |
| A | 0 | 166 | 0 |
| B | 0 | 166 | 0 |
| C | 0 | 166 | 0 |
| D | 0 | 166 | 0 |
| Quadrant | Total seconds | Saturated seconds | Saturation percentage |
|---|---|---|---|
| A | 8251 | 84 | 1.018058% |
| B | 8251 | 52 | 0.630227% |
| C | 8252 | 24 | 0.290839% |
| D | 8251 | 413 | 5.005454% |
Noise dominated data is calculated using 1-second bins in cleaned event files. If a bin has >2000 counts, and if more than 50% of those come from <1% of pixels, then it is considered to be noise-dominated and hence unusable.
| Quadrant | # 1 sec bins | Bins with >0 counts | Bins with >2000 counts | High rate bins dominated by noise | Noise dominated (total time) | Noise dominated (detector-on time) | Marked lightcurve |
|---|---|---|---|---|---|---|---|
| A | 8251 | 8251 | 6 | 6 | 0.07% | 0.07% |  |
| B | 8251 | 8251 | 16 | 16 | 0.19% | 0.19% |  |
| C | 8252 | 8252 | 9 | 9 | 0.11% | 0.11% |  |
| D | 8252 | 8252 | 304 | 304 | 3.68% | 3.68% |  |
Top three noisy pixels from each quadrant. If the there are fewer than three noisy pixels in the level2.evt file, extra rows are filled as -1
| Pixel properties | Quadrant properties | ||||||
|---|---|---|---|---|---|---|---|
| Quadrant | DetID | PixID | Counts | Sigma | Mean | Median | Sigma |
| A | 10 | 83 | 3665322 | 19213.61 | 911 | 888 | 190.7 |
| A | 13 | 248 | 24519 | 123.9 | 911 | 888 | 190.7 |
| A | 4 | 0 | 19587 | 98.04 | 911 | 888 | 190.7 |
| B | 12 | 3 | 282293 | 1573.73 | 908 | 879 | 178.8 |
| B | 3 | 112 | 145727 | 810.02 | 908 | 879 | 178.8 |
| B | 0 | 200 | 32121 | 174.71 | 908 | 879 | 178.8 |
| C | 1 | 241 | 86833 | 406.06 | 898 | 900 | 211.6 |
| C | 14 | 254 | 84412 | 394.62 | 898 | 900 | 211.6 |
| C | 13 | 61 | 5879 | 23.53 | 898 | 900 | 211.6 |
| D | 13 | 249 | 974974 | 4458.5 | 879 | 850 | 218.5 |
| D | 1 | 52 | 462895 | 2114.75 | 879 | 850 | 218.5 |
| D | 5 | 171 | 50400 | 226.79 | 879 | 850 | 218.5 |
Histogram calculated using DETX and DETY for each event in the final _common_clean file
| Quadrant A |  |
 |
Quadrant B |
|---|---|---|---|
| Quadrant D |  |
 |
Quadrant C |
| Plot type | Count rate plots | Images |
|---|---|---|
| Comparison with Poisson distribution Blue bars denote a histogram of data divided into 1 sec bins. Red curve is a Poisson curve with rate = median count rate of data. |
 |
 |
| Quadrant-wise count rates Data is divided into 100 sec bins |
 |
|
| Module-wise count rates for Quadrant A Data is divided into 100 sec bins |
 |
 |
| Module-wise count rates for Quadrant B Data is divided into 100 sec bins |
 |
 |
| Module-wise count rates for Quadrant C Data is divided into 100 sec bins |
 |
 |
| Module-wise count rates for Quadrant D Data is divided into 100 sec bins |
 |
 |
| Parameter | Plot |
|---|---|
| CZT HV Monitor |  |
| D_VDD |  |
| Temperature 1 |  |
| Veto HV Monitor |  |
| Veto LLD |  |
| Alpha Counter |  |
| _CPM_Rate |  |
| CZT Counter |  |
| +2.5 Volts monitor |  |
| +5 Volts monitor | 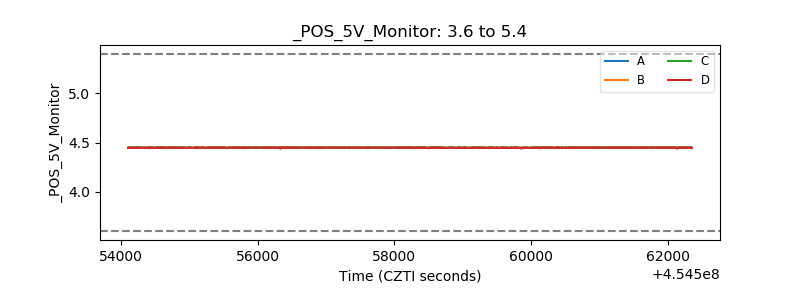 |
| _ROLL_ROT |  |
| _Roll_DEC |  |
| _Roll_RA |  |
| Veto Counter |  |