| Param | Original file | Final file |
|---|---|---|
| Filename | modeM0/AS1A13_053T01_9000006274_46872cztM0_level2.fits | modeM0/AS1A13_053T01_9000006274_46872cztM0_level2_quad_clean.evt |
| Size (bytes) | 522,371,520 | 116,464,320 |
| Size | 498.2 MB | 111.1 MB |
| Events in quadrant A | 6,507,720 | 789,151 |
| Events in quadrant B | 3,465,938 | 808,862 |
| Events in quadrant C | 3,468,875 | 749,098 |
| Events in quadrant D | 5,315,804 | 660,925 |
| Mode M0 | |||
|---|---|---|---|
| Quadrant | BADHDUFLAG | Total packets | Discarded packets |
| A | 0 | 23709 | 0 |
| B | 0 | 15738 | 0 |
| C | 0 | 15959 | 3 |
| D | 0 | 21322 | 0 |
| Mode SS | |||
|---|---|---|---|
| Quadrant | BADHDUFLAG | Total packets | Discarded packets |
| A | 0 | 148 | 0 |
| B | 0 | 148 | 0 |
| C | 0 | 148 | 0 |
| D | 0 | 148 | 0 |
| Quadrant | Total seconds | Saturated seconds | Saturation percentage |
|---|---|---|---|
| A | 7448 | 109 | 1.463480% |
| B | 7448 | 54 | 0.725027% |
| C | 7446 | 223 | 2.994897% |
| D | 7449 | 624 | 8.376963% |
Noise dominated data is calculated using 1-second bins in cleaned event files. If a bin has >2000 counts, and if more than 50% of those come from <1% of pixels, then it is considered to be noise-dominated and hence unusable.
| Quadrant | # 1 sec bins | Bins with >0 counts | Bins with >2000 counts | High rate bins dominated by noise | Noise dominated (total time) | Noise dominated (detector-on time) | Marked lightcurve |
|---|---|---|---|---|---|---|---|
| A | 7448 | 7448 | 0 | 0 | 0.00% | 0.00% | 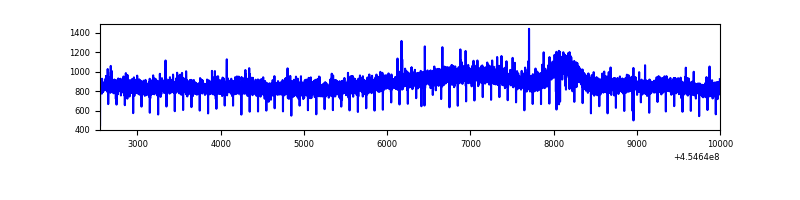 |
| B | 7448 | 7448 | 5 | 5 | 0.07% | 0.07% | 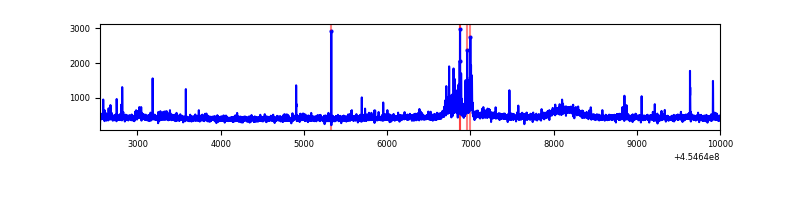 |
| C | 7448 | 7447 | 19 | 19 | 0.26% | 0.26% | 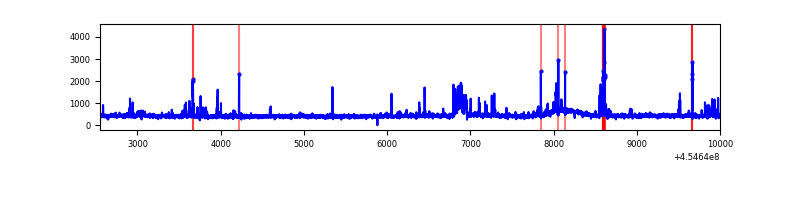 |
| D | 7449 | 7449 | 479 | 479 | 6.43% | 6.43% | 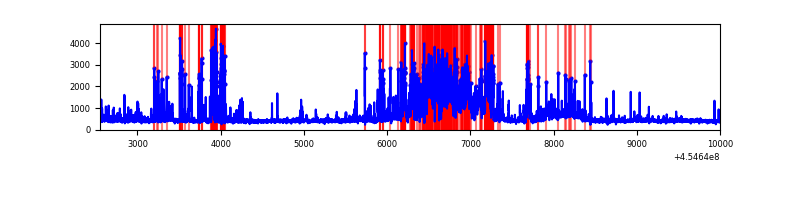 |
Top three noisy pixels from each quadrant. If the there are fewer than three noisy pixels in the level2.evt file, extra rows are filled as -1
| Pixel properties | Quadrant properties | ||||||
|---|---|---|---|---|---|---|---|
| Quadrant | DetID | PixID | Counts | Sigma | Mean | Median | Sigma |
| A | 10 | 83 | 3350430 | 19748.73 | 814 | 795 | 169.6 |
| A | 13 | 254 | 9836 | 53.3 | 814 | 795 | 169.6 |
| A | 3 | 137 | 9683 | 52.4 | 814 | 795 | 169.6 |
| B | 3 | 112 | 194958 | 1188.38 | 810 | 782 | 163.4 |
| B | 0 | 200 | 21509 | 126.85 | 810 | 782 | 163.4 |
| B | 12 | 111 | 20865 | 122.91 | 810 | 782 | 163.4 |
| C | 1 | 241 | 319375 | 1719.87 | 786 | 790 | 185.2 |
| C | 14 | 254 | 76560 | 409.04 | 786 | 790 | 185.2 |
| C | 3 | 233 | 7038 | 33.73 | 786 | 790 | 185.2 |
| D | 13 | 249 | 1523044 | 7822.96 | 777 | 752 | 194.6 |
| D | 1 | 52 | 589015 | 3023.04 | 777 | 752 | 194.6 |
| D | 11 | 192 | 135321 | 691.54 | 777 | 752 | 194.6 |
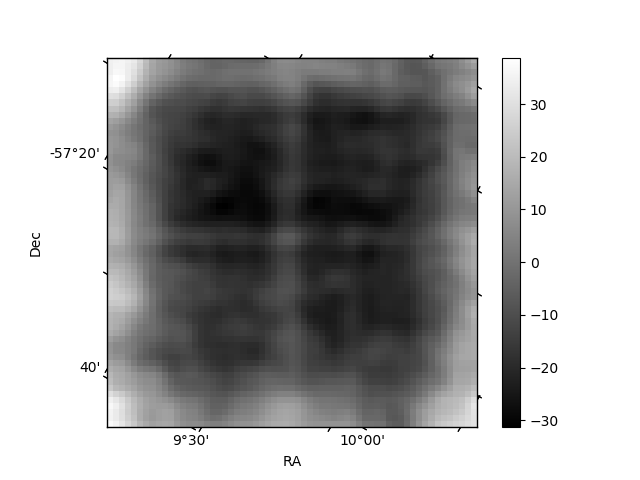
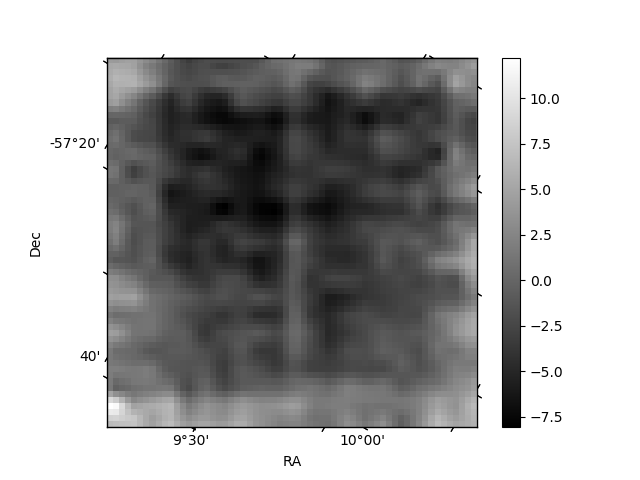
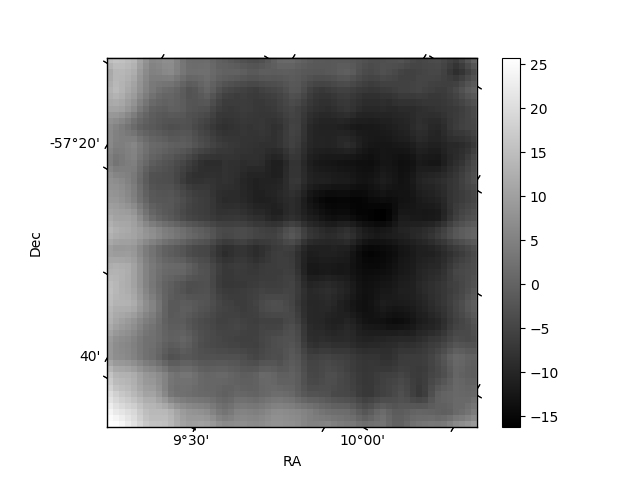
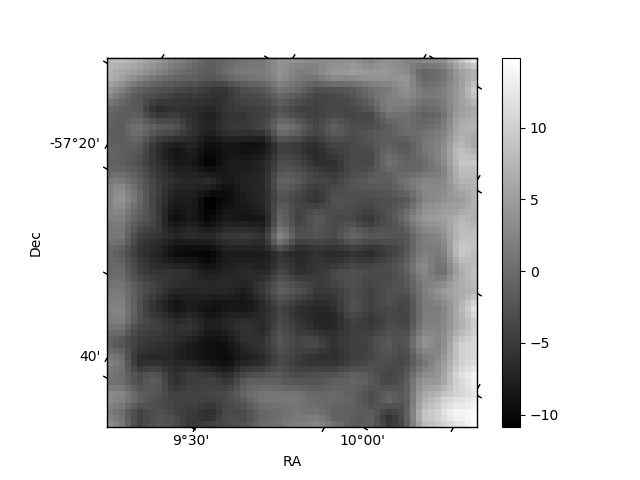
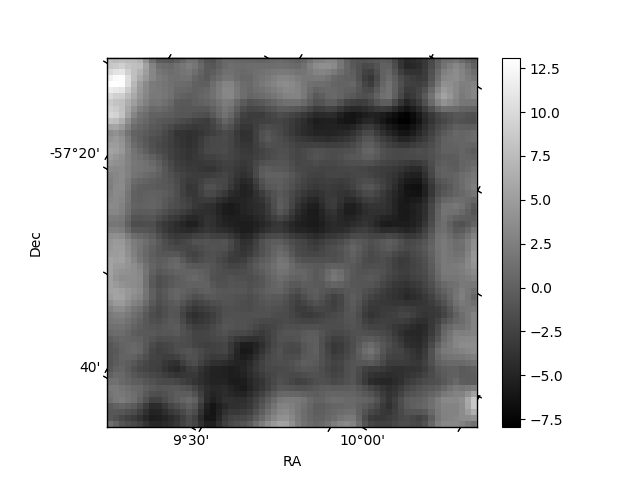
Histogram calculated using DETX and DETY for each event in the final _common_clean file
| Quadrant A | 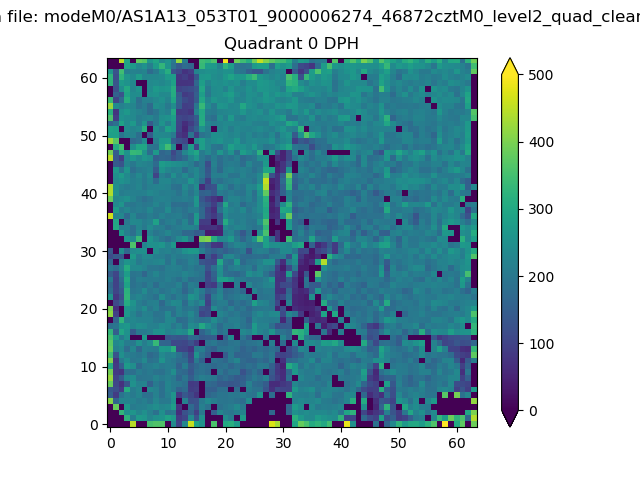 |
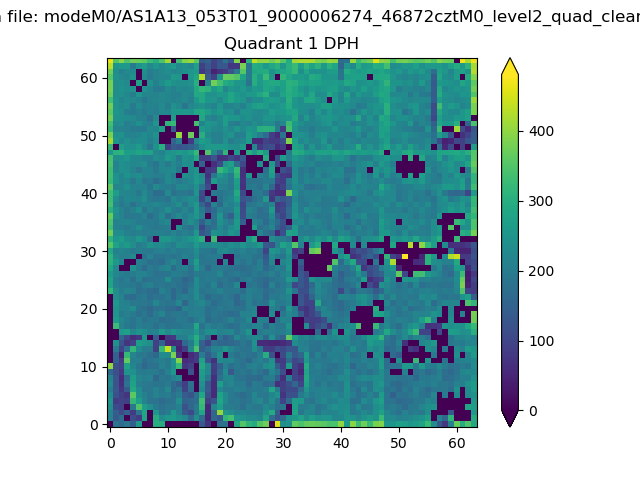 |
Quadrant B |
|---|---|---|---|
| Quadrant D | 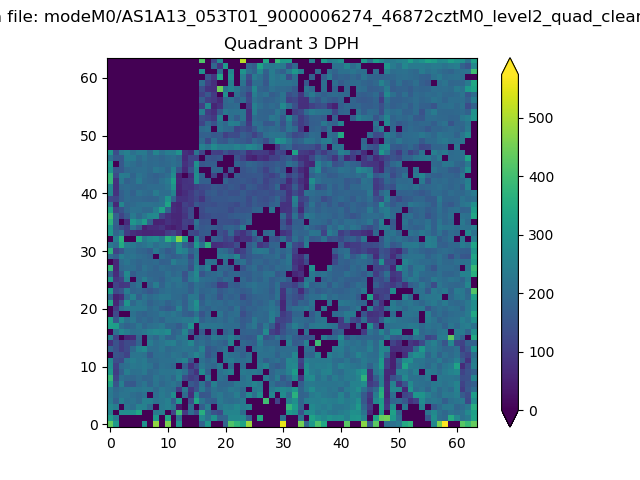 |
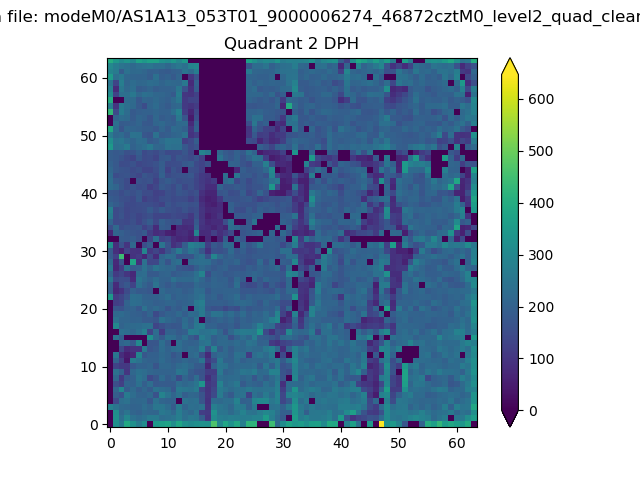 |
Quadrant C |
| Plot type | Count rate plots | Images |
|---|---|---|
| Comparison with Poisson distribution Blue bars denote a histogram of data divided into 1 sec bins. Red curve is a Poisson curve with rate = median count rate of data. |
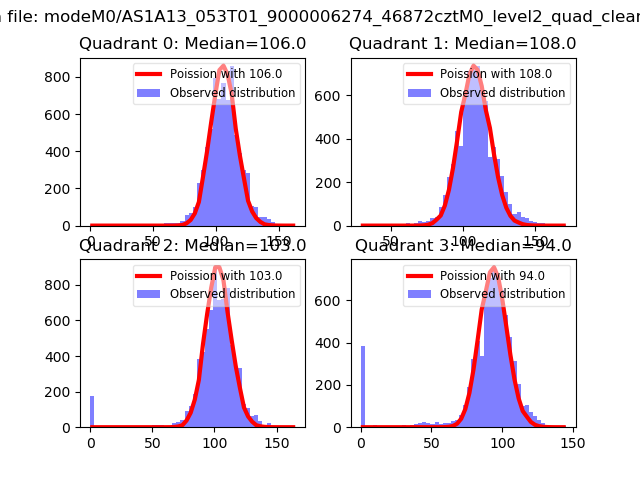 |
 |
| Quadrant-wise count rates Data is divided into 100 sec bins |
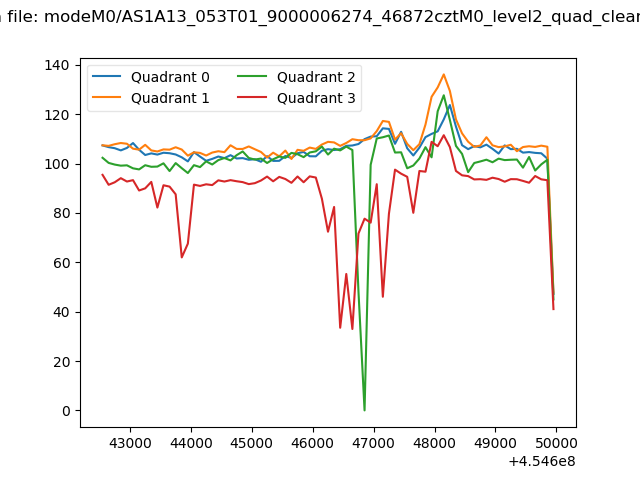 |
|
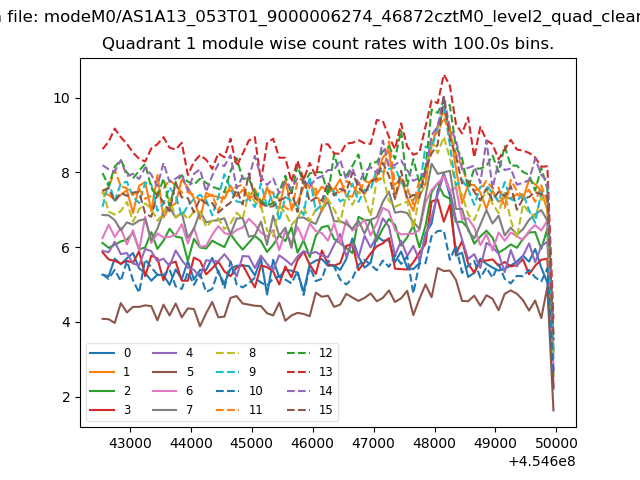
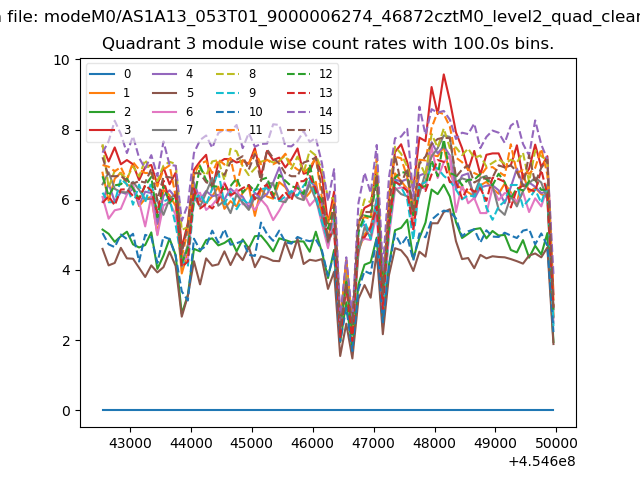
| Module-wise count rates for Quadrant A Data is divided into 100 sec bins |
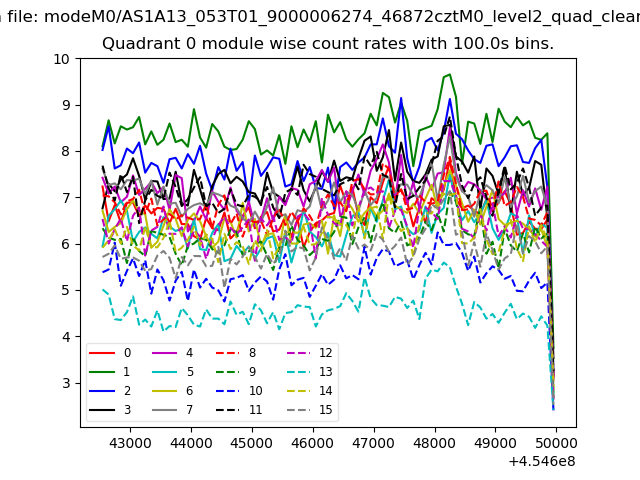 |
 |
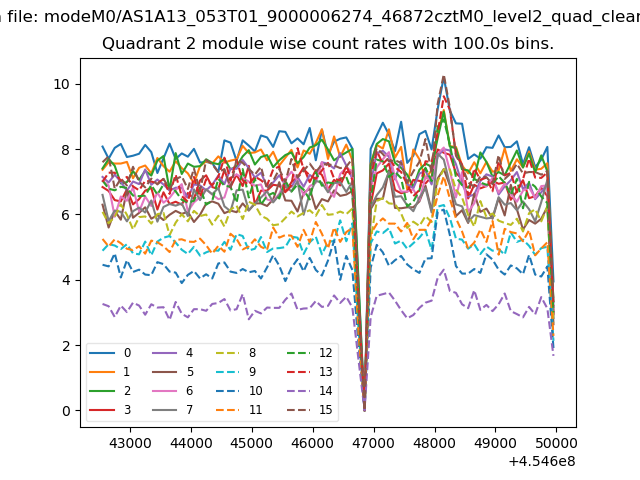
| Module-wise count rates for Quadrant B Data is divided into 100 sec bins |
 |
 |
| Module-wise count rates for Quadrant C Data is divided into 100 sec bins |
 |
 |
| Module-wise count rates for Quadrant D Data is divided into 100 sec bins |
 |
 |
| Parameter | Plot |
|---|---|
| CZT HV Monitor | 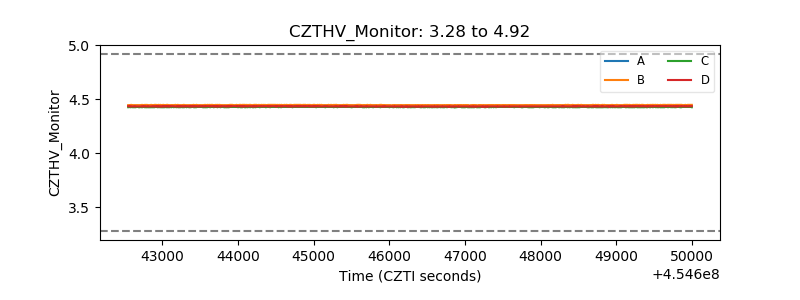 |
| D_VDD | 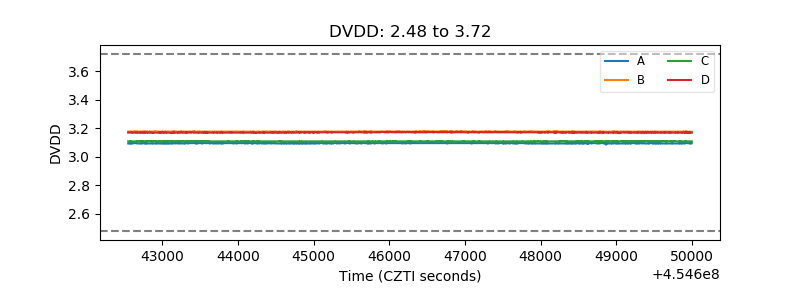 |
| Temperature 1 | 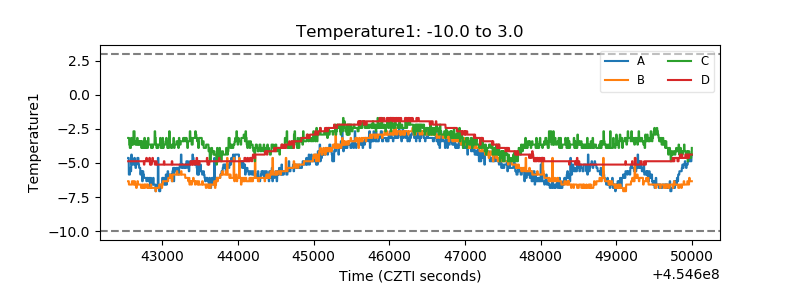 |
| Veto HV Monitor | 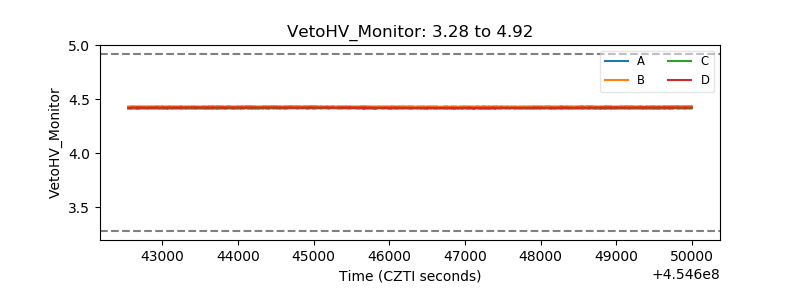 |
| Veto LLD | 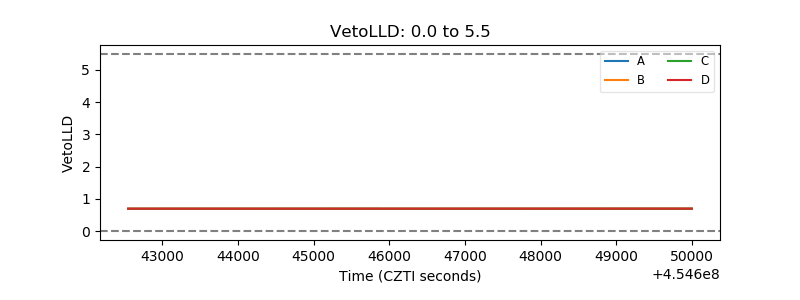 |
| Alpha Counter | 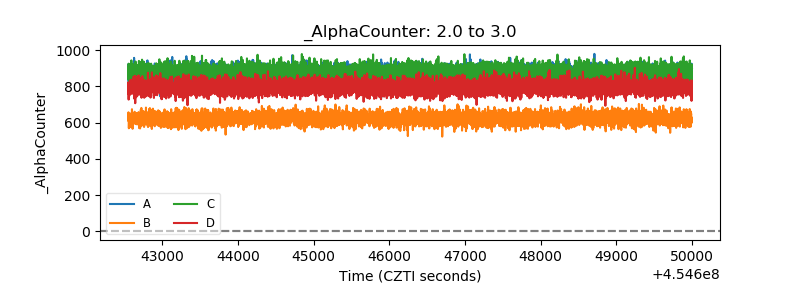 |
| _CPM_Rate | 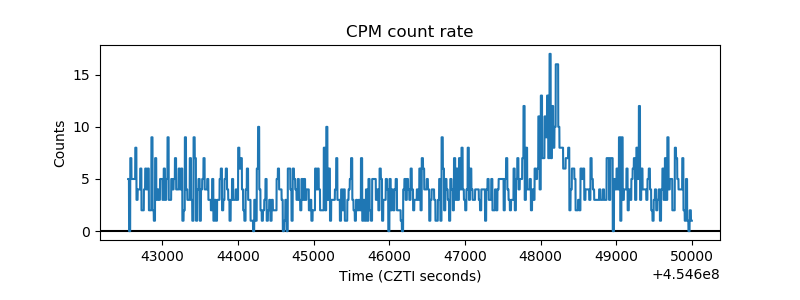 |
| CZT Counter | 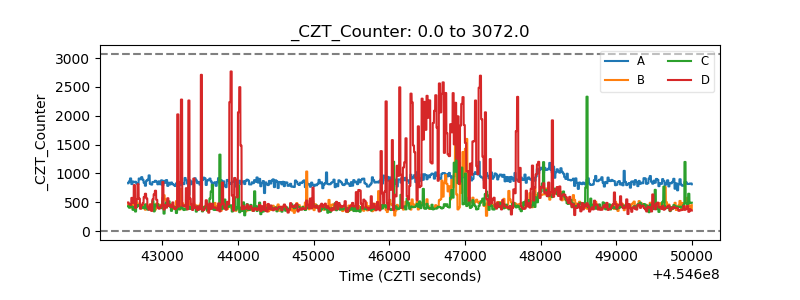 |
| +2.5 Volts monitor | 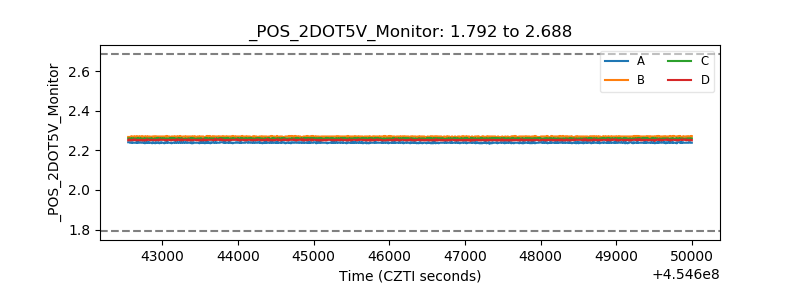 |
| +5 Volts monitor | 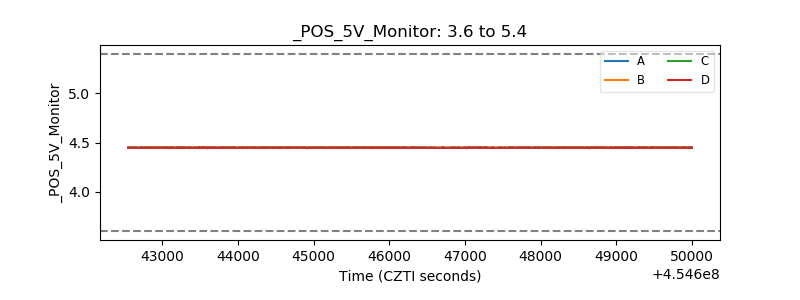 |
| _ROLL_ROT | 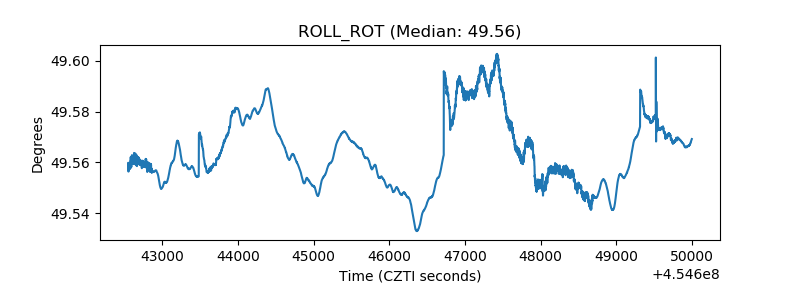 |
| _Roll_DEC | 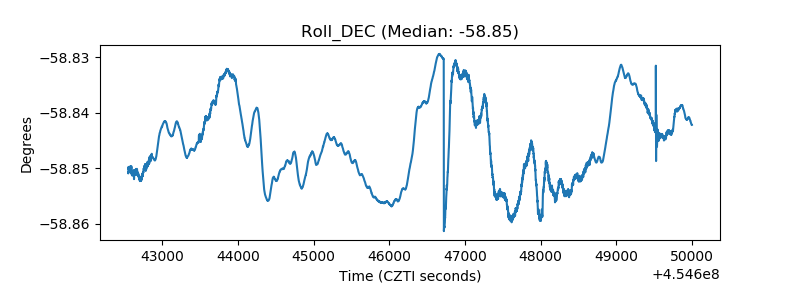 |
| _Roll_RA | 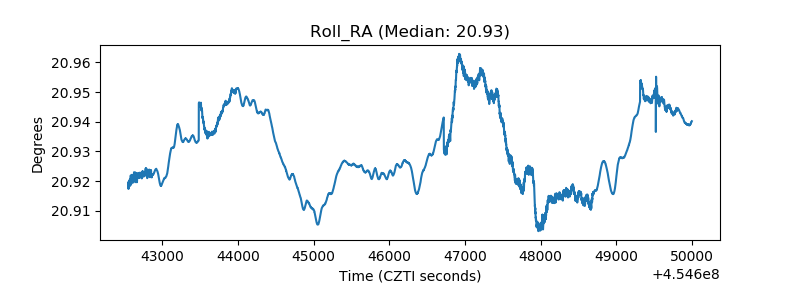 |
| Veto Counter | 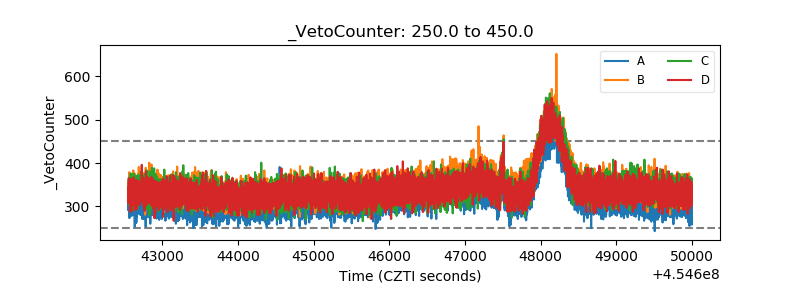 |