| Param | Original file | Final file |
|---|---|---|
| Filename | modeM0/AS1A13_053T01_9000006274_46885cztM0_level2.fits | modeM0/AS1A13_053T01_9000006274_46885cztM0_level2_quad_clean.evt |
| Size (bytes) | 612,573,120 | 123,134,400 |
| Size | 584.2 MB | 117.4 MB |
| Events in quadrant A | 7,204,249 | 841,890 |
| Events in quadrant B | 6,973,657 | 772,325 |
| Events in quadrant C | 3,426,903 | 817,637 |
| Events in quadrant D | 4,457,612 | 746,545 |
| Mode M0 | |||
|---|---|---|---|
| Quadrant | BADHDUFLAG | Total packets | Discarded packets |
| A | 0 | 26426 | 0 |
| B | 0 | 26143 | 0 |
| C | 0 | 16232 | 0 |
| D | 0 | 19123 | 0 |
| Mode SS | |||
|---|---|---|---|
| Quadrant | BADHDUFLAG | Total packets | Discarded packets |
| A | 0 | 158 | 0 |
| B | 0 | 158 | 0 |
| C | 0 | 158 | 0 |
| D | 0 | 158 | 0 |
| Quadrant | Total seconds | Saturated seconds | Saturation percentage |
|---|---|---|---|
| A | 7908 | 162 | 2.048558% |
| B | 7908 | 1015 | 12.835104% |
| C | 7908 | 14 | 0.177036% |
| D | 7908 | 217 | 2.744057% |
Noise dominated data is calculated using 1-second bins in cleaned event files. If a bin has >2000 counts, and if more than 50% of those come from <1% of pixels, then it is considered to be noise-dominated and hence unusable.
| Quadrant | # 1 sec bins | Bins with >0 counts | Bins with >2000 counts | High rate bins dominated by noise | Noise dominated (total time) | Noise dominated (detector-on time) | Marked lightcurve |
|---|---|---|---|---|---|---|---|
| A | 7908 | 7908 | 33 | 33 | 0.42% | 0.42% | 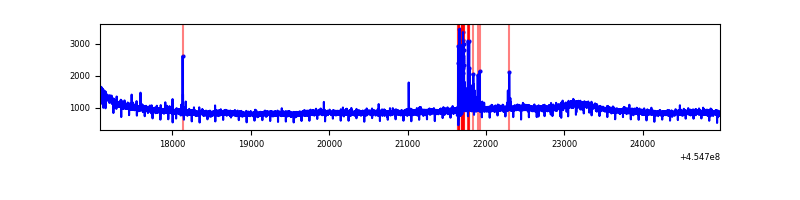 |
| B | 7908 | 7908 | 475 | 475 | 6.01% | 6.01% | 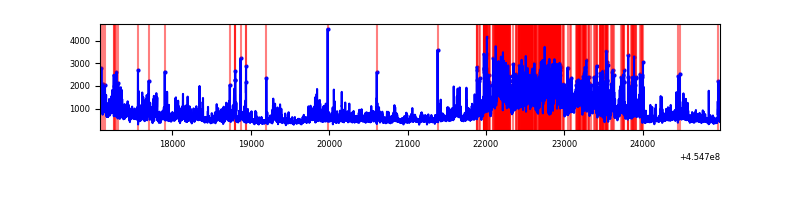 |
| C | 7908 | 7908 | 5 | 5 | 0.06% | 0.06% | 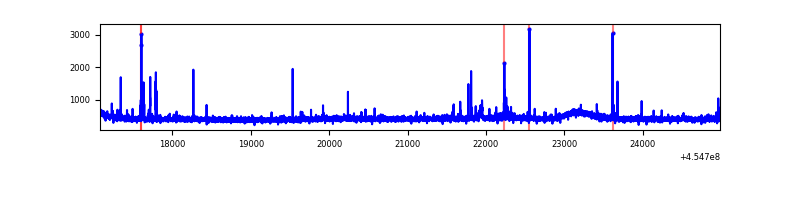 |
| D | 7908 | 7908 | 173 | 173 | 2.19% | 2.19% | 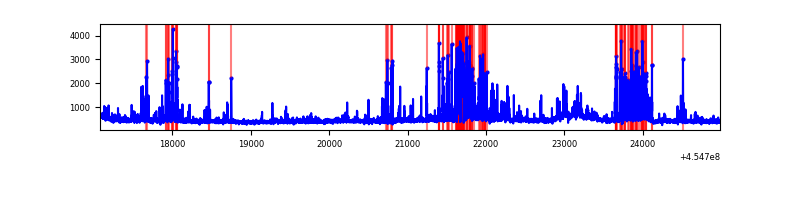 |
Top three noisy pixels from each quadrant. If the there are fewer than three noisy pixels in the level2.evt file, extra rows are filled as -1
| Pixel properties | Quadrant properties | ||||||
|---|---|---|---|---|---|---|---|
| Quadrant | DetID | PixID | Counts | Sigma | Mean | Median | Sigma |
| A | 10 | 83 | 3709801 | 20459.43 | 866 | 846 | 181.3 |
| A | 13 | 248 | 124346 | 681.25 | 866 | 846 | 181.3 |
| A | 0 | 243 | 12451 | 64.02 | 866 | 846 | 181.3 |
| B | 3 | 112 | 3177174 | 19480.56 | 830 | 804 | 163.1 |
| B | 4 | 171 | 262628 | 1605.76 | 830 | 804 | 163.1 |
| B | 0 | 198 | 66986 | 405.89 | 830 | 804 | 163.1 |
| C | 14 | 254 | 53471 | 266.53 | 847 | 848 | 197.4 |
| C | 15 | 208 | 47774 | 237.67 | 847 | 848 | 197.4 |
| C | 12 | 249 | 23789 | 116.19 | 847 | 848 | 197.4 |
| D | 13 | 249 | 647014 | 3014.61 | 841 | 812 | 214.4 |
| D | 2 | 249 | 290580 | 1351.8 | 841 | 812 | 214.4 |
| D | 1 | 52 | 139328 | 646.19 | 841 | 812 | 214.4 |
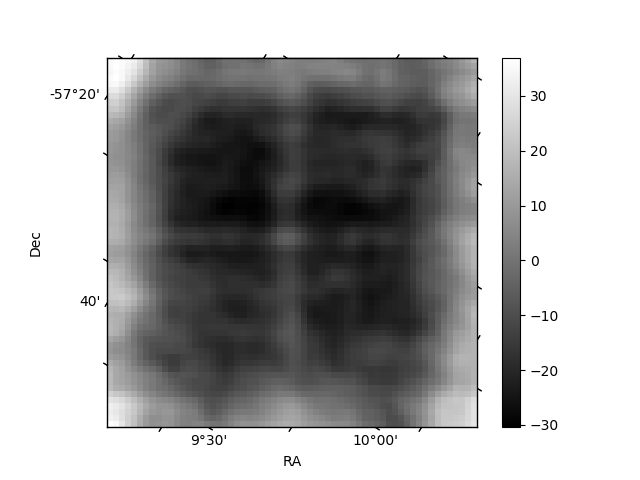
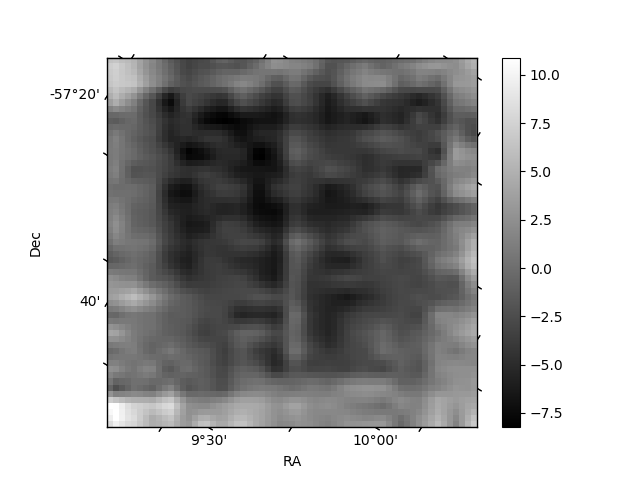
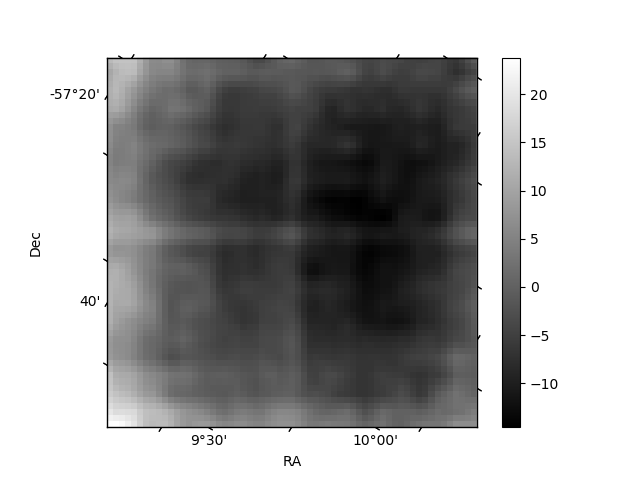
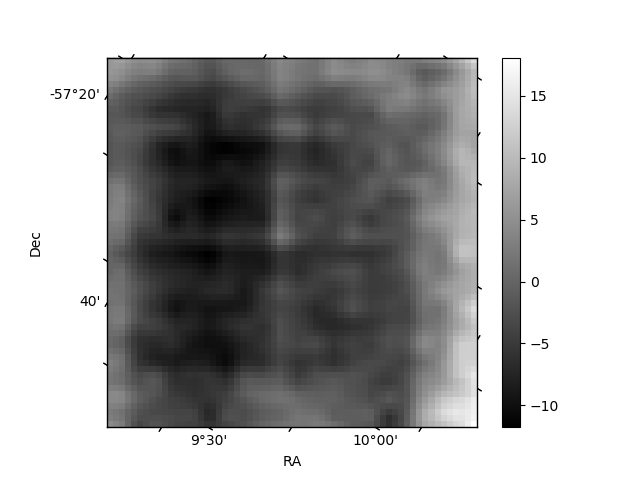
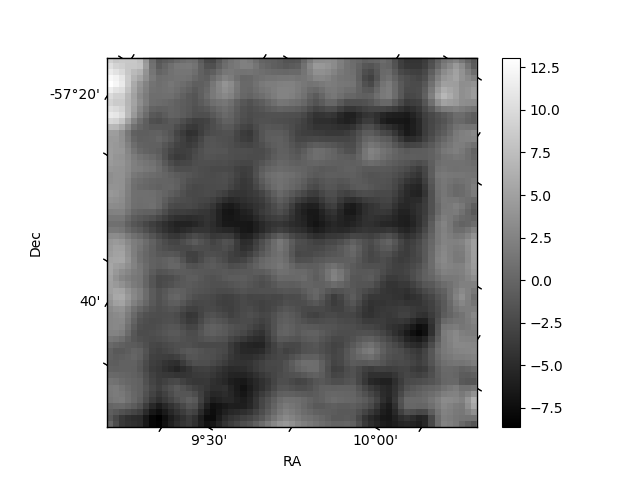
Histogram calculated using DETX and DETY for each event in the final _common_clean file
| Quadrant A | 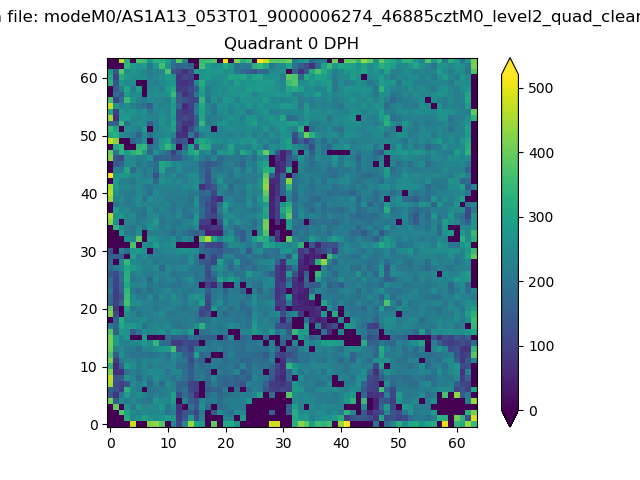 |
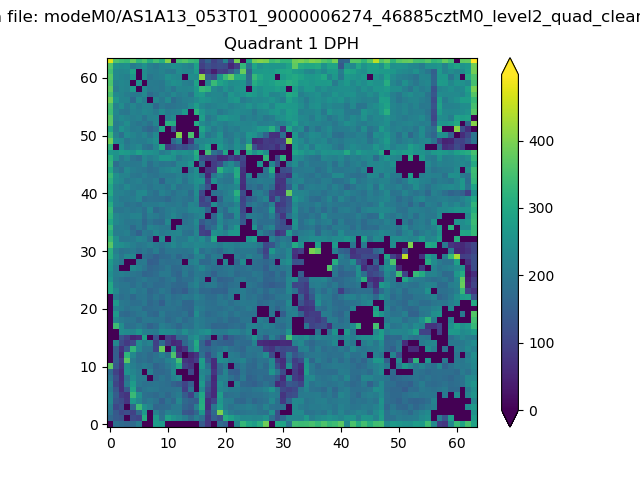 |
Quadrant B |
|---|---|---|---|
| Quadrant D | 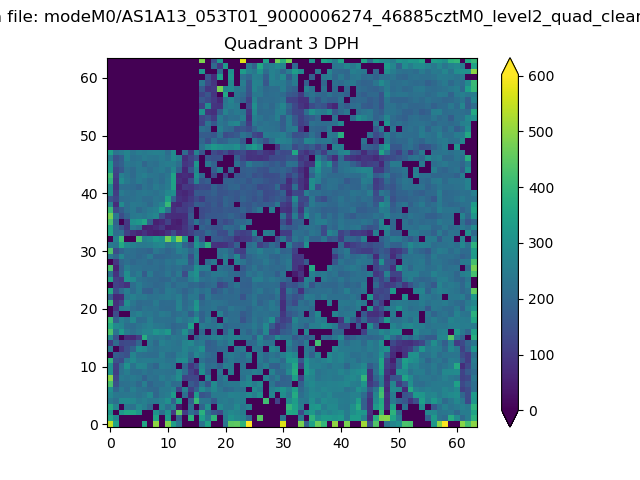 |
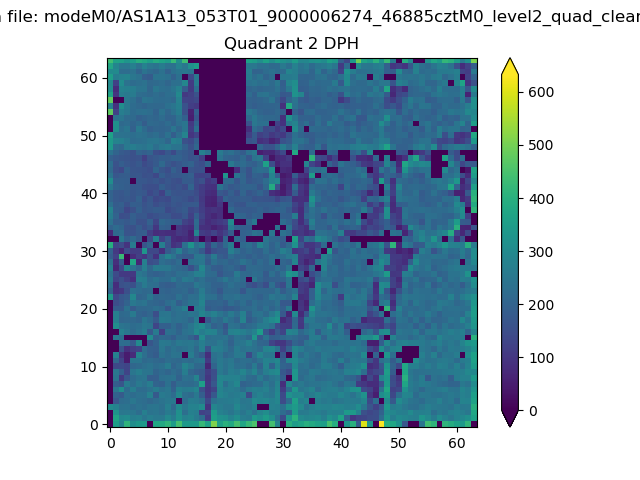 |
Quadrant C |
| Plot type | Count rate plots | Images |
|---|---|---|
| Comparison with Poisson distribution Blue bars denote a histogram of data divided into 1 sec bins. Red curve is a Poisson curve with rate = median count rate of data. |
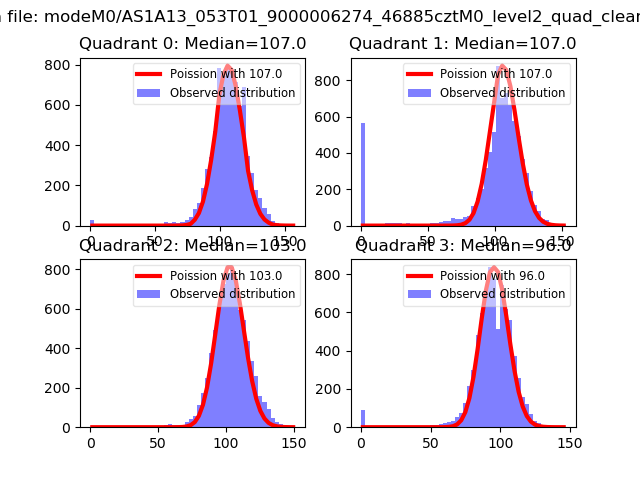 |
 |
| Quadrant-wise count rates Data is divided into 100 sec bins |
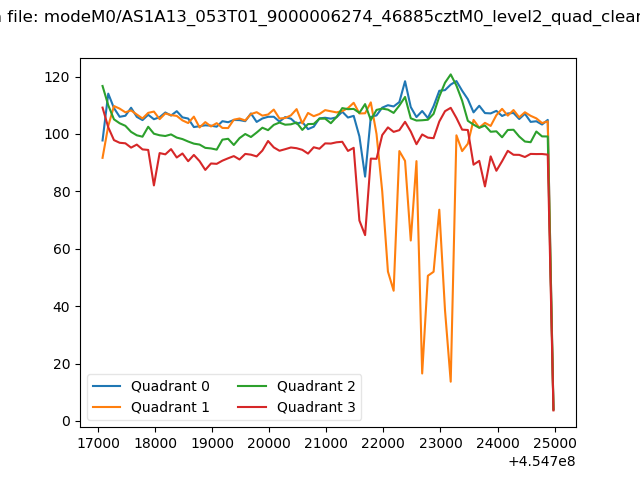 |
|
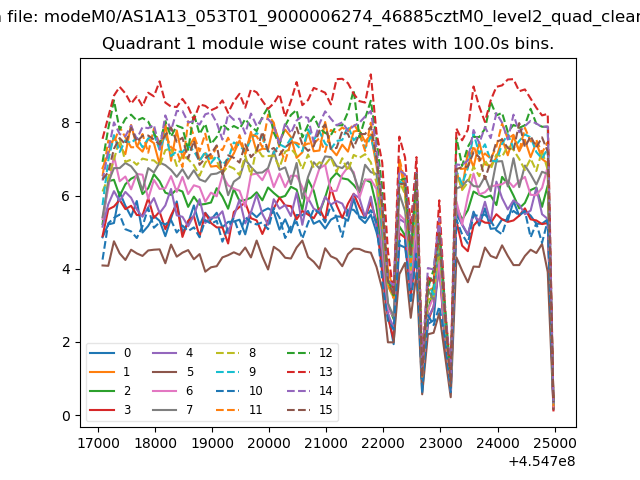
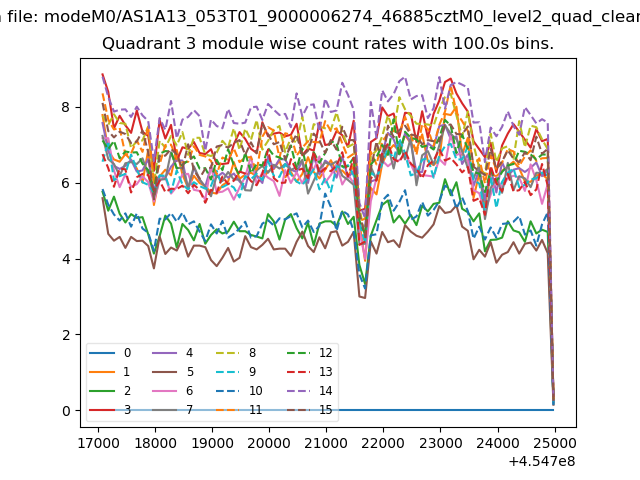
| Module-wise count rates for Quadrant A Data is divided into 100 sec bins |
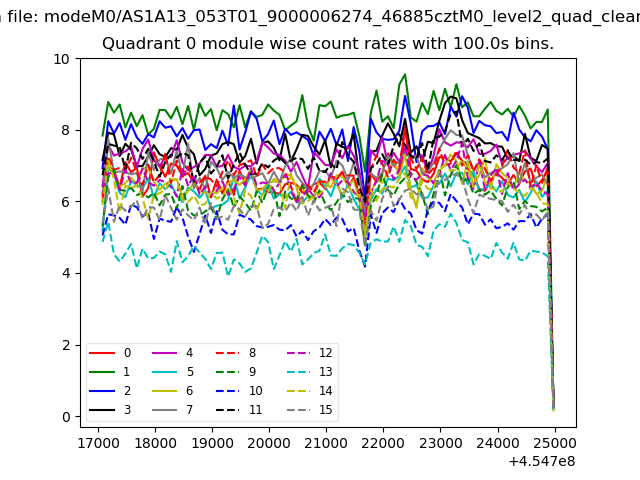 |
 |
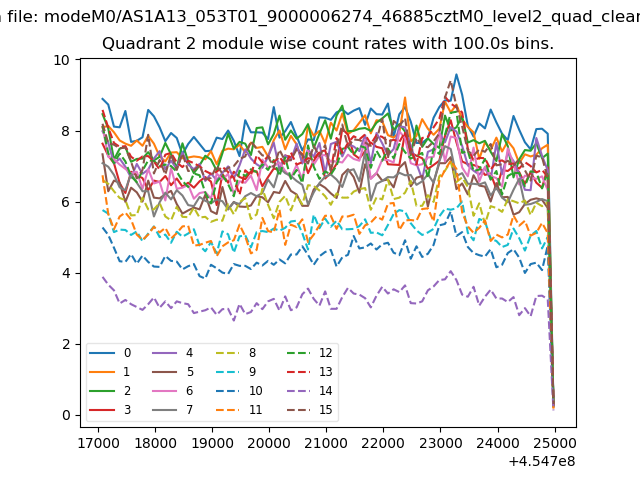
| Module-wise count rates for Quadrant B Data is divided into 100 sec bins |
 |
 |
| Module-wise count rates for Quadrant C Data is divided into 100 sec bins |
 |
 |
| Module-wise count rates for Quadrant D Data is divided into 100 sec bins |
 |
 |
| Parameter | Plot |
|---|---|
| CZT HV Monitor | 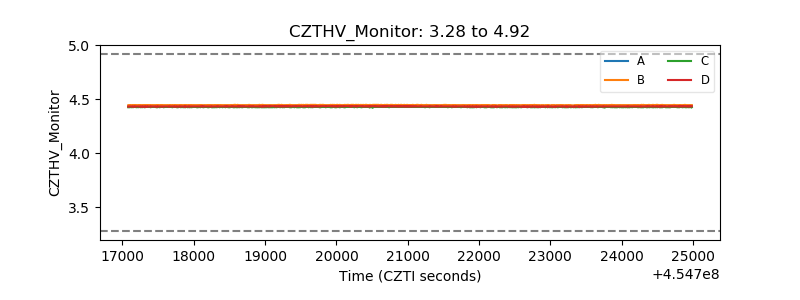 |
| D_VDD | 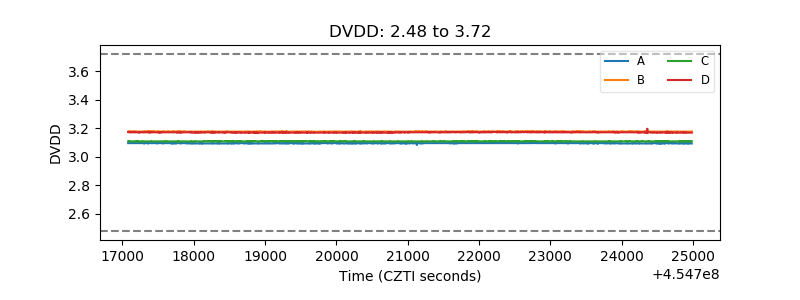 |
| Temperature 1 | 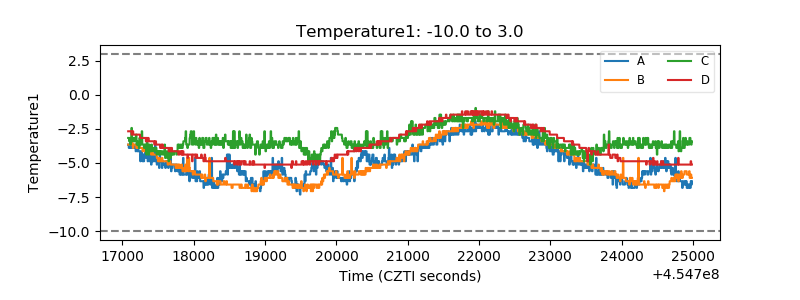 |
| Veto HV Monitor | 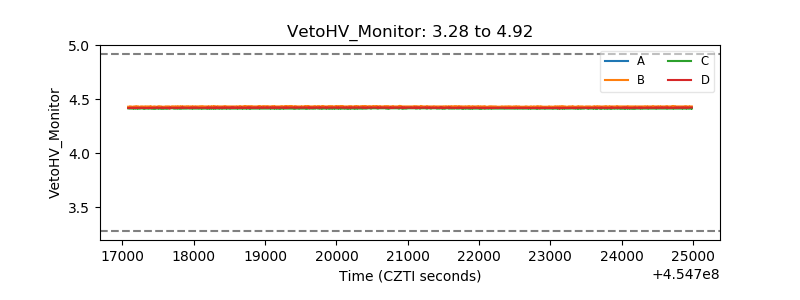 |
| Veto LLD | 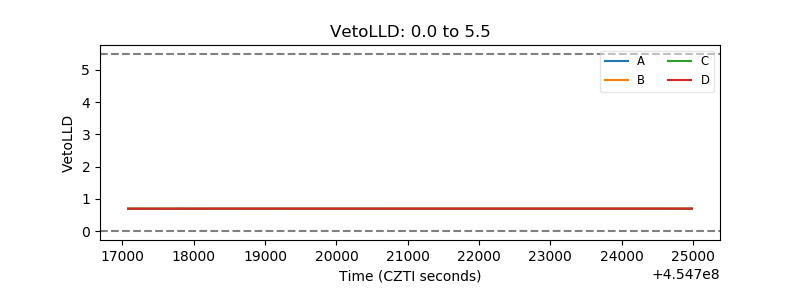 |
| Alpha Counter | 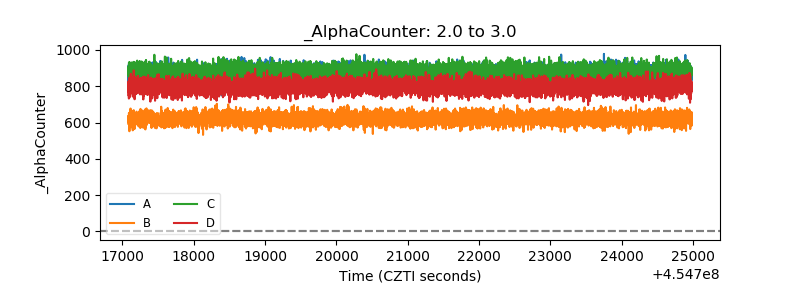 |
| _CPM_Rate | 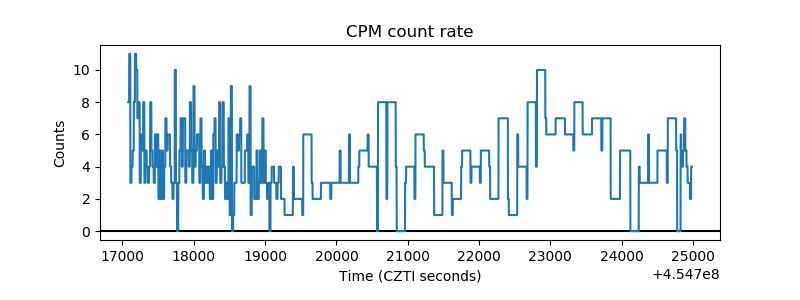 |
| CZT Counter | 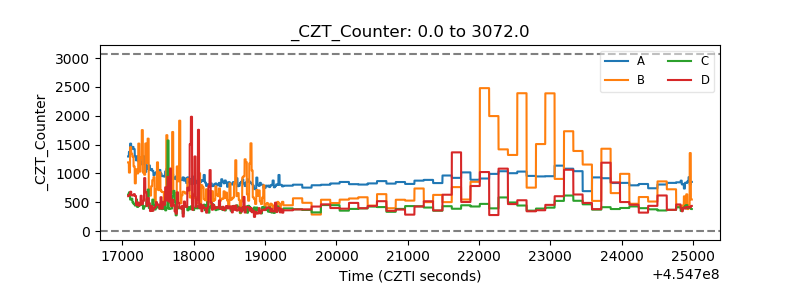 |
| +2.5 Volts monitor | 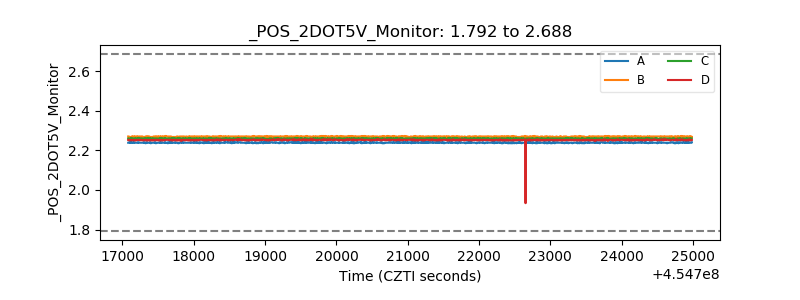 |
| +5 Volts monitor | 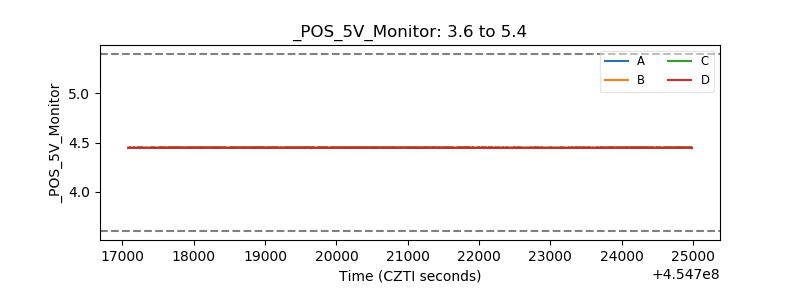 |
| _ROLL_ROT | 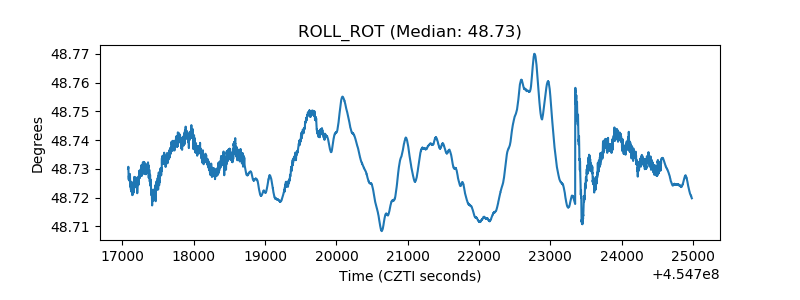 |
| _Roll_DEC | 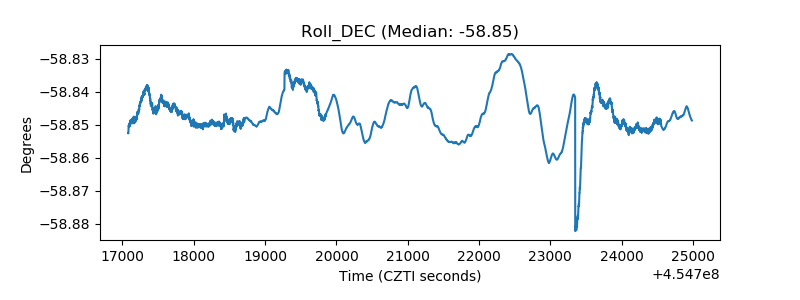 |
| _Roll_RA | 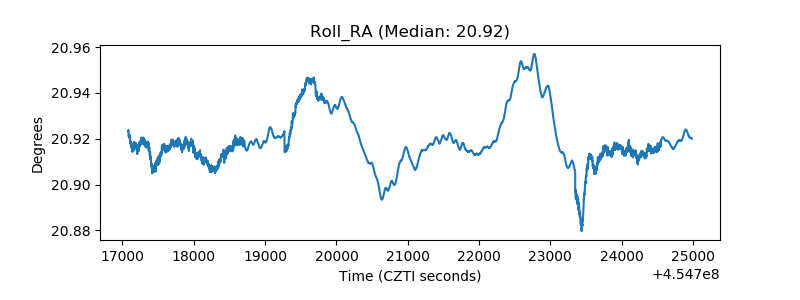 |
| Veto Counter | 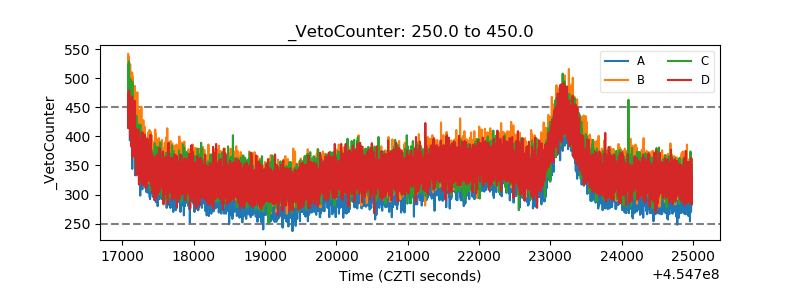 |