| Param | Original file | Final file |
|---|---|---|
| Filename | modeM0/AS1A13_068T05_9000006280_46904cztM0_level2.fits | modeM0/AS1A13_068T05_9000006280_46904cztM0_level2_quad_clean.evt |
| Size (bytes) | 638,752,320 | 109,157,760 |
| Size | 609.2 MB | 104.1 MB |
| Events in quadrant A | 6,649,887 | 728,826 |
| Events in quadrant B | 7,437,366 | 721,323 |
| Events in quadrant C | 3,171,507 | 738,017 |
| Events in quadrant D | 5,836,796 | 621,984 |
| Mode SS | |||
|---|---|---|---|
| Quadrant | BADHDUFLAG | Total packets | Discarded packets |
| A | 0 | 146 | 0 |
| B | 0 | 146 | 0 |
| C | 0 | 146 | 0 |
| D | 0 | 146 | 0 |
| Mode M9 | |||
|---|---|---|---|
| Quadrant | BADHDUFLAG | Total packets | Discarded packets |
| A | 0 | 10 | 0 |
| B | 0 | 10 | 0 |
| C | 0 | 11 | 0 |
| D | 0 | 11 | 0 |
| Mode M0 | |||
|---|---|---|---|
| Quadrant | BADHDUFLAG | Total packets | Discarded packets |
| A | 0 | 23948 | 2 |
| B | 0 | 27141 | 2 |
| C | 0 | 14569 | 2 |
| D | 0 | 22305 | 9 |
| Quadrant | Total seconds | Saturated seconds | Saturation percentage |
|---|---|---|---|
| A | 7096 | 268 | 3.776776% |
| B | 7096 | 805 | 11.344419% |
| C | 7096 | 55 | 0.775085% |
| D | 7094 | 761 | 10.727375% |
Noise dominated data is calculated using 1-second bins in cleaned event files. If a bin has >2000 counts, and if more than 50% of those come from <1% of pixels, then it is considered to be noise-dominated and hence unusable.
| Quadrant | # 1 sec bins | Bins with >0 counts | Bins with >2000 counts | High rate bins dominated by noise | Noise dominated (total time) | Noise dominated (detector-on time) | Marked lightcurve |
|---|---|---|---|---|---|---|---|
| A | 7841 | 7096 | 20 | 20 | 0.26% | 0.28% | 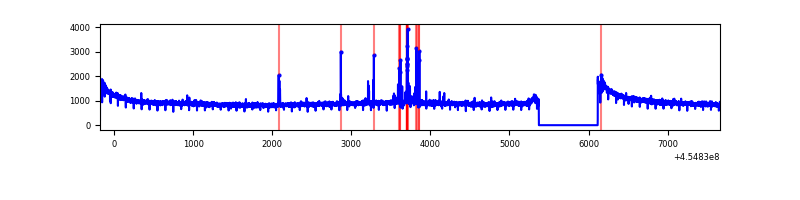 |
| B | 7841 | 7096 | 442 | 442 | 5.64% | 6.23% | 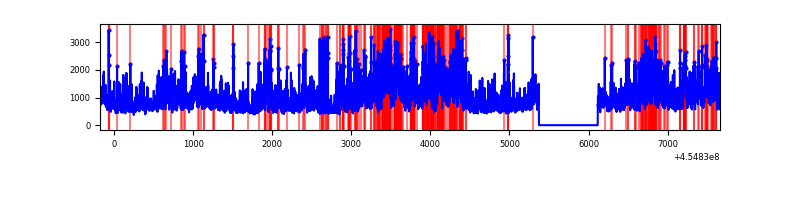 |
| C | 7841 | 7096 | 4 | 4 | 0.05% | 0.06% | 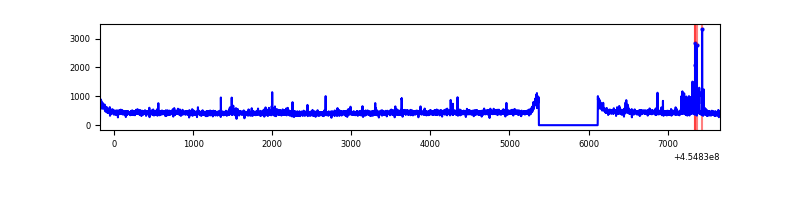 |
| D | 7840 | 7095 | 610 | 610 | 7.78% | 8.60% | 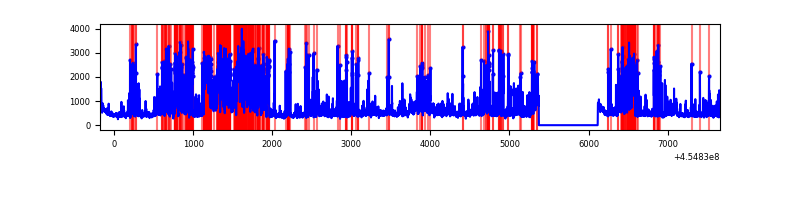 |
Top three noisy pixels from each quadrant. If the there are fewer than three noisy pixels in the level2.evt file, extra rows are filled as -1
| Pixel properties | Quadrant properties | ||||||
|---|---|---|---|---|---|---|---|
| Quadrant | DetID | PixID | Counts | Sigma | Mean | Median | Sigma |
| A | 10 | 83 | 3501312 | 21243.03 | 790 | 771 | 164.8 |
| A | 13 | 248 | 87338 | 525.33 | 790 | 771 | 164.8 |
| A | 7 | 3 | 10491 | 58.99 | 790 | 771 | 164.8 |
| B | 3 | 112 | 4118111 | 26740.72 | 773 | 747 | 154.0 |
| B | 5 | 255 | 174351 | 1127.49 | 773 | 747 | 154.0 |
| B | 0 | 245 | 28362 | 179.35 | 773 | 747 | 154.0 |
| C | 14 | 254 | 58022 | 309.91 | 784 | 788 | 184.7 |
| C | 15 | 208 | 45467 | 241.93 | 784 | 788 | 184.7 |
| C | 3 | 233 | 7285 | 35.18 | 784 | 788 | 184.7 |
| D | 13 | 249 | 2167995 | 11392.89 | 752 | 730 | 190.2 |
| D | 1 | 52 | 209467 | 1097.29 | 752 | 730 | 190.2 |
| D | 2 | 249 | 202334 | 1059.79 | 752 | 730 | 190.2 |
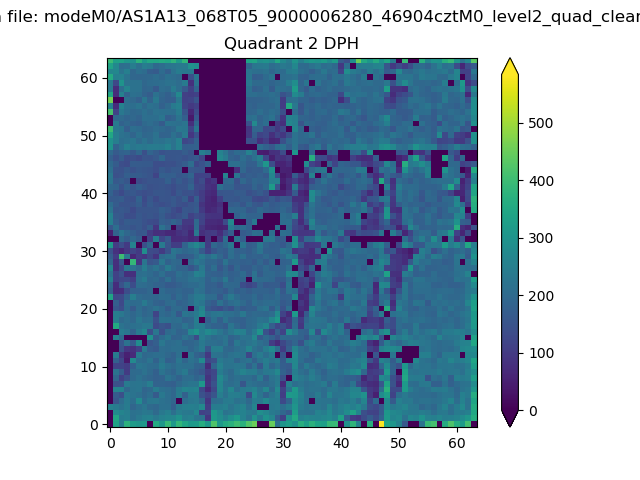
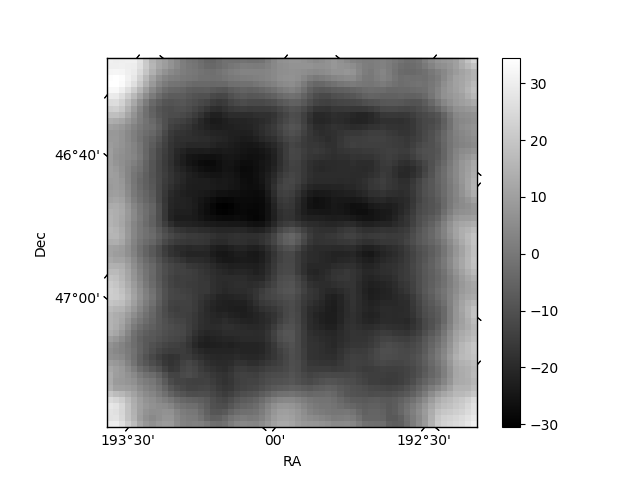
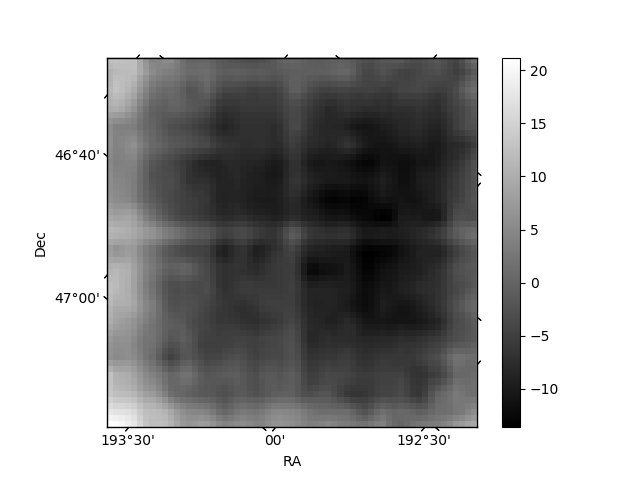
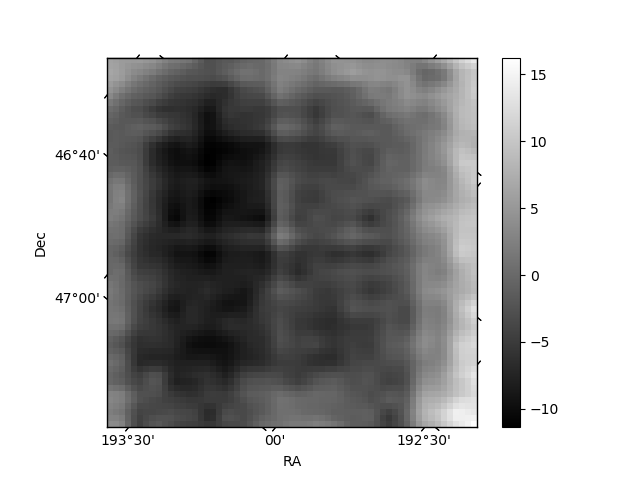
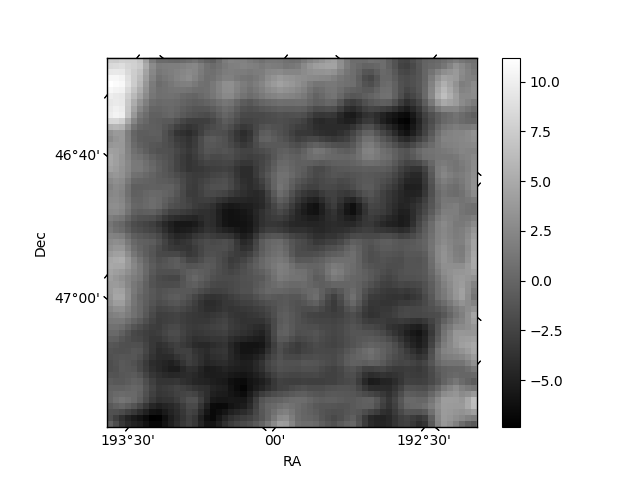
Histogram calculated using DETX and DETY for each event in the final _common_clean file
| Quadrant A | 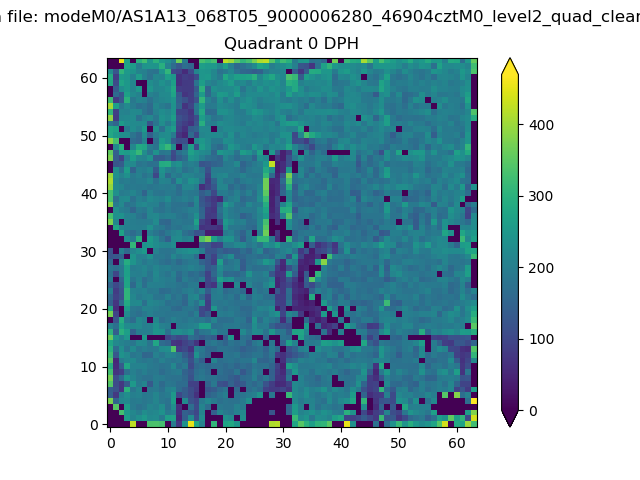 |
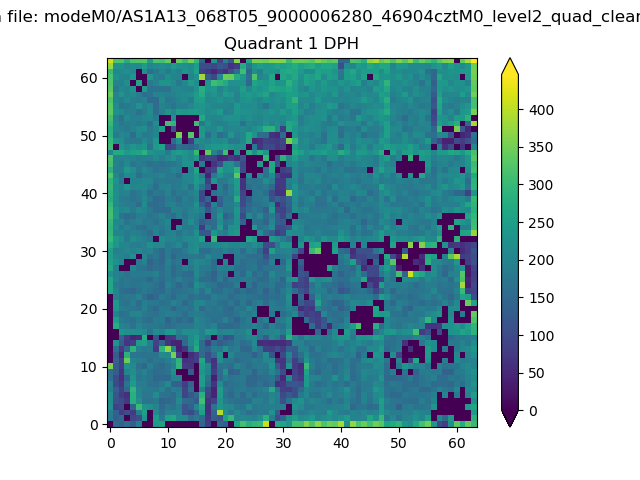 |
Quadrant B |
|---|---|---|---|
| Quadrant D | 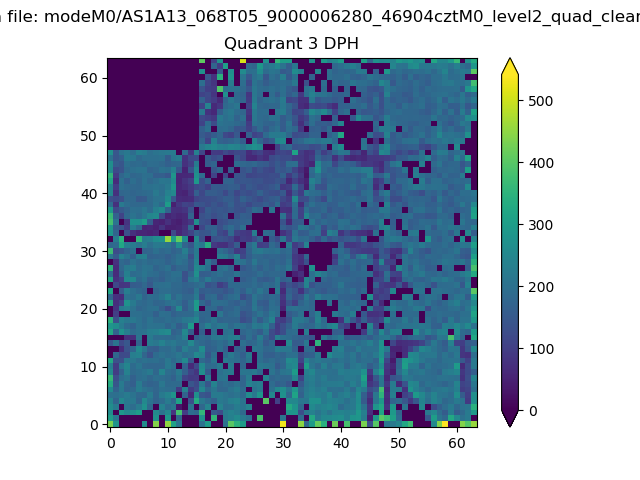 |
 |
Quadrant C |
| Plot type | Count rate plots | Images |
|---|---|---|
| Comparison with Poisson distribution Blue bars denote a histogram of data divided into 1 sec bins. Red curve is a Poisson curve with rate = median count rate of data. |
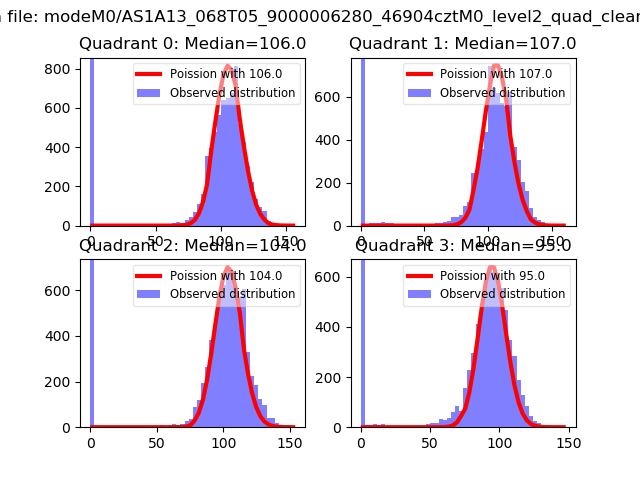 |
 |
| Quadrant-wise count rates Data is divided into 100 sec bins |
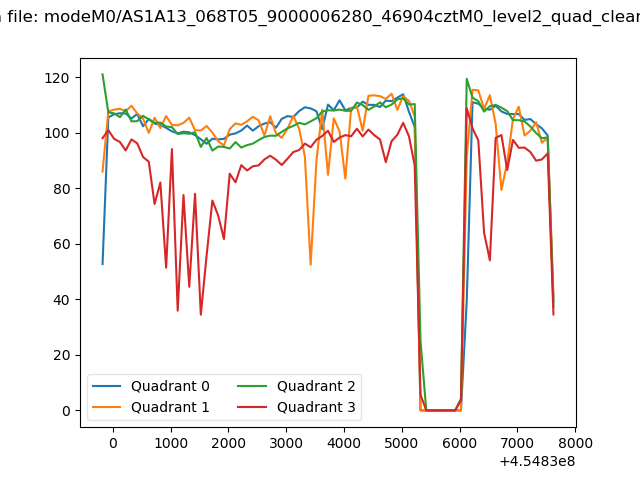 |
|
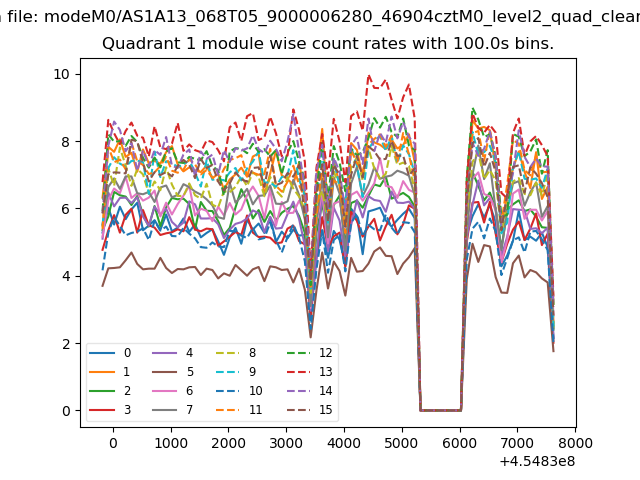
| Module-wise count rates for Quadrant A Data is divided into 100 sec bins |
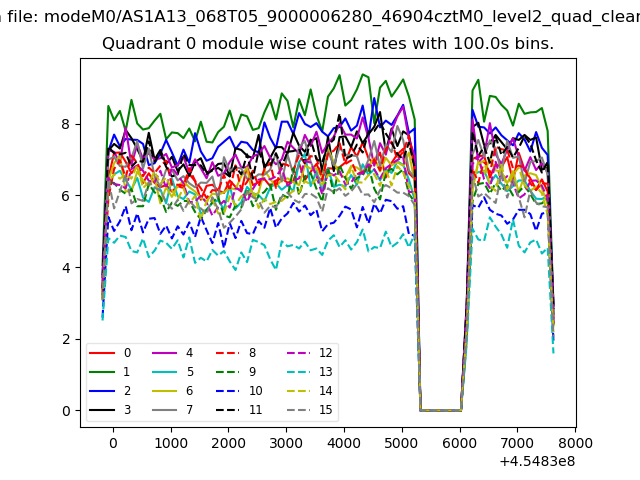 |
 |
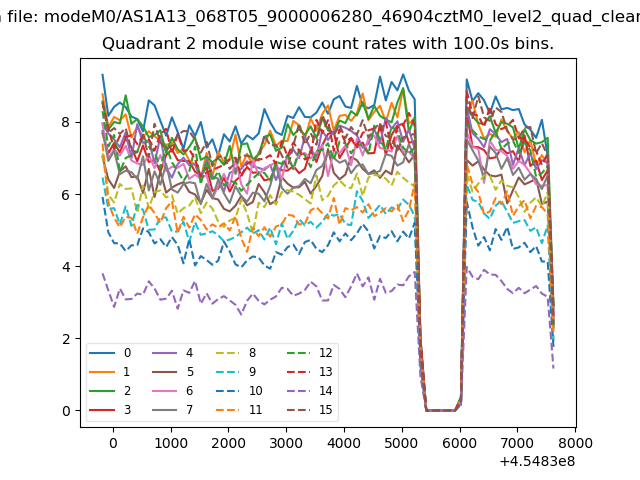
| Module-wise count rates for Quadrant B Data is divided into 100 sec bins |
 |
 |
| Module-wise count rates for Quadrant C Data is divided into 100 sec bins |
 |
 |
| Module-wise count rates for Quadrant D Data is divided into 100 sec bins |
 |
 |
| Parameter | Plot |
|---|---|
| CZT HV Monitor | 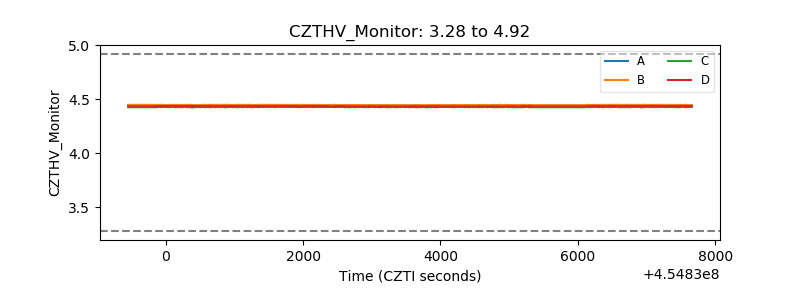 |
| D_VDD | 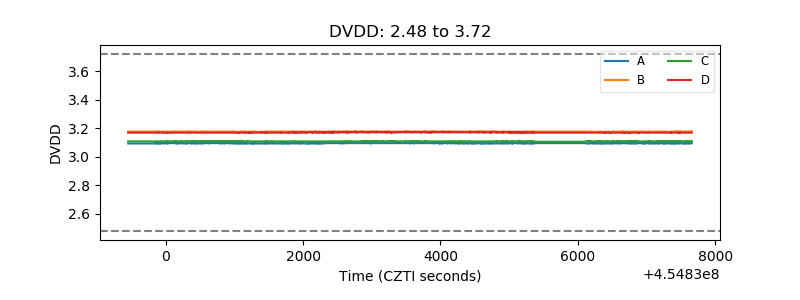 |
| Temperature 1 | 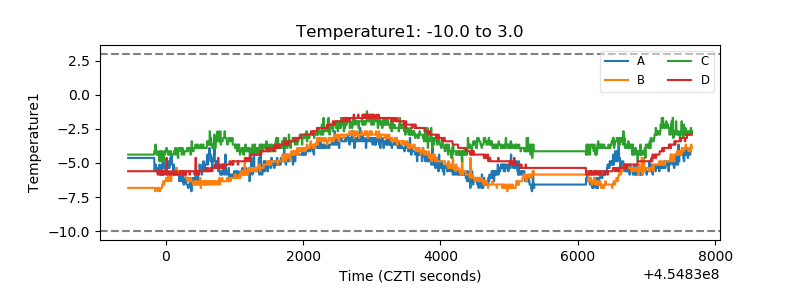 |
| Veto HV Monitor | 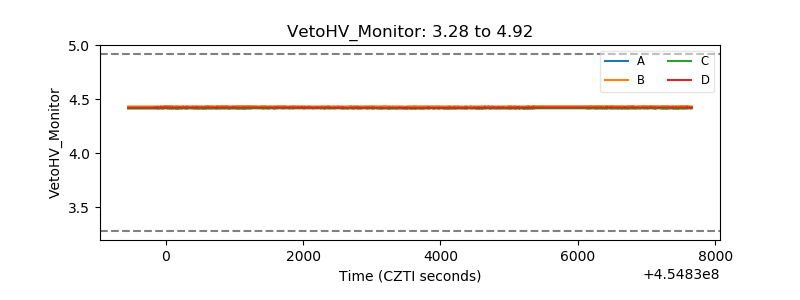 |
| Veto LLD | 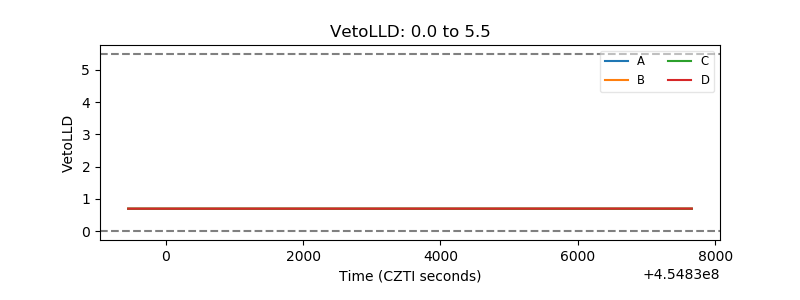 |
| Alpha Counter | 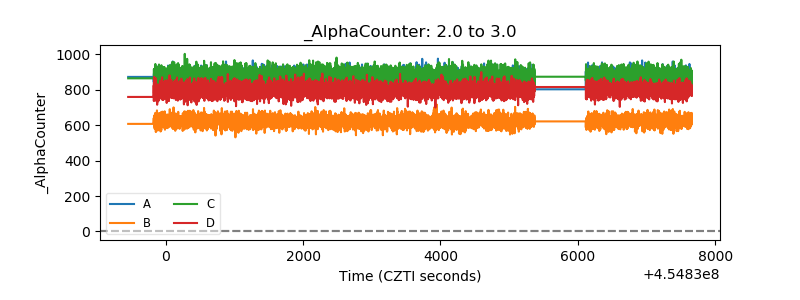 |
| _CPM_Rate | 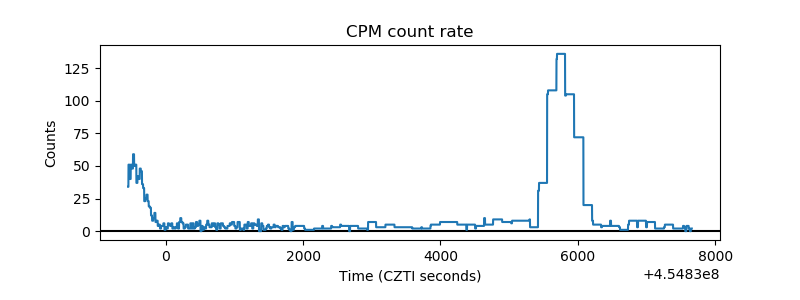 |
| CZT Counter | 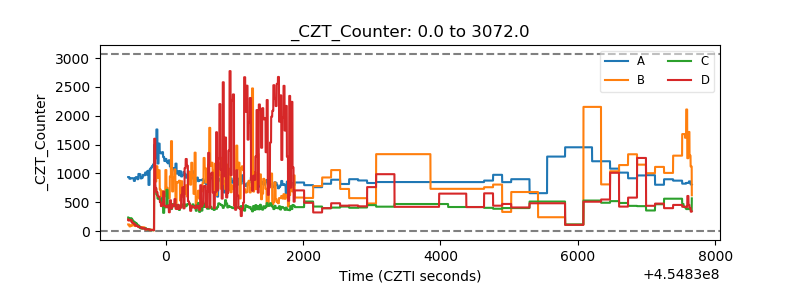 |
| +2.5 Volts monitor | 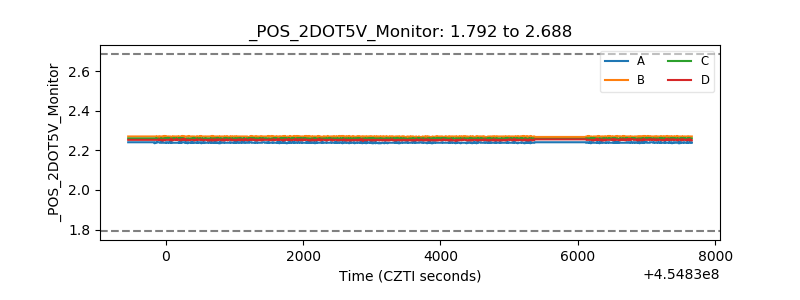 |
| +5 Volts monitor | 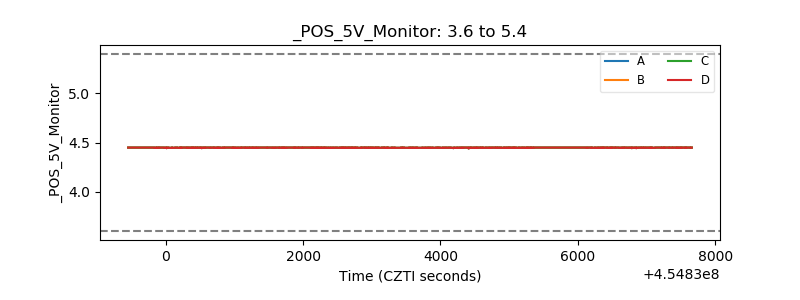 |
| _ROLL_ROT | 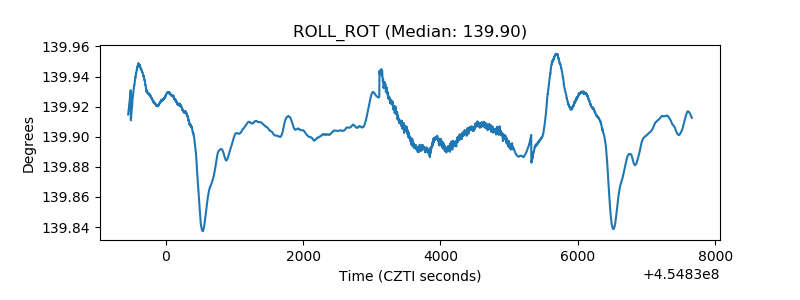 |
| _Roll_DEC | 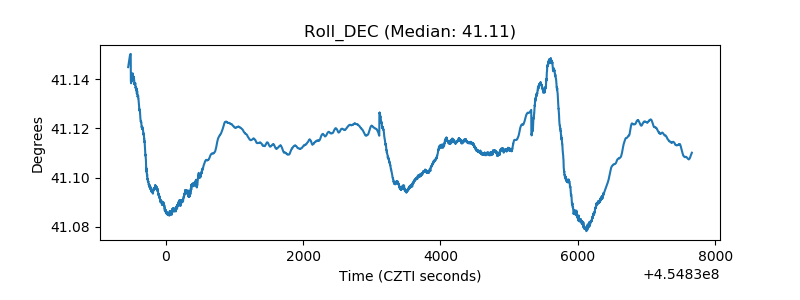 |
| _Roll_RA | 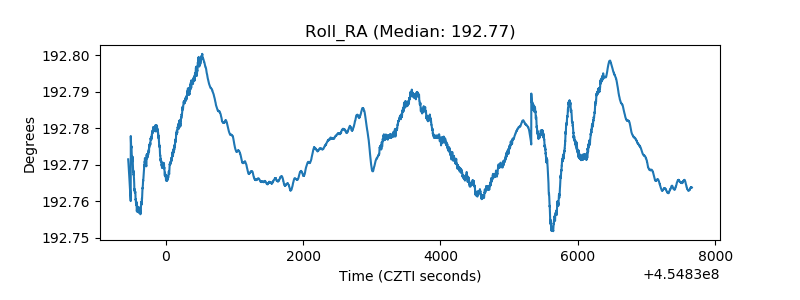 |
| Veto Counter | 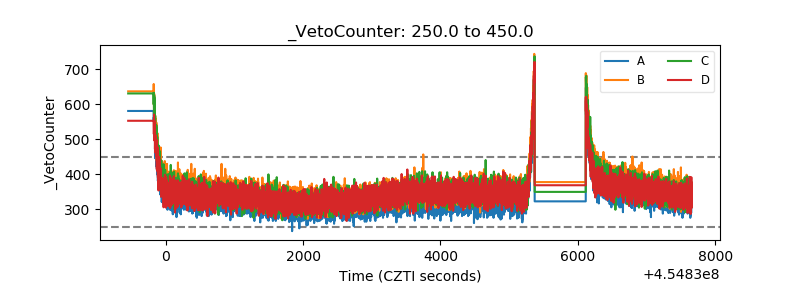 |