| Param | Original file | Final file |
|---|---|---|
| Filename | modeM0/AS1A13_074T06_9000006284_46923cztM0_level2.fits | modeM0/AS1A13_074T06_9000006284_46923cztM0_level2_quad_clean.evt |
| Size (bytes) | 510,131,520 | 97,280,640 |
| Size | 486.5 MB | 92.8 MB |
| Events in quadrant A | 5,643,027 | 662,592 |
| Events in quadrant B | 6,074,549 | 646,532 |
| Events in quadrant C | 2,671,787 | 645,452 |
| Events in quadrant D | 4,043,553 | 584,100 |
| Mode M9 | |||
|---|---|---|---|
| Quadrant | BADHDUFLAG | Total packets | Discarded packets |
| A | 0 | 11 | 0 |
| B | 0 | 11 | 0 |
| C | 0 | 11 | 0 |
| D | 0 | 11 | 0 |
| Mode M0 | |||
|---|---|---|---|
| Quadrant | BADHDUFLAG | Total packets | Discarded packets |
| A | 0 | 20618 | 1 |
| B | 0 | 22206 | 1 |
| C | 0 | 12226 | 1 |
| D | 0 | 16191 | 1 |
| Mode SS | |||
|---|---|---|---|
| Quadrant | BADHDUFLAG | Total packets | Discarded packets |
| A | 0 | 120 | 0 |
| B | 0 | 120 | 0 |
| C | 0 | 120 | 0 |
| D | 0 | 120 | 0 |
| Quadrant | Total seconds | Saturated seconds | Saturation percentage |
|---|---|---|---|
| A | 5816 | 216 | 3.713893% |
| B | 5817 | 504 | 8.664260% |
| C | 5817 | 62 | 1.065841% |
| D | 5817 | 291 | 5.002579% |
Noise dominated data is calculated using 1-second bins in cleaned event files. If a bin has >2000 counts, and if more than 50% of those come from <1% of pixels, then it is considered to be noise-dominated and hence unusable.
| Quadrant | # 1 sec bins | Bins with >0 counts | Bins with >2000 counts | High rate bins dominated by noise | Noise dominated (total time) | Noise dominated (detector-on time) | Marked lightcurve |
|---|---|---|---|---|---|---|---|
| A | 6971 | 5816 | 17 | 17 | 0.24% | 0.29% | 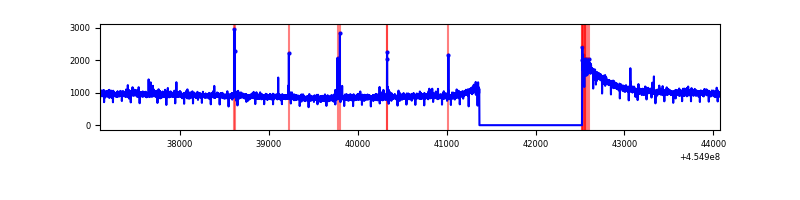 |
| B | 6972 | 5817 | 223 | 223 | 3.20% | 3.83% | 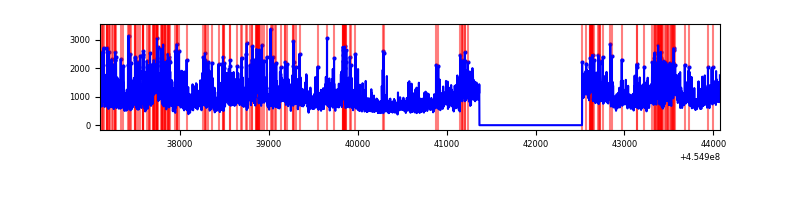 |
| C | 6972 | 5818 | 20 | 20 | 0.29% | 0.34% | 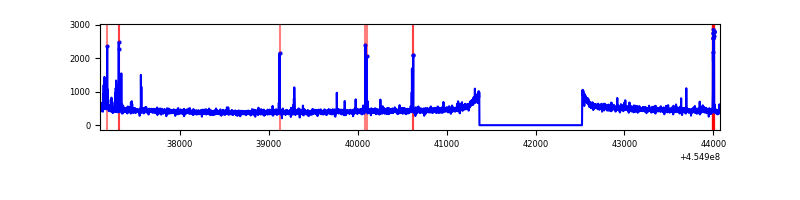 |
| D | 6972 | 5817 | 216 | 216 | 3.10% | 3.71% | 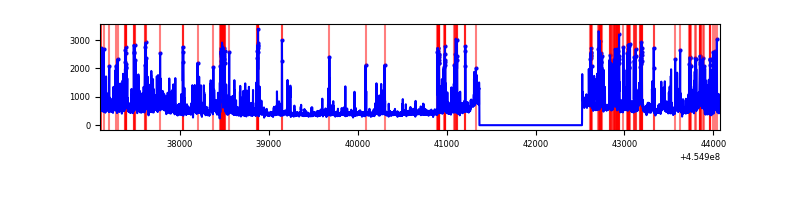 |
Top three noisy pixels from each quadrant. If the there are fewer than three noisy pixels in the level2.evt file, extra rows are filled as -1
| Pixel properties | Quadrant properties | ||||||
|---|---|---|---|---|---|---|---|
| Quadrant | DetID | PixID | Counts | Sigma | Mean | Median | Sigma |
| A | 10 | 83 | 2996528 | 21502.01 | 672 | 659 | 139.3 |
| A | 13 | 248 | 28084 | 196.84 | 672 | 659 | 139.3 |
| A | 7 | 3 | 11893 | 80.63 | 672 | 659 | 139.3 |
| B | 3 | 112 | 3166544 | 24732.16 | 651 | 631 | 128.0 |
| B | 15 | 36 | 99215 | 770.14 | 651 | 631 | 128.0 |
| B | 0 | 198 | 97084 | 753.49 | 651 | 631 | 128.0 |
| C | 14 | 254 | 116229 | 745.8 | 651 | 655 | 155.0 |
| C | 1 | 3 | 6498 | 37.7 | 651 | 655 | 155.0 |
| C | 3 | 233 | 5733 | 32.77 | 651 | 655 | 155.0 |
| D | 1 | 52 | 431196 | 2657.1 | 648 | 629 | 162.0 |
| D | 13 | 249 | 426224 | 2626.42 | 648 | 629 | 162.0 |
| D | 2 | 249 | 187675 | 1154.29 | 648 | 629 | 162.0 |
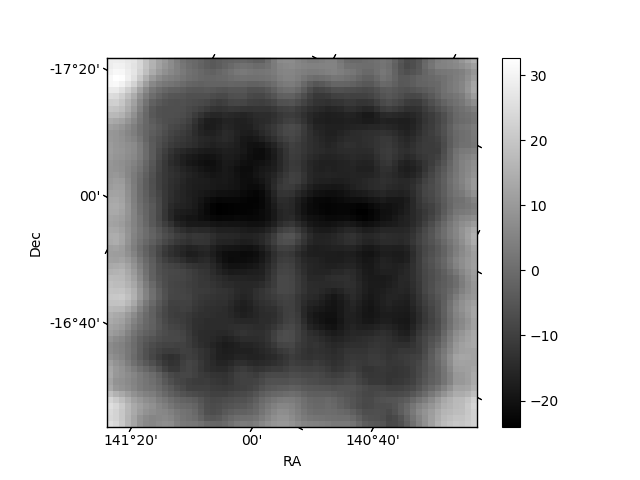
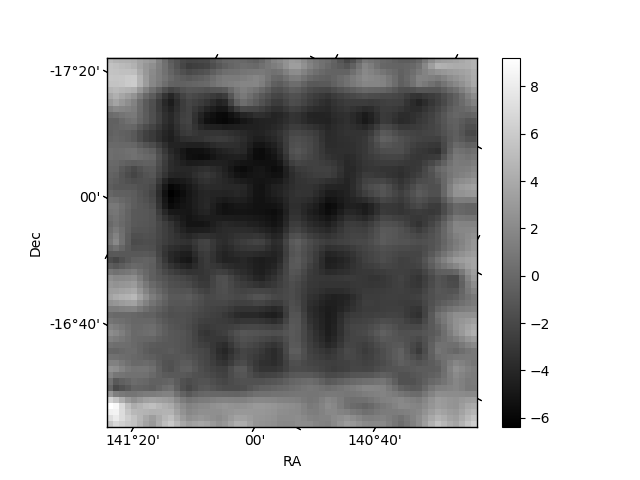
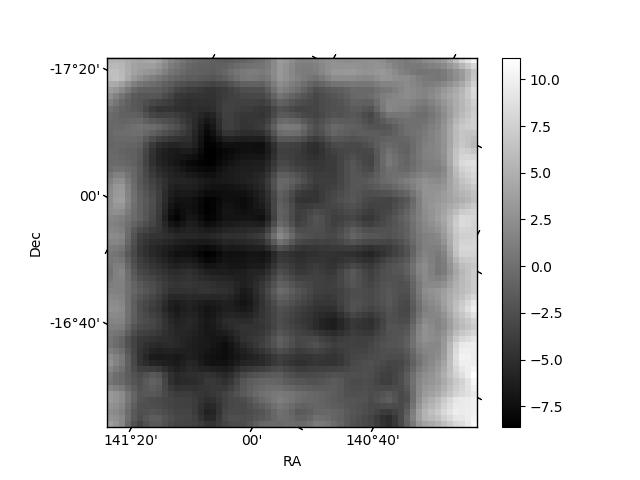
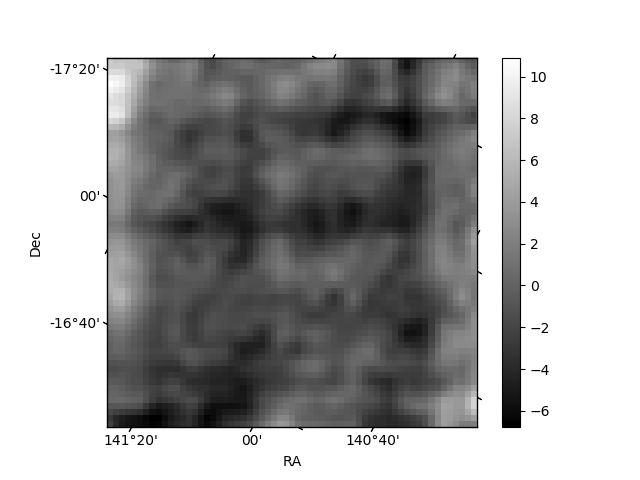
Histogram calculated using DETX and DETY for each event in the final _common_clean file
| Quadrant A | 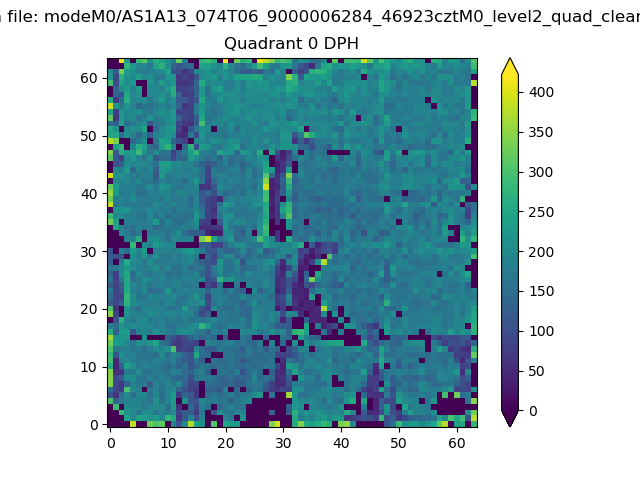 |
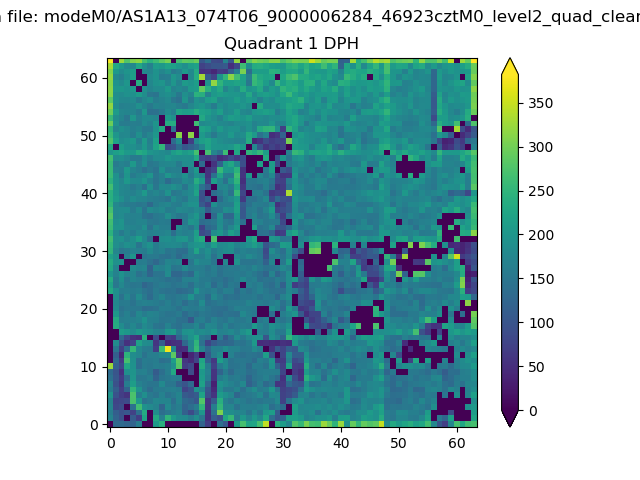 |
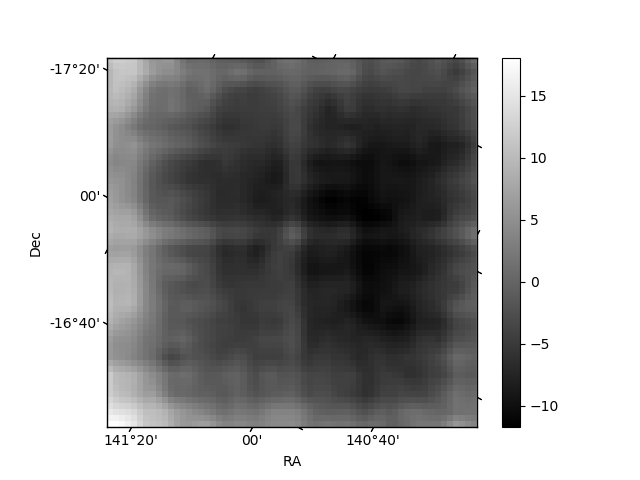
Quadrant B |
|---|---|---|---|
| Quadrant D | 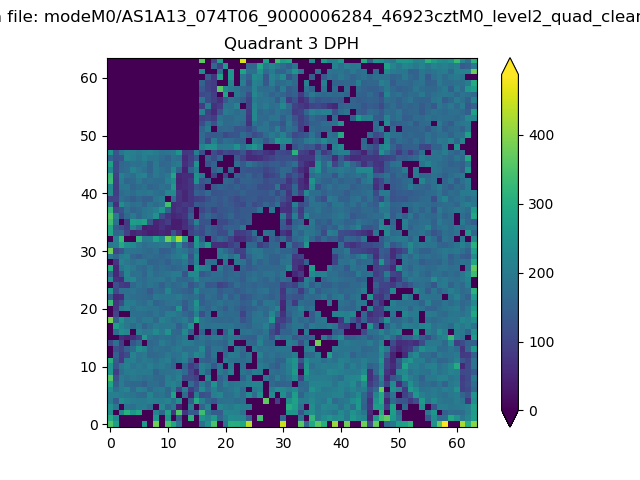 |
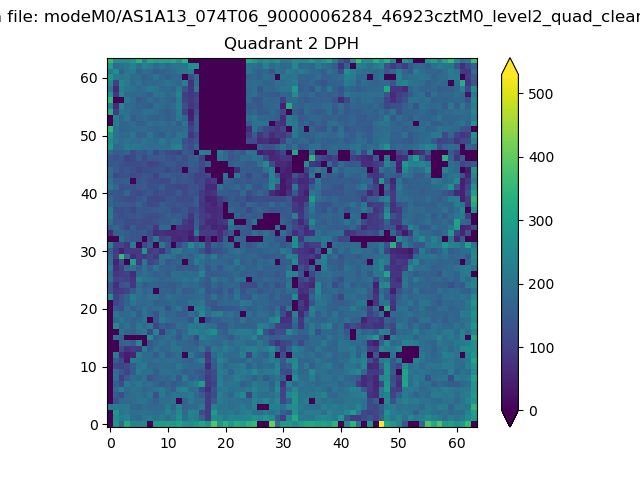 |
Quadrant C |
| Plot type | Count rate plots | Images |
|---|---|---|
| Comparison with Poisson distribution Blue bars denote a histogram of data divided into 1 sec bins. Red curve is a Poisson curve with rate = median count rate of data. |
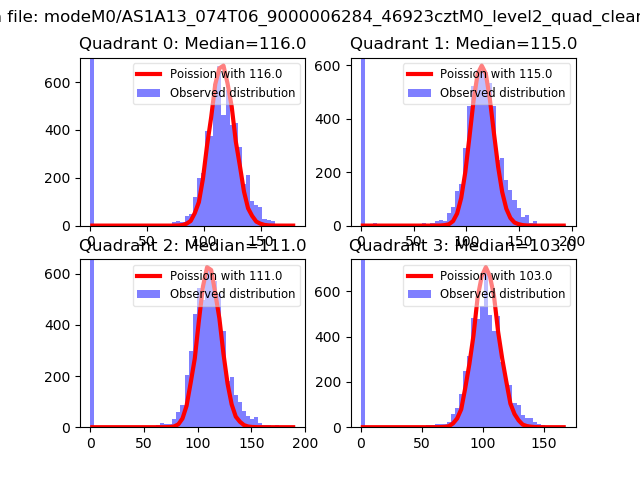 |
 |
| Quadrant-wise count rates Data is divided into 100 sec bins |
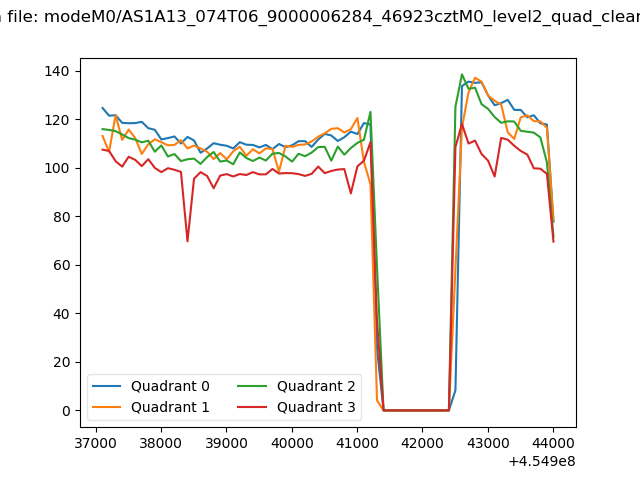 |
|
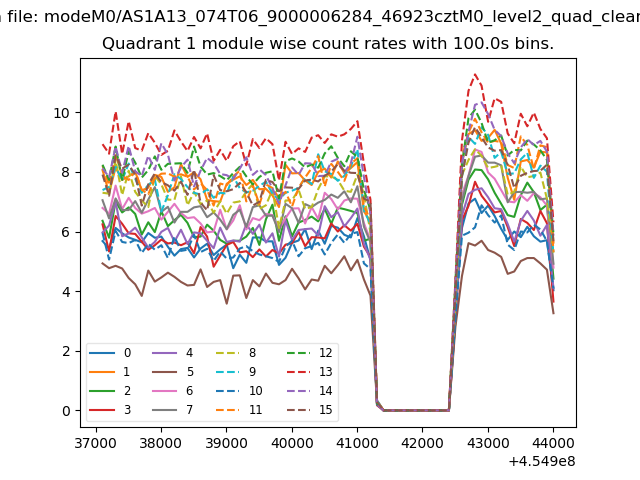
| Module-wise count rates for Quadrant A Data is divided into 100 sec bins |
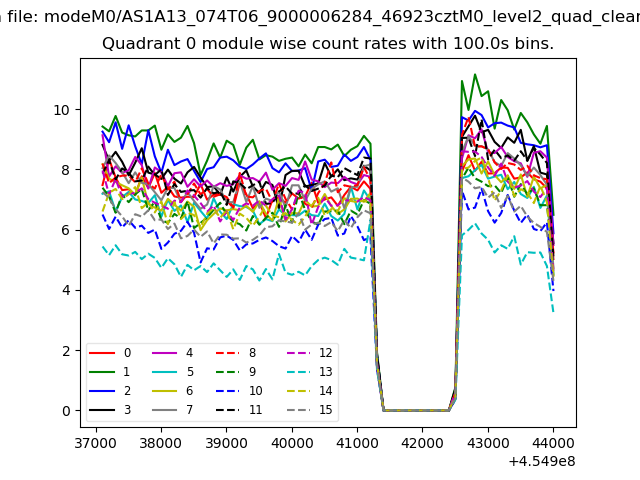 |
 |
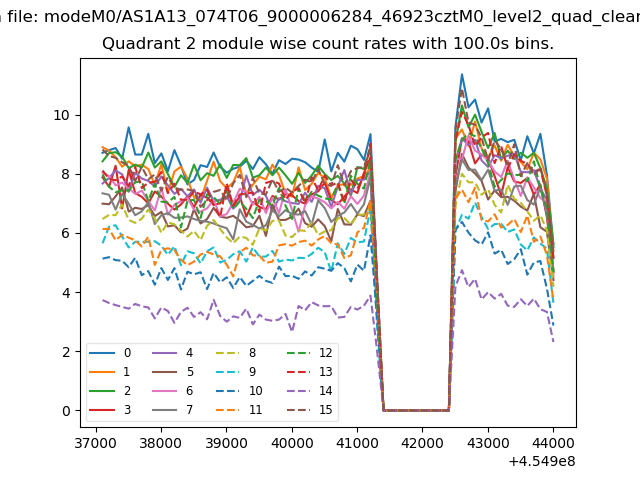
| Module-wise count rates for Quadrant B Data is divided into 100 sec bins |
 |
 |
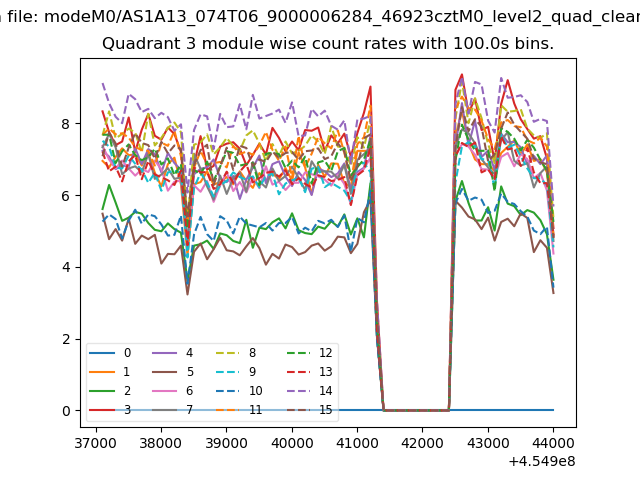
| Module-wise count rates for Quadrant C Data is divided into 100 sec bins |
 |
 |
| Module-wise count rates for Quadrant D Data is divided into 100 sec bins |
 |
 |
| Parameter | Plot |
|---|---|
| CZT HV Monitor | 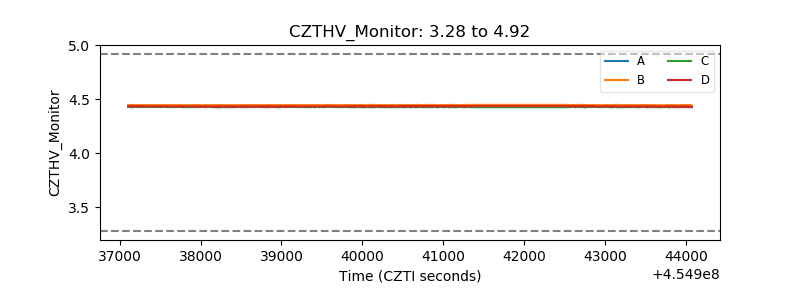 |
| D_VDD |  |
| Temperature 1 | 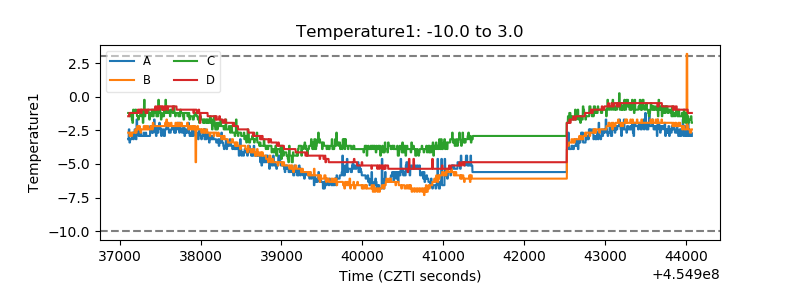 |
| Veto HV Monitor | 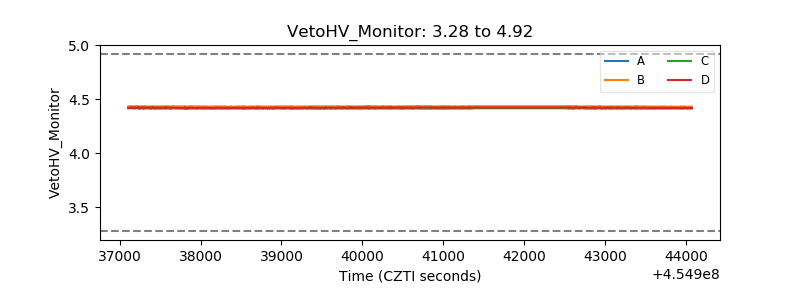 |
| Veto LLD | 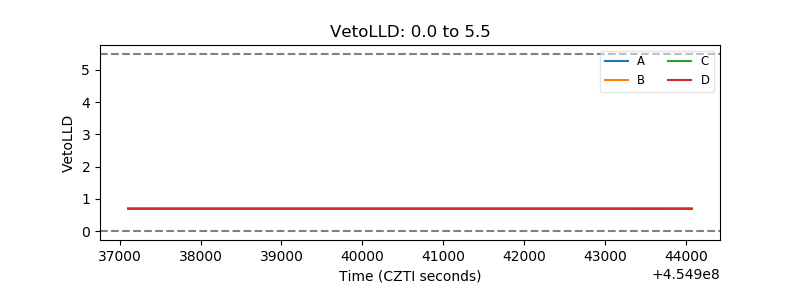 |
| Alpha Counter | 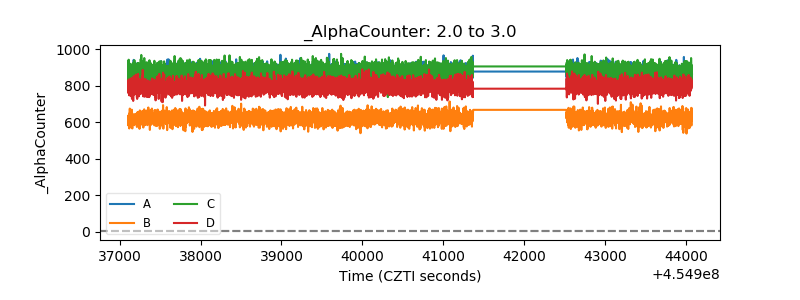 |
| _CPM_Rate | 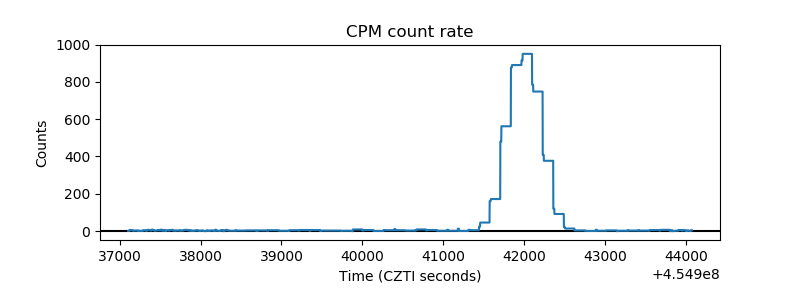 |
| CZT Counter | 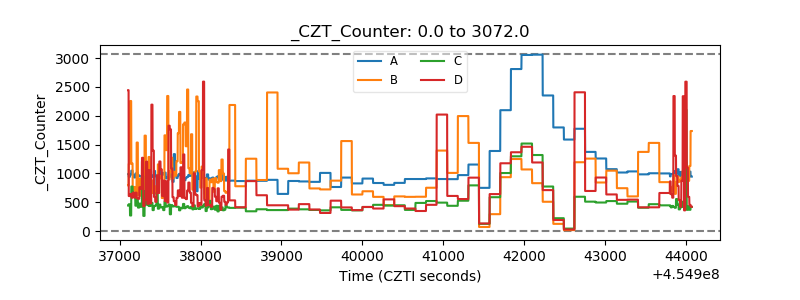 |
| +2.5 Volts monitor | 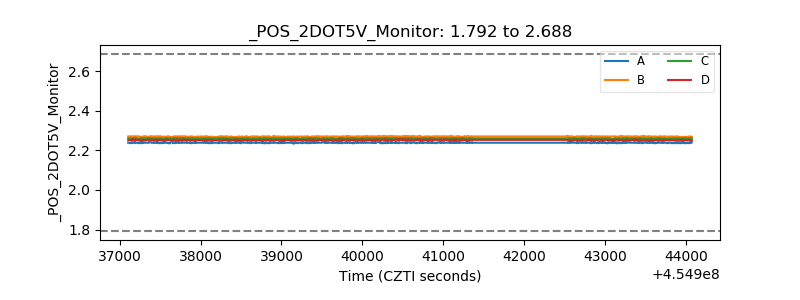 |
| +5 Volts monitor | 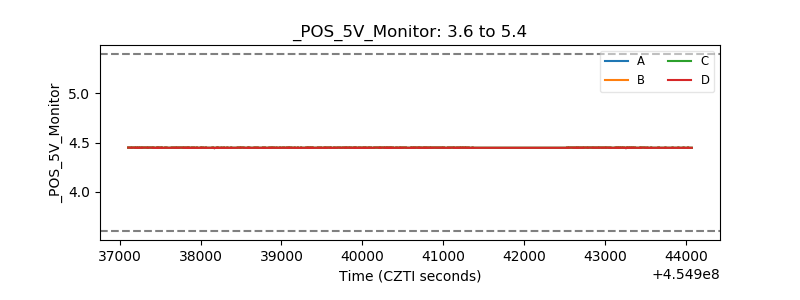 |
| _ROLL_ROT | 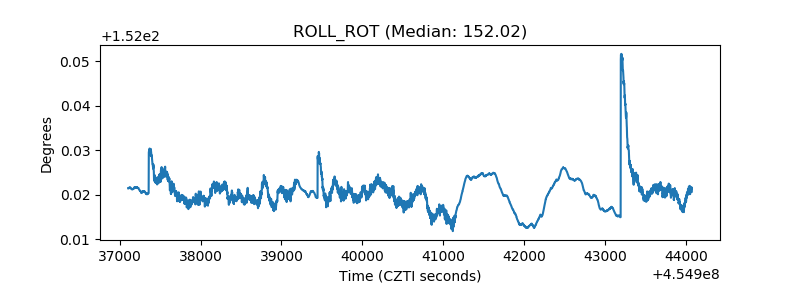 |
| _Roll_DEC | 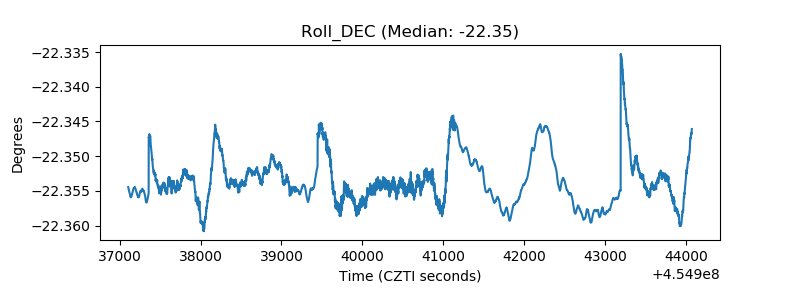 |
| _Roll_RA | 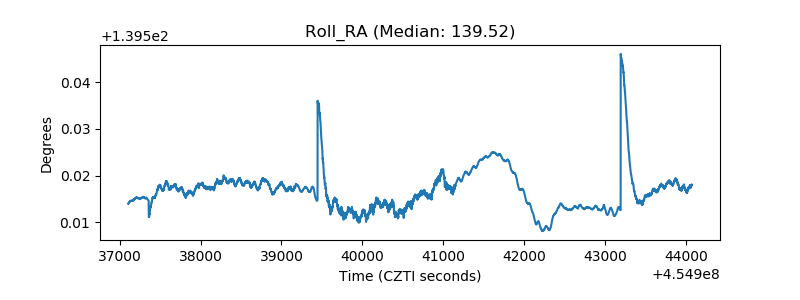 |
| Veto Counter |  |