| Param | Original file | Final file |
|---|---|---|
| Filename | modeM0/AS1A13_077T01_9000006286_46934cztM0_level2.fits | modeM0/AS1A13_077T01_9000006286_46934cztM0_level2_quad_clean.evt |
| Size (bytes) | 596,119,680 | 109,229,760 |
| Size | 568.5 MB | 104.2 MB |
| Events in quadrant A | 7,011,034 | 736,687 |
| Events in quadrant B | 4,295,690 | 770,027 |
| Events in quadrant C | 3,241,656 | 737,773 |
| Events in quadrant D | 6,971,208 | 570,995 |
| Mode SS | |||
|---|---|---|---|
| Quadrant | BADHDUFLAG | Total packets | Discarded packets |
| A | 0 | 144 | 0 |
| B | 0 | 144 | 0 |
| C | 0 | 144 | 0 |
| D | 0 | 144 | 0 |
| Mode M0 | |||
|---|---|---|---|
| Quadrant | BADHDUFLAG | Total packets | Discarded packets |
| A | 0 | 25869 | 2 |
| B | 0 | 17404 | 2 |
| C | 0 | 14747 | 2 |
| D | 0 | 25550 | 3 |
| Mode M9 | |||
|---|---|---|---|
| Quadrant | BADHDUFLAG | Total packets | Discarded packets |
| A | 0 | 9 | 0 |
| B | 0 | 9 | 0 |
| C | 0 | 9 | 0 |
| D | 0 | 9 | 0 |
| Quadrant | Total seconds | Saturated seconds | Saturation percentage |
|---|---|---|---|
| A | 7055 | 301 | 4.266478% |
| B | 7056 | 172 | 2.437642% |
| C | 7056 | 93 | 1.318027% |
| D | 7055 | 1242 | 17.604536% |
Noise dominated data is calculated using 1-second bins in cleaned event files. If a bin has >2000 counts, and if more than 50% of those come from <1% of pixels, then it is considered to be noise-dominated and hence unusable.
| Quadrant | # 1 sec bins | Bins with >0 counts | Bins with >2000 counts | High rate bins dominated by noise | Noise dominated (total time) | Noise dominated (detector-on time) | Marked lightcurve |
|---|---|---|---|---|---|---|---|
| A | 7945 | 7055 | 0 | 0 | 0.00% | 0.00% | 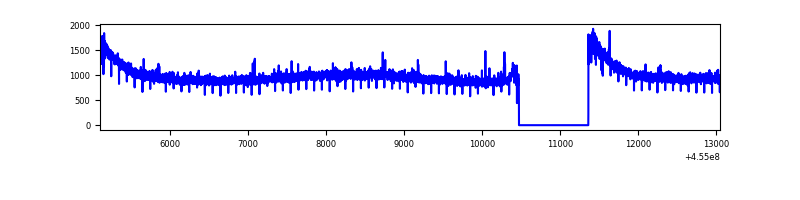 |
| B | 7946 | 7056 | 37 | 37 | 0.47% | 0.52% | 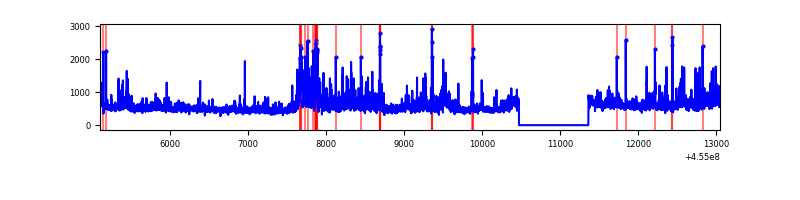 |
| C | 7946 | 7056 | 21 | 21 | 0.26% | 0.30% | 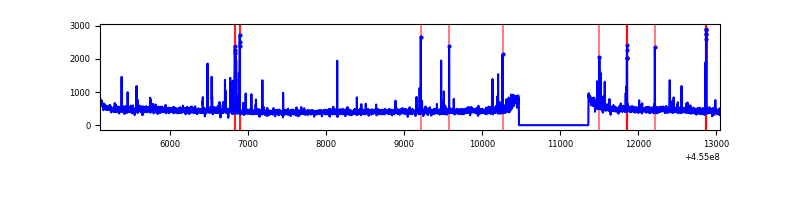 |
| D | 7945 | 7055 | 1139 | 1139 | 14.34% | 16.14% | 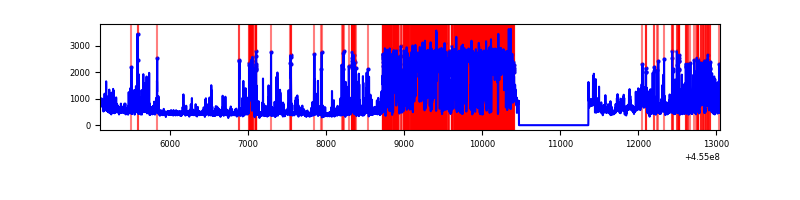 |
Top three noisy pixels from each quadrant. If the there are fewer than three noisy pixels in the level2.evt file, extra rows are filled as -1
| Pixel properties | Quadrant properties | ||||||
|---|---|---|---|---|---|---|---|
| Quadrant | DetID | PixID | Counts | Sigma | Mean | Median | Sigma |
| A | 10 | 83 | 3851653 | 23047.25 | 801 | 784 | 167.1 |
| A | 9 | 191 | 32793 | 191.57 | 801 | 784 | 167.1 |
| A | 7 | 3 | 12814 | 72.0 | 801 | 784 | 167.1 |
| B | 3 | 112 | 825932 | 5166.15 | 802 | 776 | 159.7 |
| B | 5 | 32 | 56735 | 350.35 | 802 | 776 | 159.7 |
| B | 15 | 36 | 52395 | 323.17 | 802 | 776 | 159.7 |
| C | 14 | 254 | 153218 | 815.54 | 791 | 793 | 186.9 |
| C | 13 | 61 | 5275 | 23.98 | 791 | 793 | 186.9 |
| C | 0 | 207 | 4937 | 22.17 | 791 | 793 | 186.9 |
| D | 12 | 0 | 2877467 | 15668.21 | 723 | 699 | 183.6 |
| D | 1 | 52 | 675103 | 3673.11 | 723 | 699 | 183.6 |
| D | 13 | 249 | 385945 | 2098.23 | 723 | 699 | 183.6 |
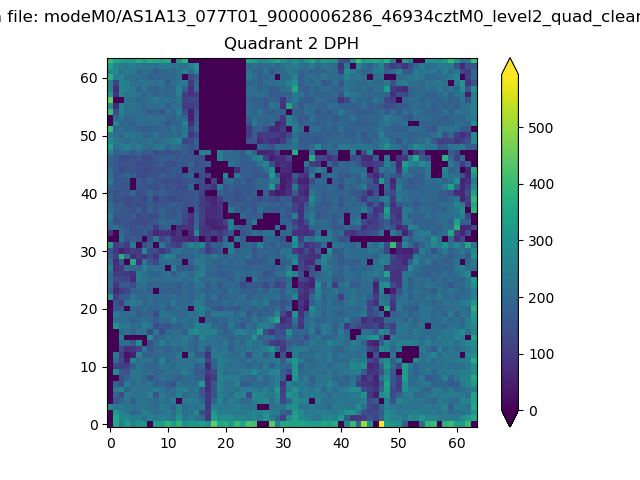
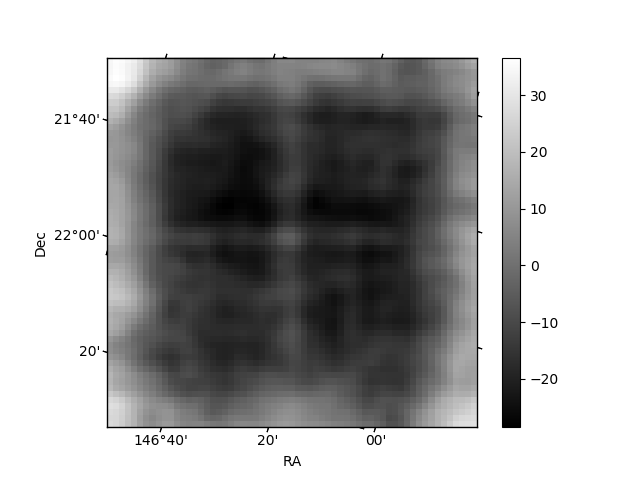
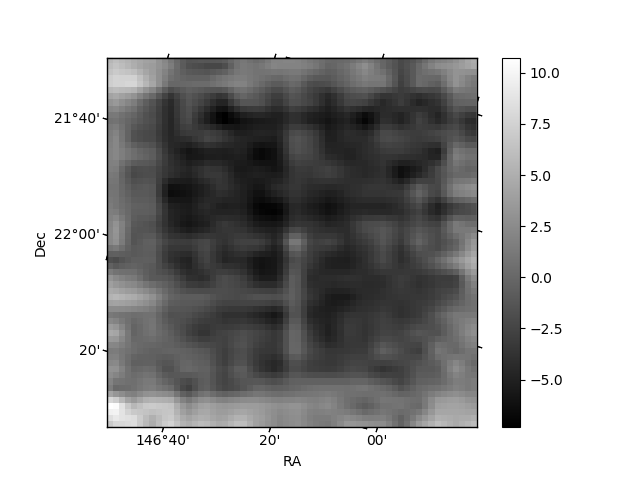
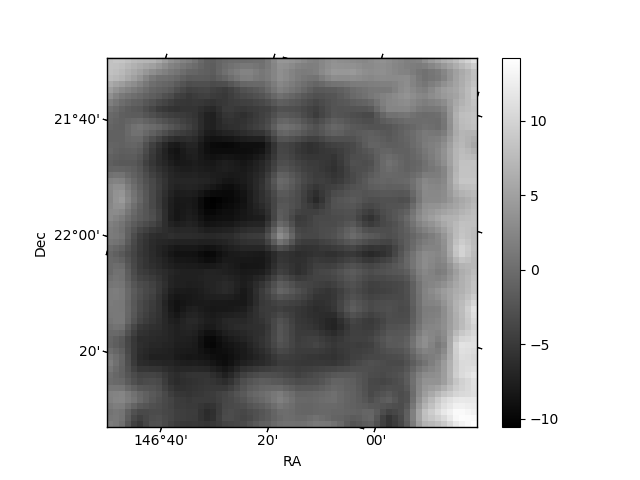
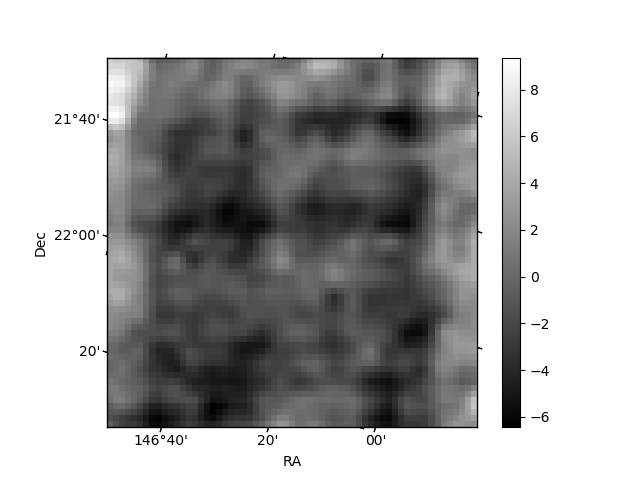
Histogram calculated using DETX and DETY for each event in the final _common_clean file
| Quadrant A | 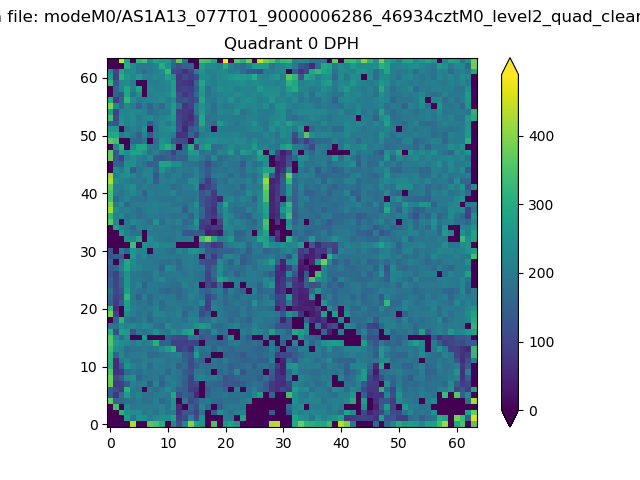 |
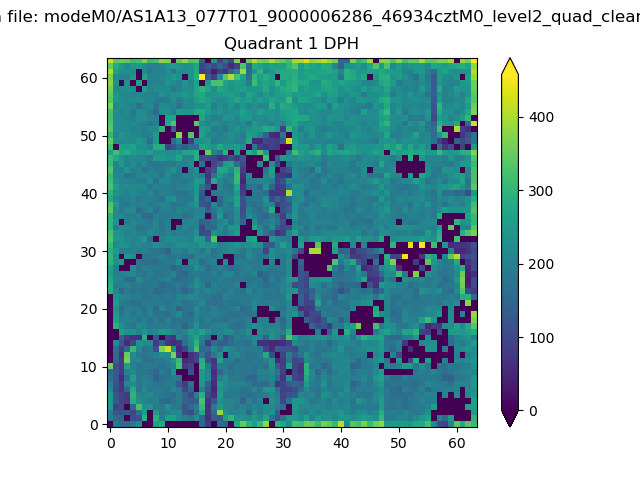 |
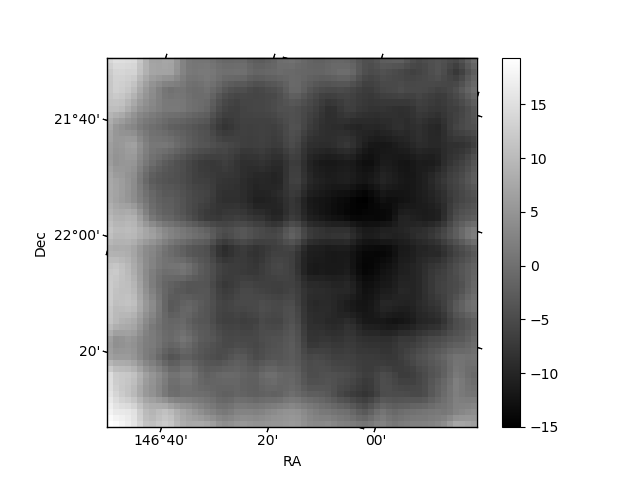
Quadrant B |
|---|---|---|---|
| Quadrant D | 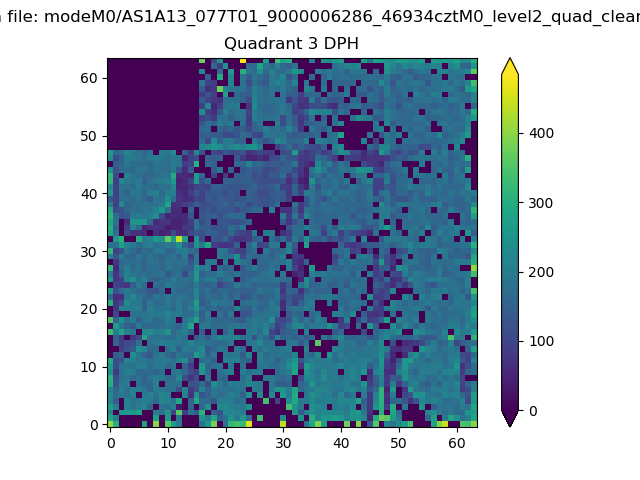 |
 |
Quadrant C |
| Plot type | Count rate plots | Images |
|---|---|---|
| Comparison with Poisson distribution Blue bars denote a histogram of data divided into 1 sec bins. Red curve is a Poisson curve with rate = median count rate of data. |
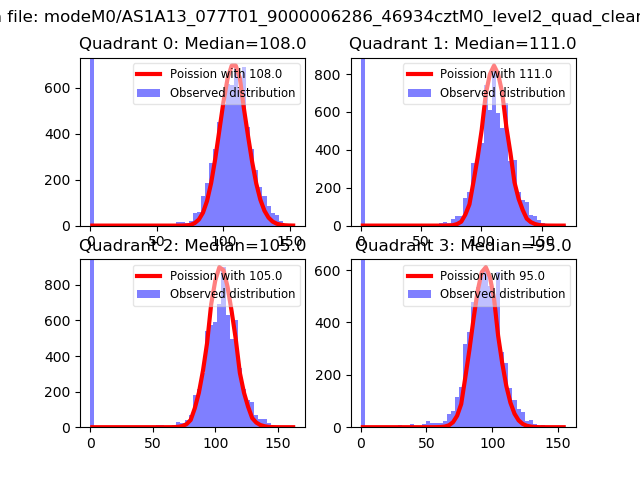 |
 |
| Quadrant-wise count rates Data is divided into 100 sec bins |
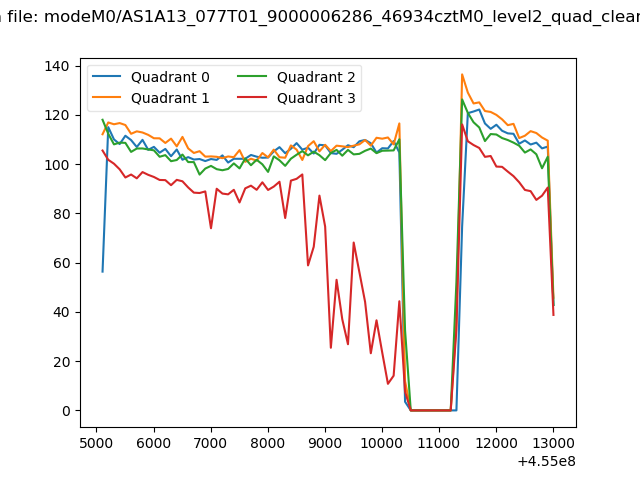 |
|
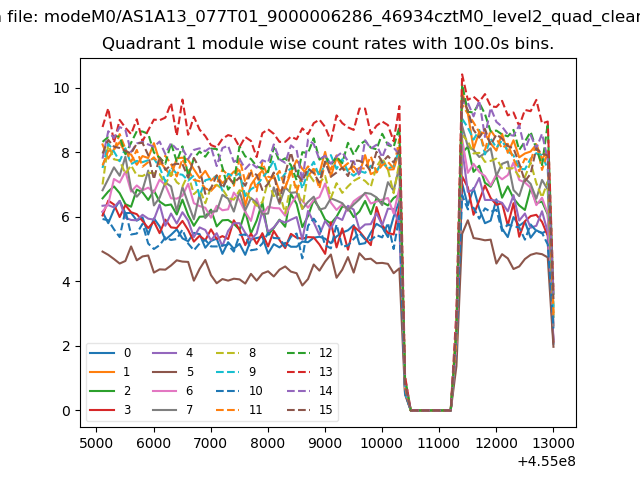
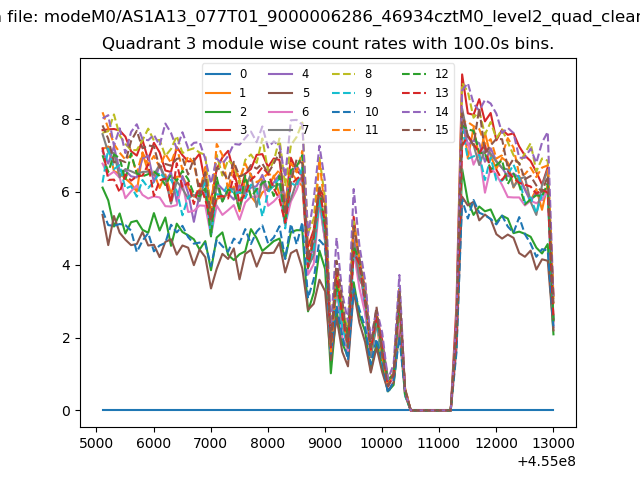
| Module-wise count rates for Quadrant A Data is divided into 100 sec bins |
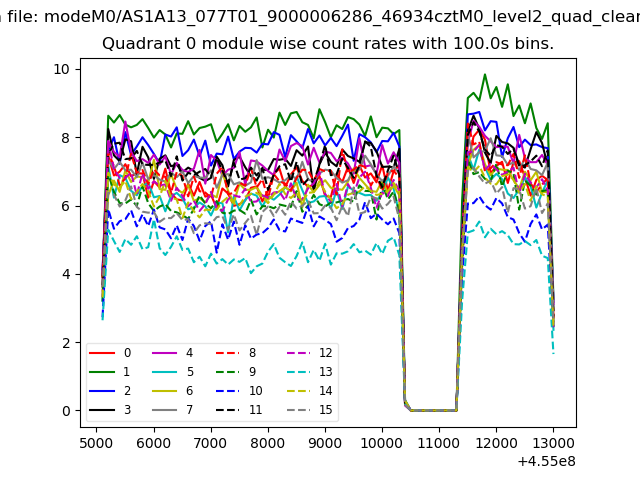 |
 |
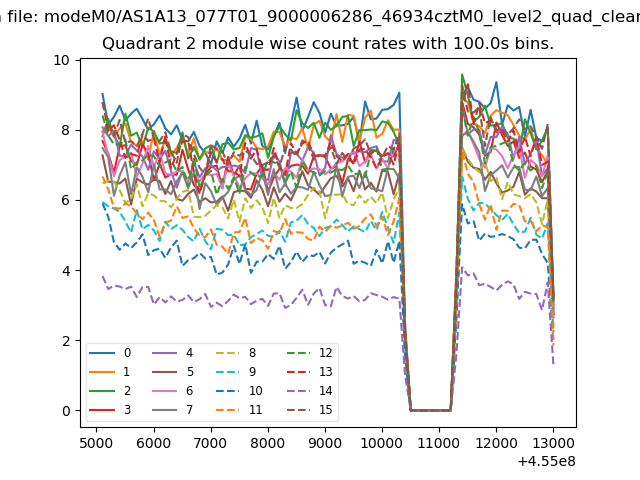
| Module-wise count rates for Quadrant B Data is divided into 100 sec bins |
 |
 |
| Module-wise count rates for Quadrant C Data is divided into 100 sec bins |
 |
 |
| Module-wise count rates for Quadrant D Data is divided into 100 sec bins |
 |
 |
| Parameter | Plot |
|---|---|
| CZT HV Monitor | 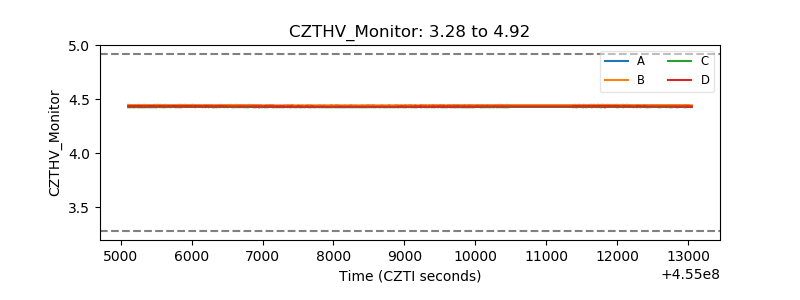 |
| D_VDD | 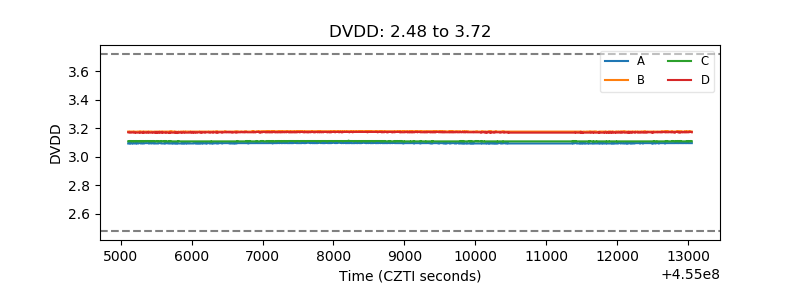 |
| Temperature 1 | 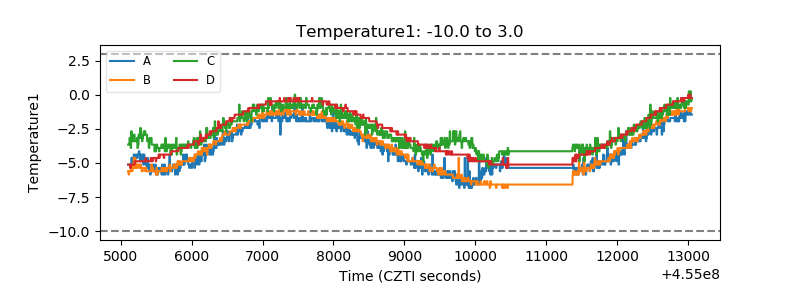 |
| Veto HV Monitor | 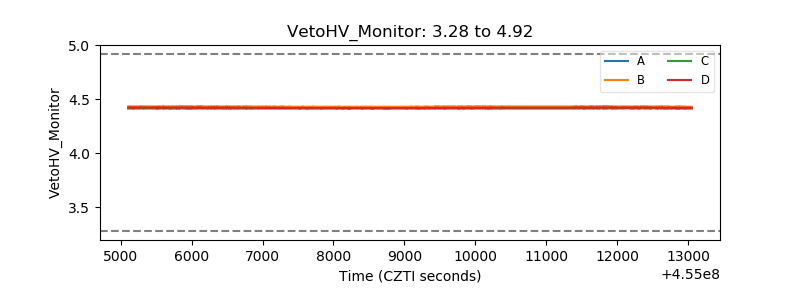 |
| Veto LLD | 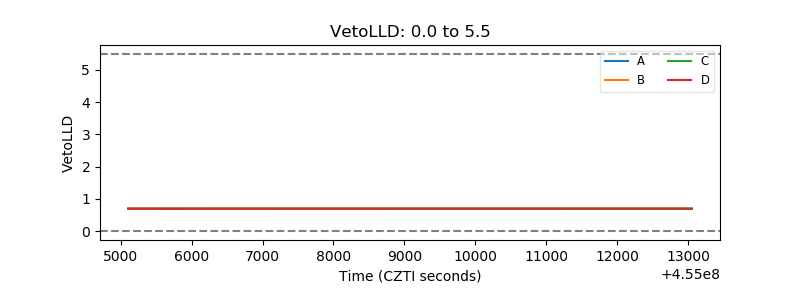 |
| Alpha Counter | 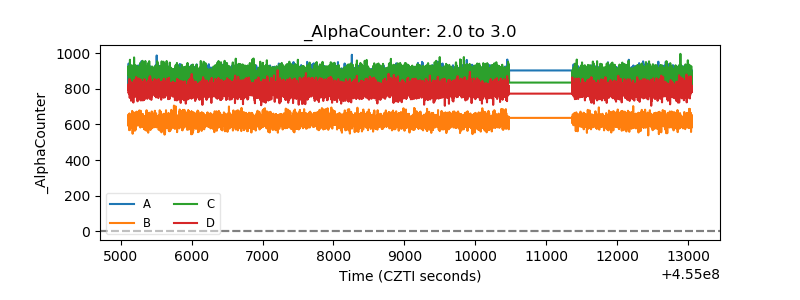 |
| _CPM_Rate | 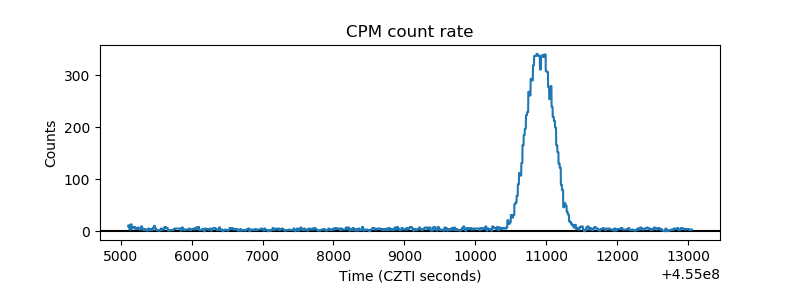 |
| CZT Counter | 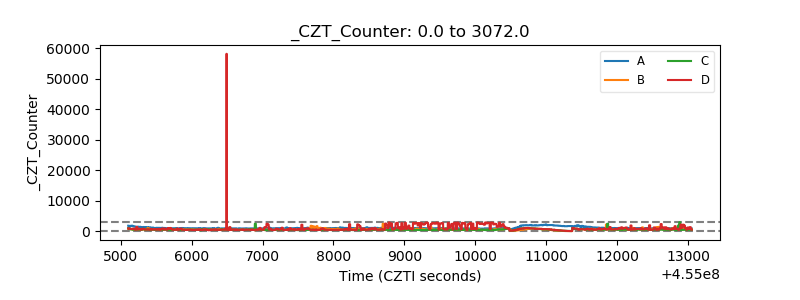 |
| +2.5 Volts monitor | 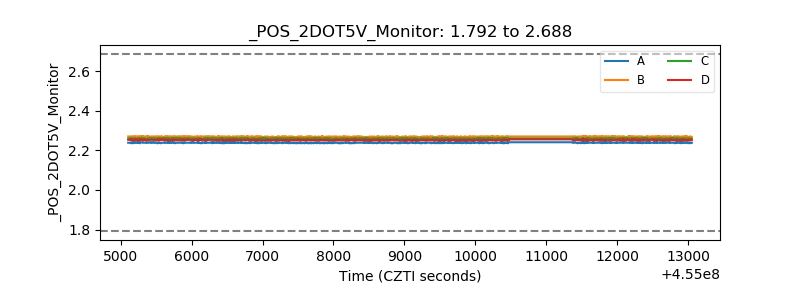 |
| +5 Volts monitor | 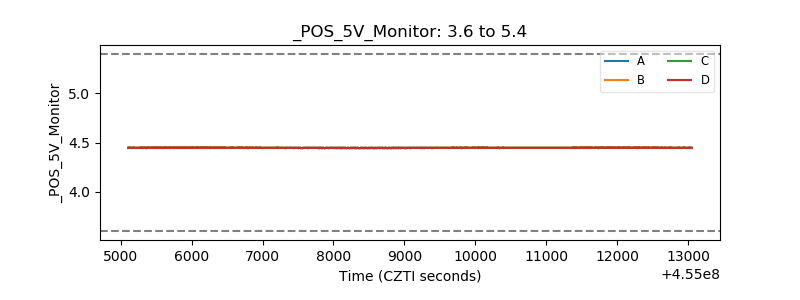 |
| _ROLL_ROT | 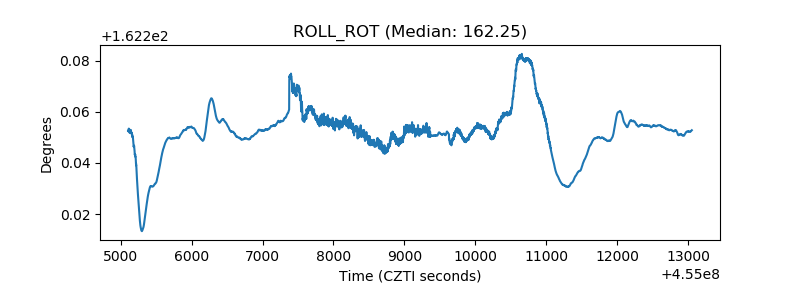 |
| _Roll_DEC | 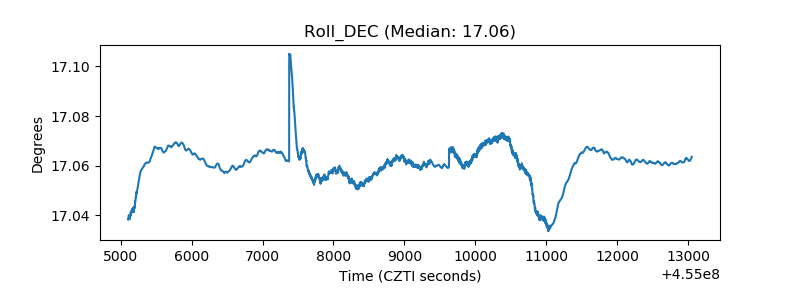 |
| _Roll_RA | 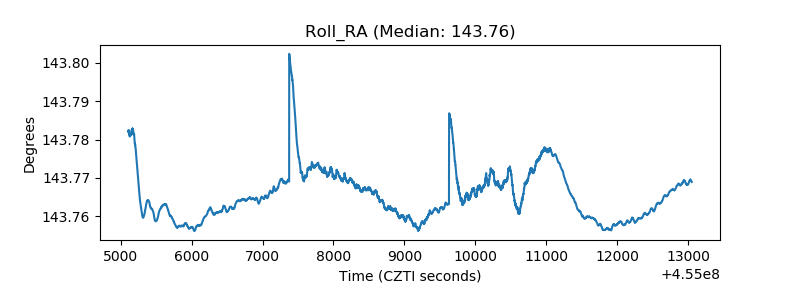 |
| Veto Counter | 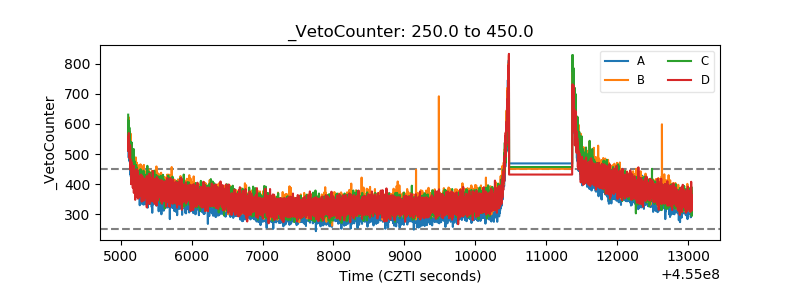 |