| Param | Original file | Final file |
|---|---|---|
| Filename | modeM0/AS1C09_005T01_9000006296_47016cztM0_level2.fits | modeM0/AS1C09_005T01_9000006296_47016cztM0_level2_quad_clean.evt |
| Size (bytes) | 752,103,360 | 102,058,560 |
| Size | 717.3 MB | 97.3 MB |
| Events in quadrant A | 6,809,837 | 766,814 |
| Events in quadrant B | 13,466,317 | 379,376 |
| Events in quadrant C | 3,125,801 | 749,889 |
| Events in quadrant D | 3,879,778 | 691,755 |
| Mode SS | |||
|---|---|---|---|
| Quadrant | BADHDUFLAG | Total packets | Discarded packets |
| A | 0 | 144 | 0 |
| B | 0 | 144 | 0 |
| C | 0 | 144 | 0 |
| D | 0 | 144 | 0 |
| Mode M0 | |||
|---|---|---|---|
| Quadrant | BADHDUFLAG | Total packets | Discarded packets |
| A | 0 | 24941 | 0 |
| B | 0 | 44972 | 2 |
| C | 0 | 14934 | 0 |
| D | 0 | 16922 | 0 |
| Quadrant | Total seconds | Saturated seconds | Saturation percentage |
|---|---|---|---|
| A | 7208 | 152 | 2.108768% |
| B | 7208 | 4205 | 58.337958% |
| C | 7208 | 18 | 0.249723% |
| D | 7208 | 114 | 1.581576% |
Noise dominated data is calculated using 1-second bins in cleaned event files. If a bin has >2000 counts, and if more than 50% of those come from <1% of pixels, then it is considered to be noise-dominated and hence unusable.
| Quadrant | # 1 sec bins | Bins with >0 counts | Bins with >2000 counts | High rate bins dominated by noise | Noise dominated (total time) | Noise dominated (detector-on time) | Marked lightcurve |
|---|---|---|---|---|---|---|---|
| A | 7208 | 7208 | 4 | 4 | 0.06% | 0.06% | 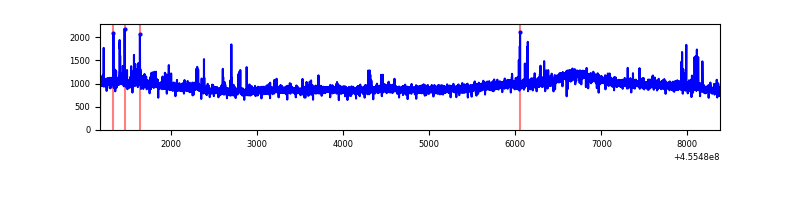 |
| B | 7208 | 7208 | 3268 | 3268 | 45.34% | 45.34% | 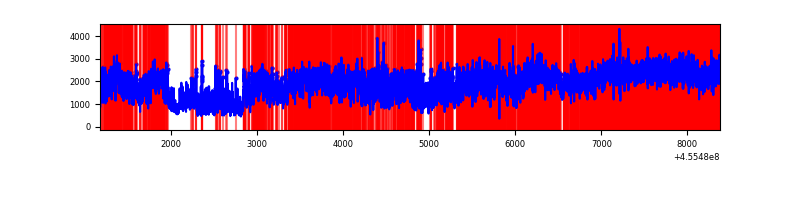 |
| C | 7208 | 7208 | 15 | 15 | 0.21% | 0.21% | 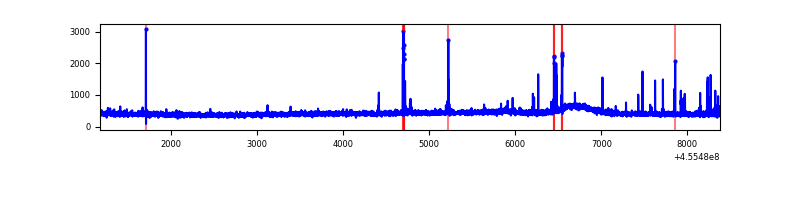 |
| D | 7208 | 7208 | 89 | 89 | 1.23% | 1.23% | 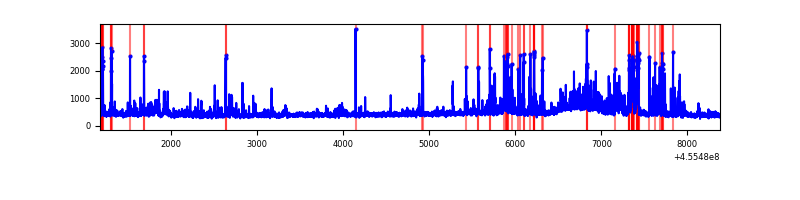 |
Top three noisy pixels from each quadrant. If the there are fewer than three noisy pixels in the level2.evt file, extra rows are filled as -1
| Pixel properties | Quadrant properties | ||||||
|---|---|---|---|---|---|---|---|
| Quadrant | DetID | PixID | Counts | Sigma | Mean | Median | Sigma |
| A | 10 | 83 | 3606648 | 21765.37 | 788 | 769 | 165.7 |
| A | 9 | 191 | 124506 | 746.89 | 788 | 769 | 165.7 |
| A | 13 | 254 | 12351 | 69.91 | 788 | 769 | 165.7 |
| B | 3 | 112 | 10383449 | 87598.12 | 609 | 590 | 118.5 |
| B | 4 | 171 | 296981 | 2500.59 | 609 | 590 | 118.5 |
| B | 15 | 36 | 133342 | 1120.0 | 609 | 590 | 118.5 |
| C | 14 | 254 | 108823 | 601.49 | 768 | 775 | 179.6 |
| C | 12 | 250 | 10132 | 52.09 | 768 | 775 | 179.6 |
| C | 12 | 249 | 10100 | 51.91 | 768 | 775 | 179.6 |
| D | 12 | 233 | 299273 | 1553.18 | 768 | 742 | 192.2 |
| D | 1 | 52 | 183530 | 951.0 | 768 | 742 | 192.2 |
| D | 13 | 249 | 168242 | 871.46 | 768 | 742 | 192.2 |
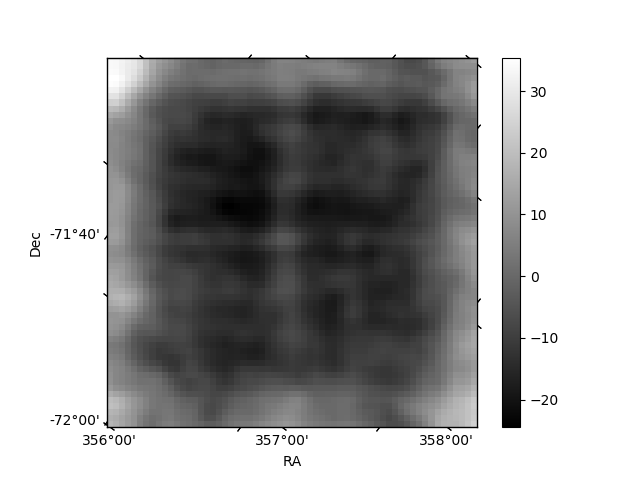
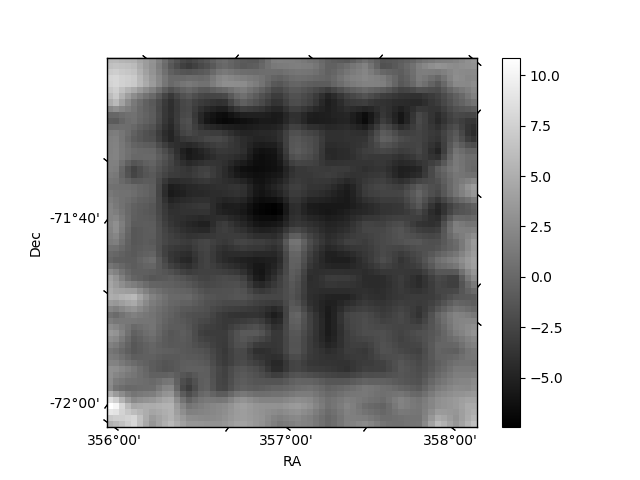
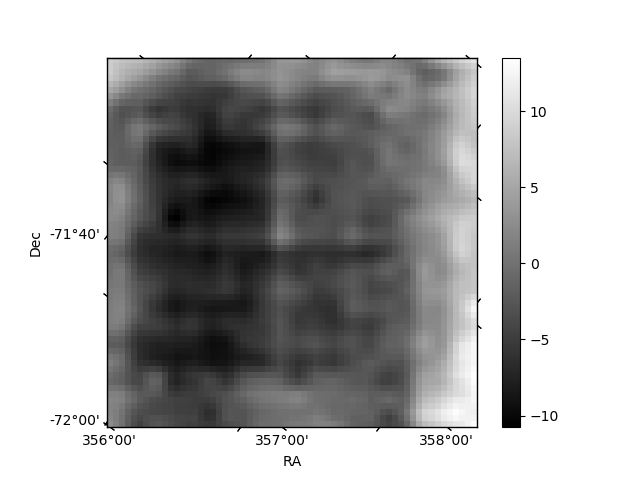
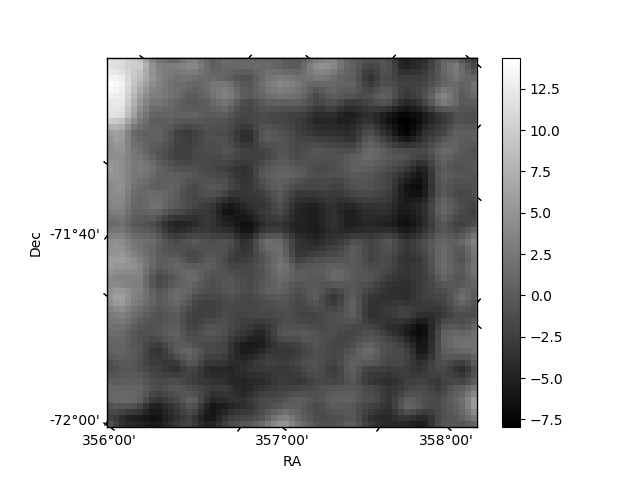
Histogram calculated using DETX and DETY for each event in the final _common_clean file
| Quadrant A | 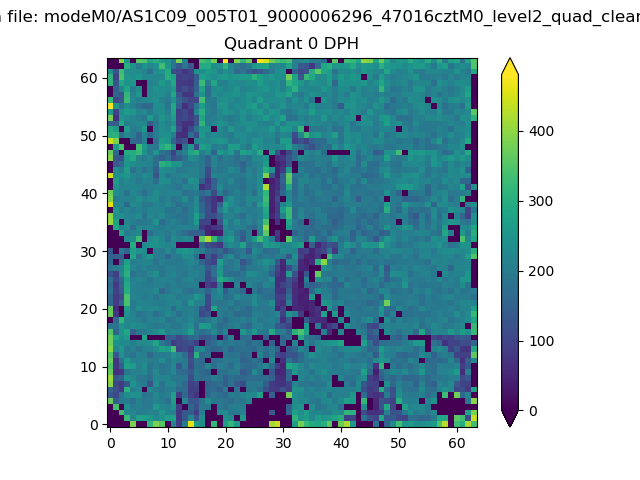 |
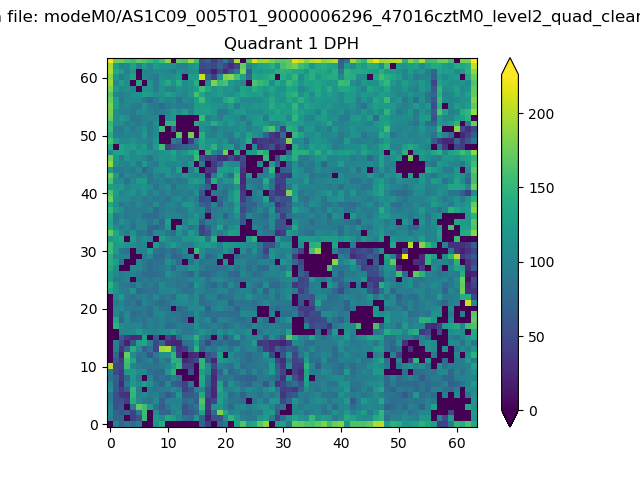 |
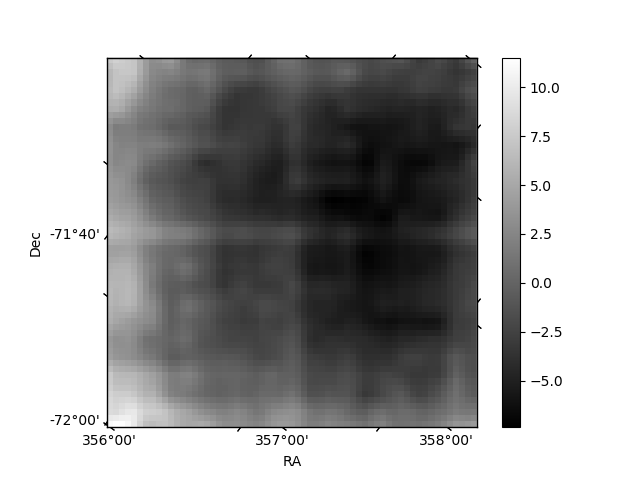
Quadrant B |
|---|---|---|---|
| Quadrant D | 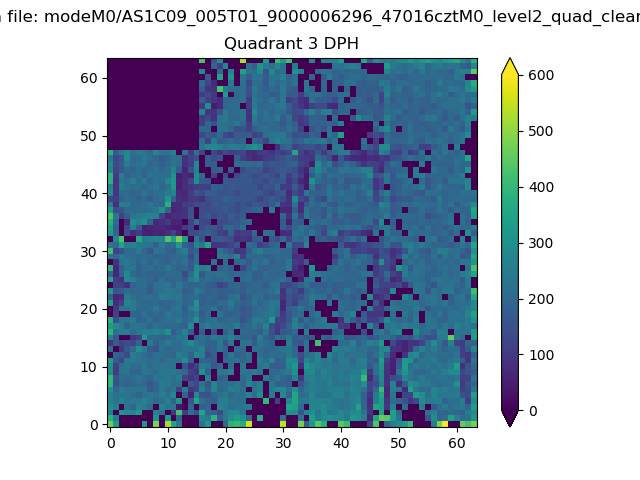 |
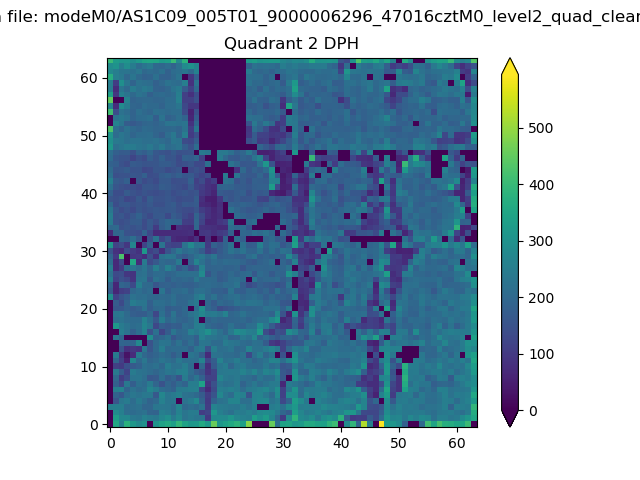 |
Quadrant C |
| Plot type | Count rate plots | Images |
|---|---|---|
| Comparison with Poisson distribution Blue bars denote a histogram of data divided into 1 sec bins. Red curve is a Poisson curve with rate = median count rate of data. |
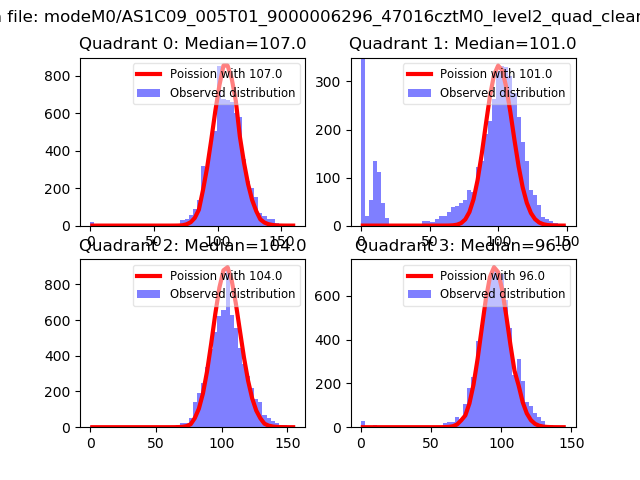 |
 |
| Quadrant-wise count rates Data is divided into 100 sec bins |
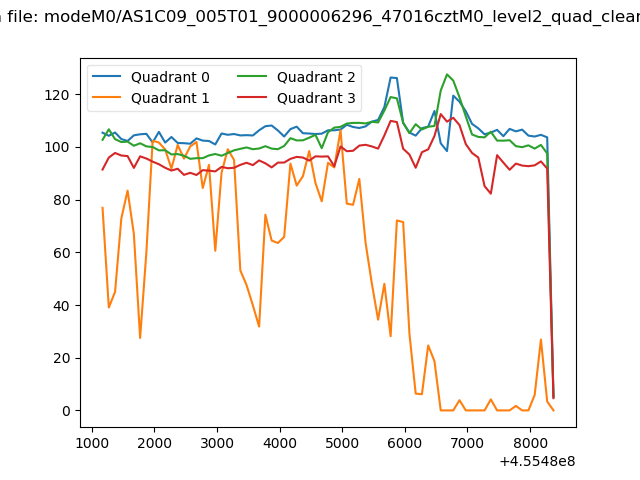 |
|
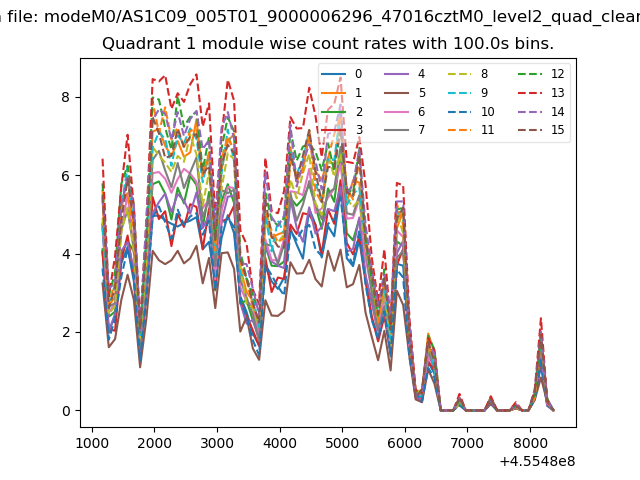
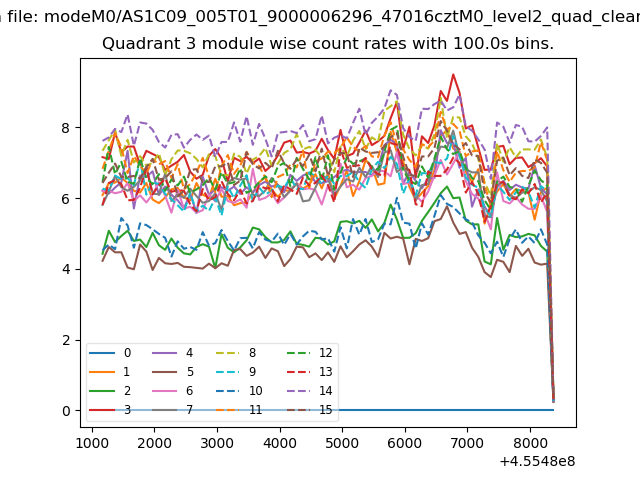
| Module-wise count rates for Quadrant A Data is divided into 100 sec bins |
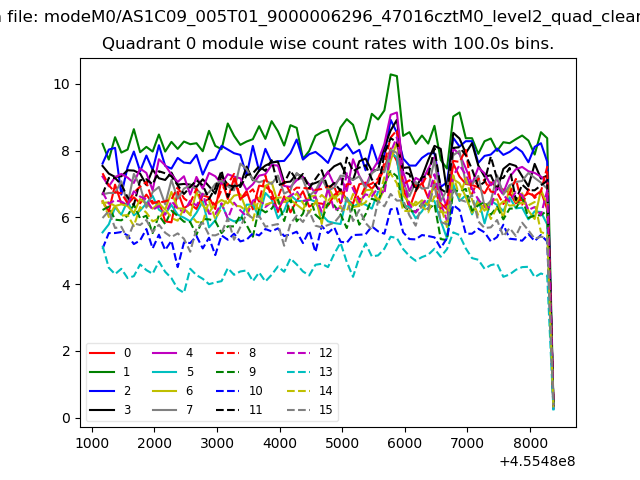 |
 |
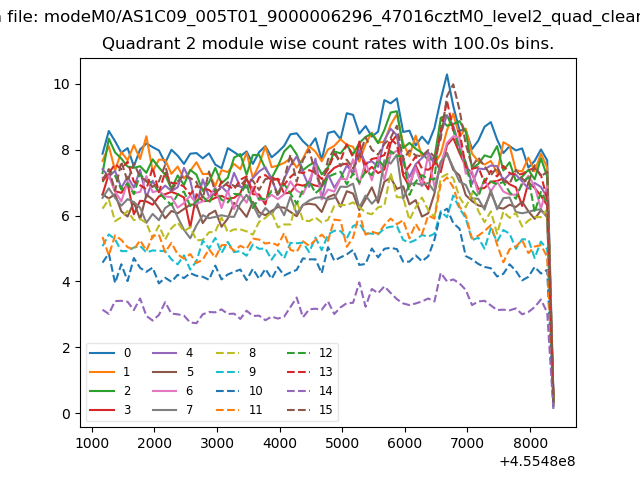
| Module-wise count rates for Quadrant B Data is divided into 100 sec bins |
 |
 |
| Module-wise count rates for Quadrant C Data is divided into 100 sec bins |
 |
 |
| Module-wise count rates for Quadrant D Data is divided into 100 sec bins |
 |
 |
| Parameter | Plot |
|---|---|
| CZT HV Monitor | 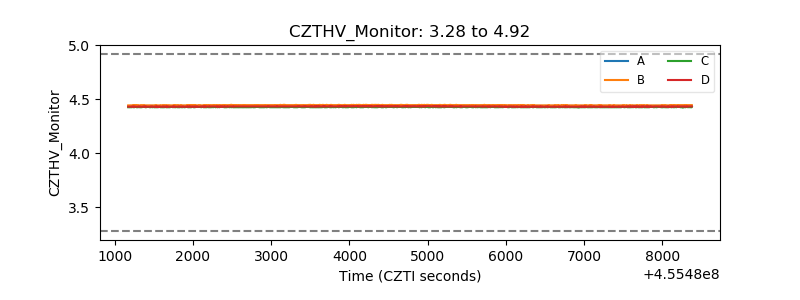 |
| D_VDD | 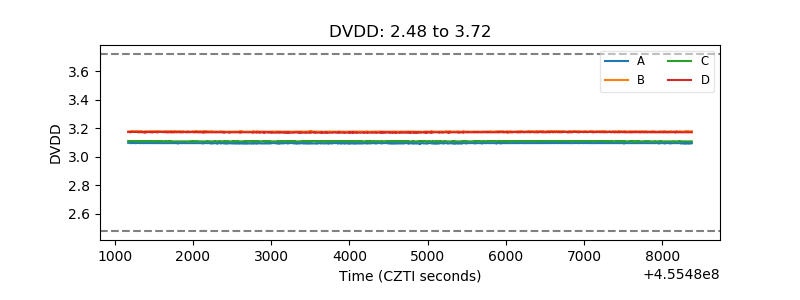 |
| Temperature 1 | 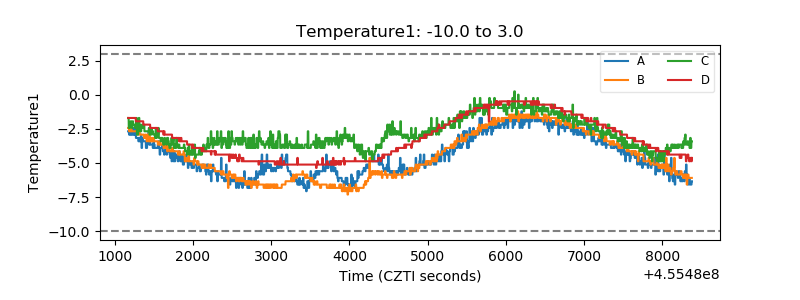 |
| Veto HV Monitor | 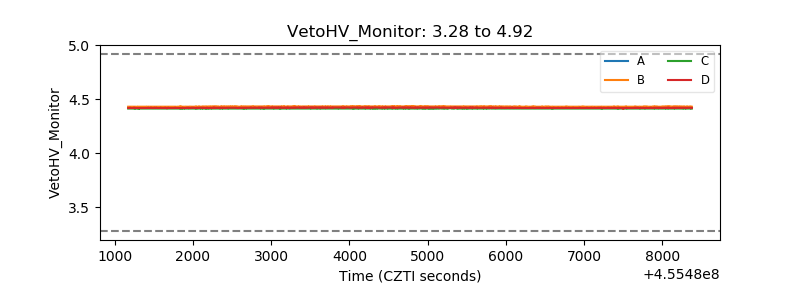 |
| Veto LLD | 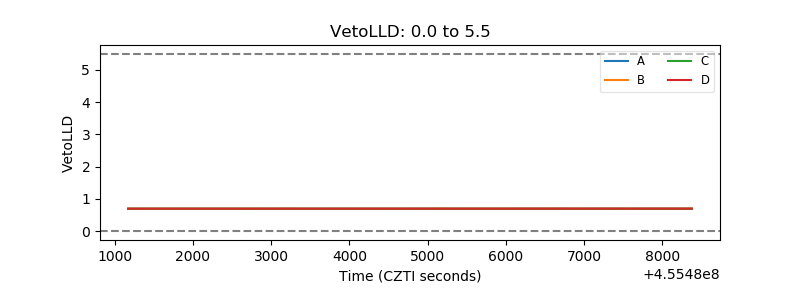 |
| Alpha Counter | 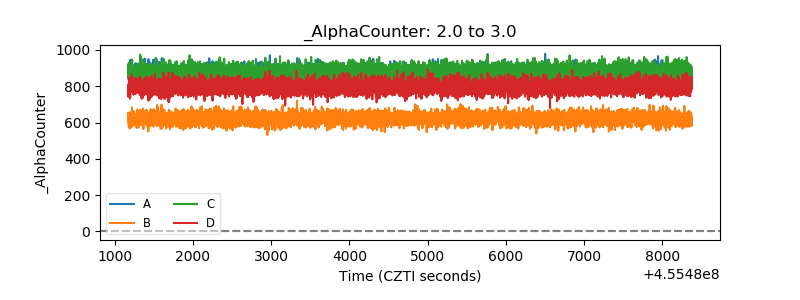 |
| _CPM_Rate | 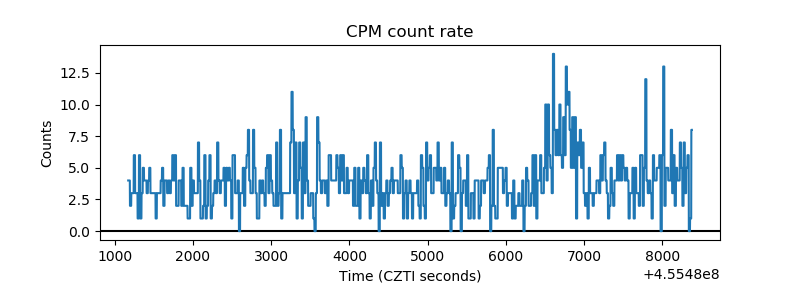 |
| CZT Counter | 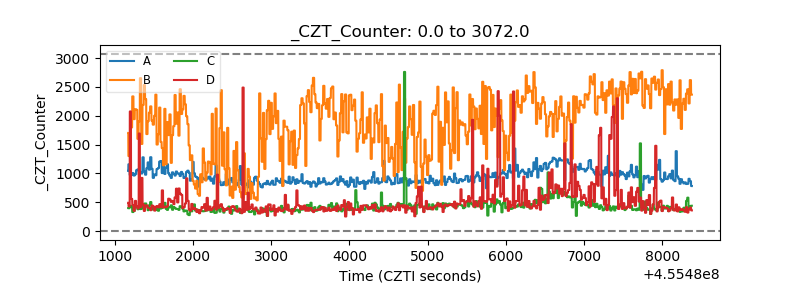 |
| +2.5 Volts monitor | 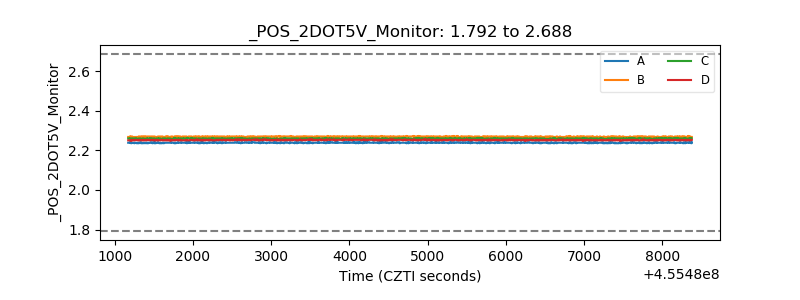 |
| +5 Volts monitor | 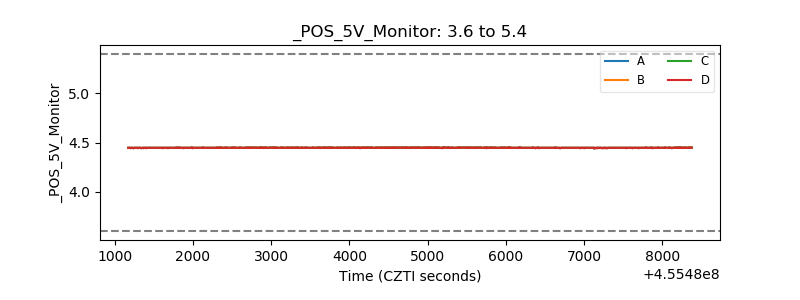 |
| _ROLL_ROT | 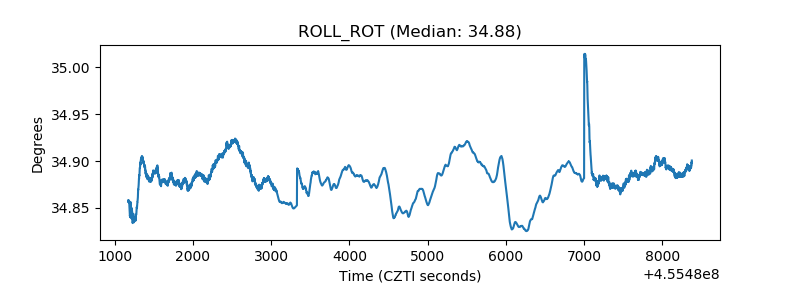 |
| _Roll_DEC | 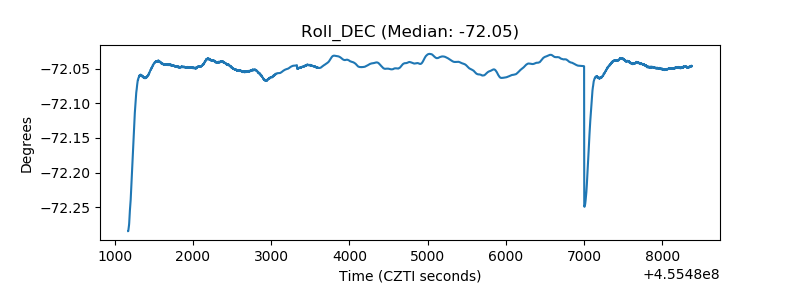 |
| _Roll_RA | 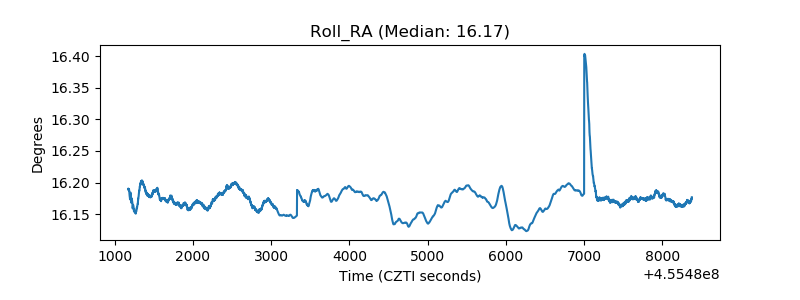 |
| Veto Counter | 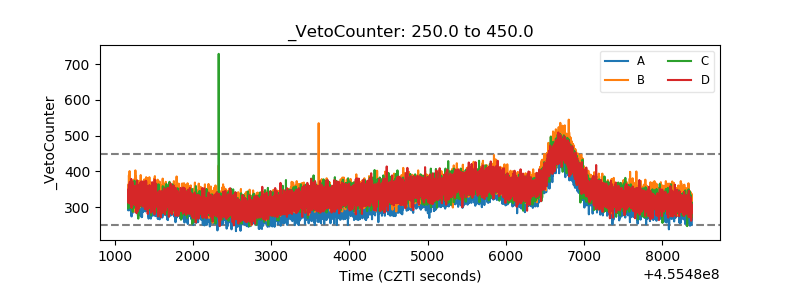 |