| Param | Original file | Final file |
|---|---|---|
| Filename | modeM0/AS1C09_003T01_9000006298_47135cztM0_level2.fits | modeM0/AS1C09_003T01_9000006298_47135cztM0_level2_quad_clean.evt |
| Size (bytes) | 944,904,960 | 194,267,520 |
| Size | 901.1 MB | 185.3 MB |
| Events in quadrant A | 12,395,767 | 1,311,883 |
| Events in quadrant B | 6,330,970 | 1,340,016 |
| Events in quadrant C | 5,823,831 | 1,279,313 |
| Events in quadrant D | 9,455,187 | 1,082,104 |
| Mode M9 | |||
|---|---|---|---|
| Quadrant | BADHDUFLAG | Total packets | Discarded packets |
| A | 0 | 10 | 0 |
| B | 0 | 10 | 0 |
| C | 0 | 10 | 0 |
| D | 0 | 10 | 0 |
| Mode M0 | |||
|---|---|---|---|
| Quadrant | BADHDUFLAG | Total packets | Discarded packets |
| A | 0 | 45264 | 2 |
| B | 0 | 27368 | 2 |
| C | 0 | 26758 | 2 |
| D | 0 | 37033 | 2 |
| Mode SS | |||
|---|---|---|---|
| Quadrant | BADHDUFLAG | Total packets | Discarded packets |
| A | 0 | 254 | 0 |
| B | 0 | 254 | 0 |
| C | 0 | 254 | 0 |
| D | 0 | 254 | 0 |
| Quadrant | Total seconds | Saturated seconds | Saturation percentage |
|---|---|---|---|
| A | 12563 | 415 | 3.303351% |
| B | 12563 | 143 | 1.138263% |
| C | 12564 | 113 | 0.899395% |
| D | 12564 | 1201 | 9.559058% |
Noise dominated data is calculated using 1-second bins in cleaned event files. If a bin has >2000 counts, and if more than 50% of those come from <1% of pixels, then it is considered to be noise-dominated and hence unusable.
| Quadrant | # 1 sec bins | Bins with >0 counts | Bins with >2000 counts | High rate bins dominated by noise | Noise dominated (total time) | Noise dominated (detector-on time) | Marked lightcurve |
|---|---|---|---|---|---|---|---|
| A | 13583 | 12565 | 81 | 81 | 0.60% | 0.64% | 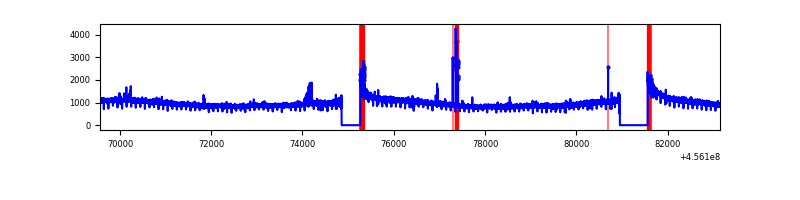 |
| B | 13583 | 12565 | 46 | 46 | 0.34% | 0.37% | 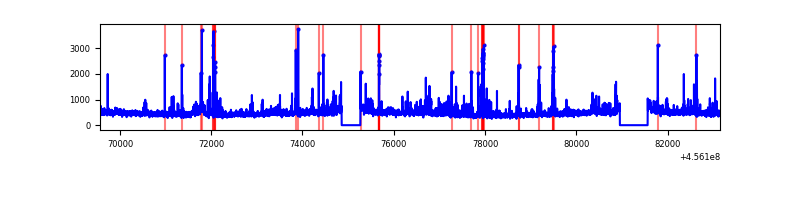 |
| C | 13584 | 12566 | 68 | 68 | 0.50% | 0.54% | 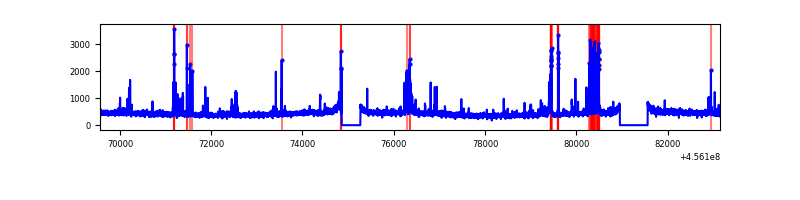 |
| D | 13584 | 12566 | 989 | 989 | 7.28% | 7.87% | 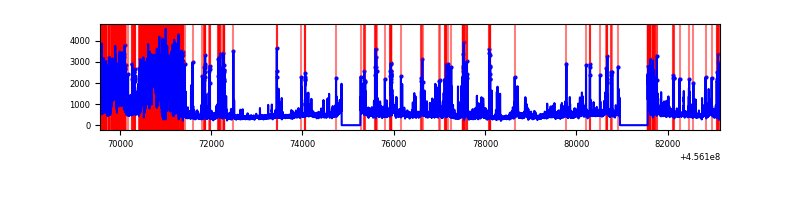 |
Top three noisy pixels from each quadrant. If the there are fewer than three noisy pixels in the level2.evt file, extra rows are filled as -1
| Pixel properties | Quadrant properties | ||||||
|---|---|---|---|---|---|---|---|
| Quadrant | DetID | PixID | Counts | Sigma | Mean | Median | Sigma |
| A | 10 | 83 | 6868393 | 24306.19 | 1364 | 1334 | 282.5 |
| A | 0 | 247 | 105088 | 367.24 | 1364 | 1334 | 282.5 |
| A | 10 | 255 | 77382 | 269.17 | 1364 | 1334 | 282.5 |
| B | 5 | 255 | 179868 | 665.86 | 1366 | 1322 | 268.1 |
| B | 4 | 21 | 163777 | 605.85 | 1366 | 1322 | 268.1 |
| B | 0 | 200 | 154389 | 570.84 | 1366 | 1322 | 268.1 |
| C | 15 | 208 | 376974 | 1192.97 | 1341 | 1346 | 314.9 |
| C | 14 | 254 | 139353 | 438.3 | 1341 | 1346 | 314.9 |
| C | 6 | 247 | 32908 | 100.24 | 1341 | 1346 | 314.9 |
| D | 12 | 3 | 1439310 | 4425.73 | 1292 | 1250 | 324.9 |
| D | 2 | 249 | 1233450 | 3792.18 | 1292 | 1250 | 324.9 |
| D | 1 | 47 | 433657 | 1330.76 | 1292 | 1250 | 324.9 |
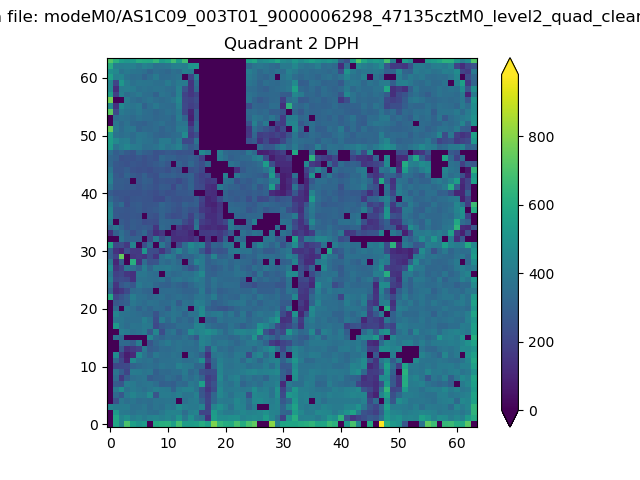
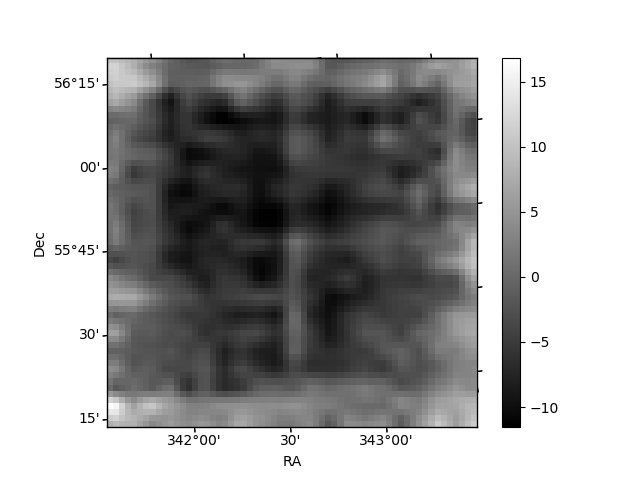
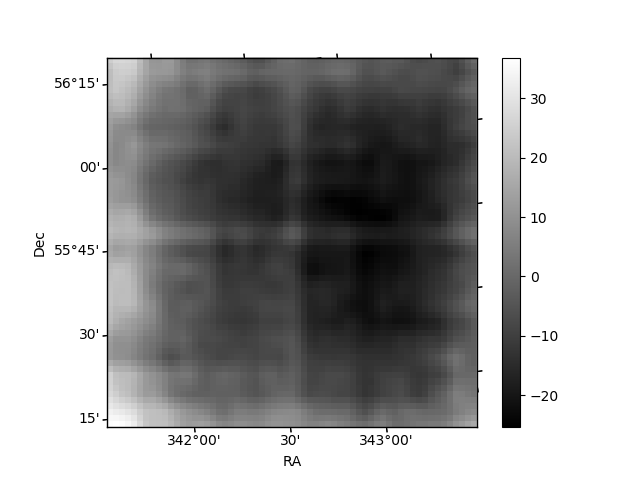
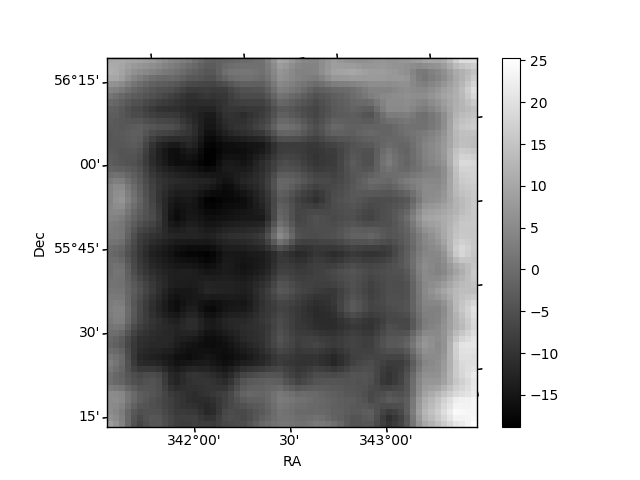
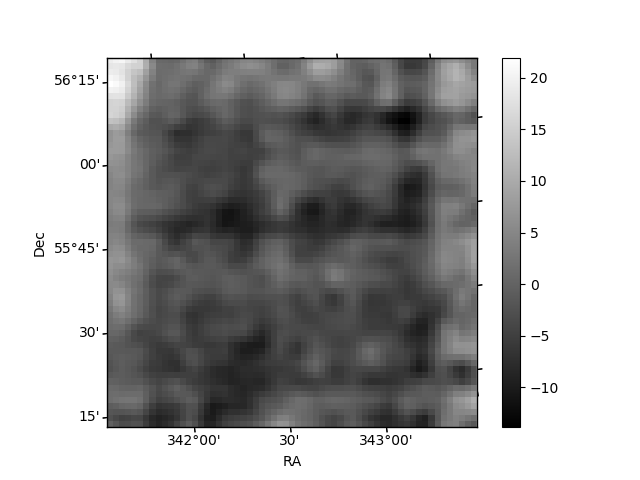
Histogram calculated using DETX and DETY for each event in the final _common_clean file
| Quadrant A |  |
 |
Quadrant B |
|---|---|---|---|
| Quadrant D | 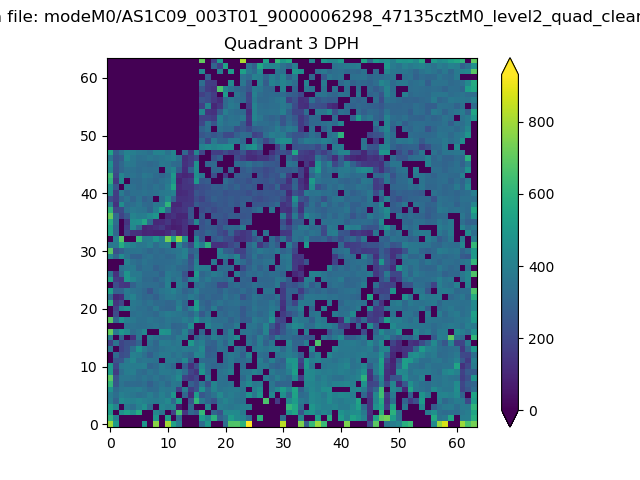 |
 |
Quadrant C |
| Plot type | Count rate plots | Images |
|---|---|---|
| Comparison with Poisson distribution Blue bars denote a histogram of data divided into 1 sec bins. Red curve is a Poisson curve with rate = median count rate of data. |
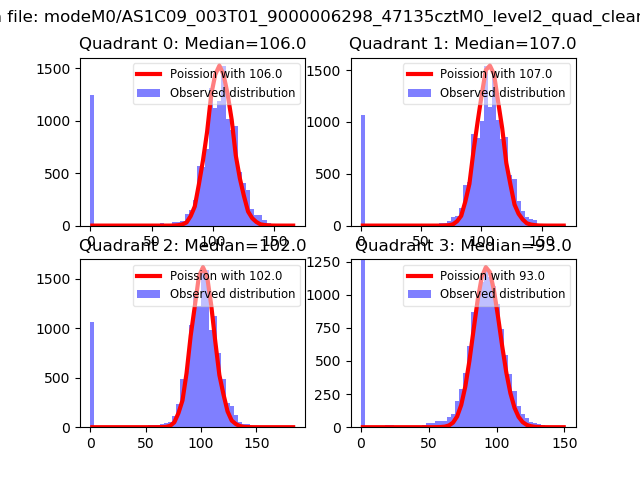 |
 |
| Quadrant-wise count rates Data is divided into 100 sec bins |
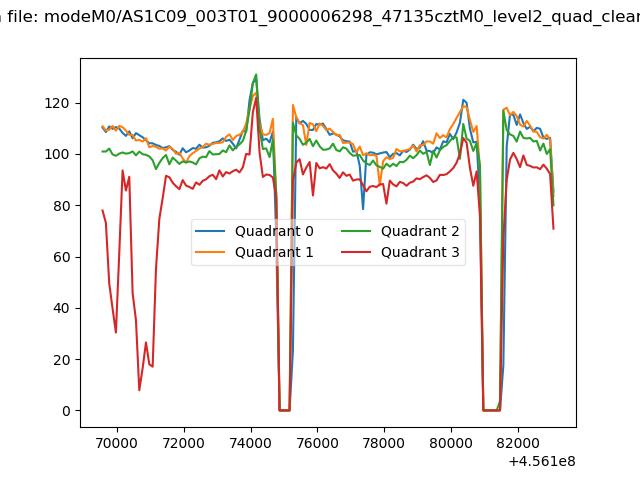 |
|
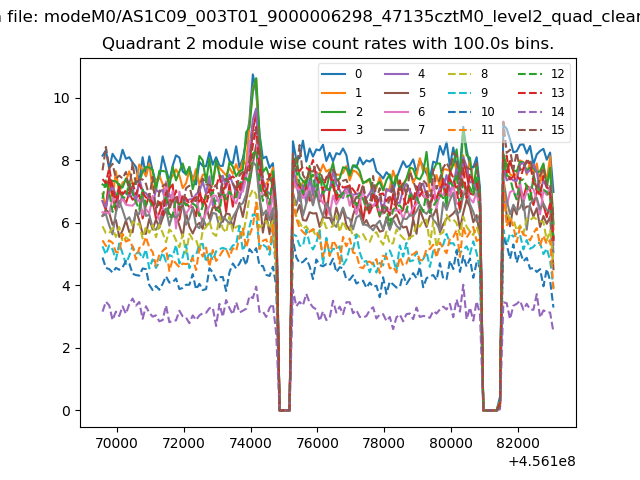
| Module-wise count rates for Quadrant A Data is divided into 100 sec bins |
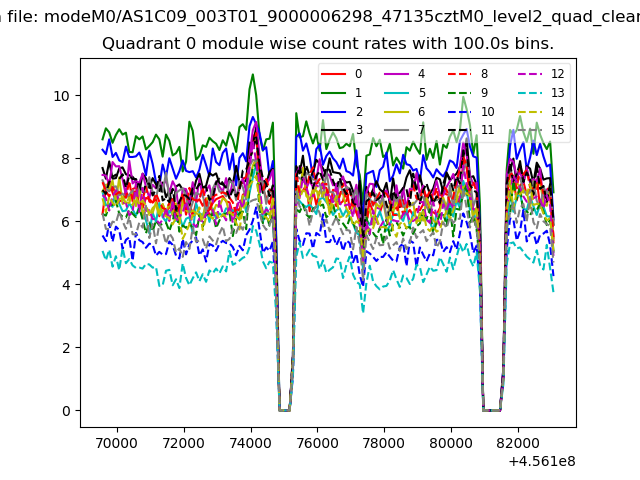 |
 |
| Module-wise count rates for Quadrant B Data is divided into 100 sec bins |
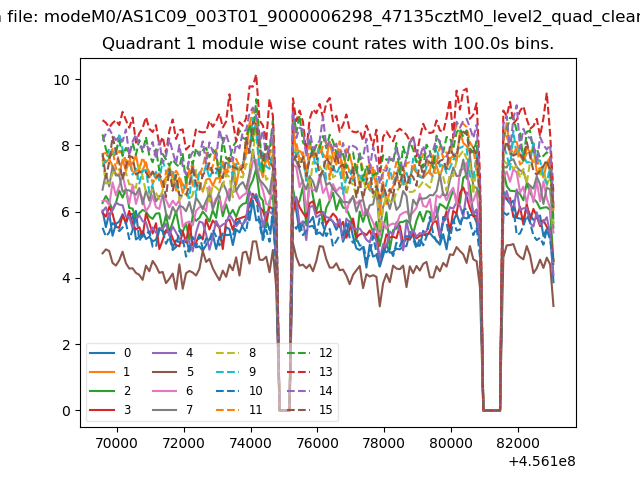 |
 |
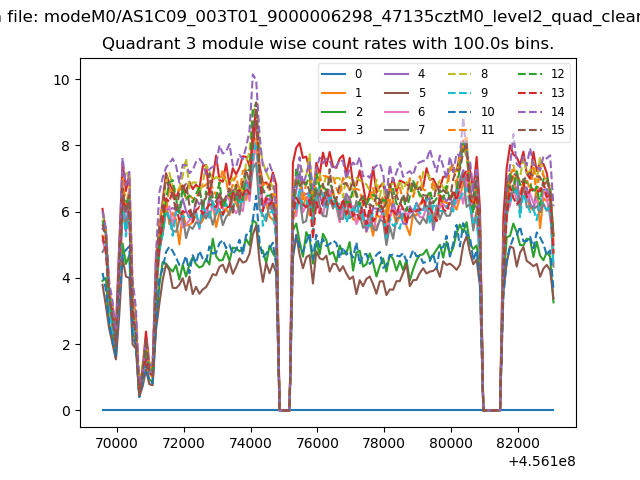
| Module-wise count rates for Quadrant C Data is divided into 100 sec bins |
 |
 |
| Module-wise count rates for Quadrant D Data is divided into 100 sec bins |
 |
 |
| Parameter | Plot |
|---|---|
| CZT HV Monitor | 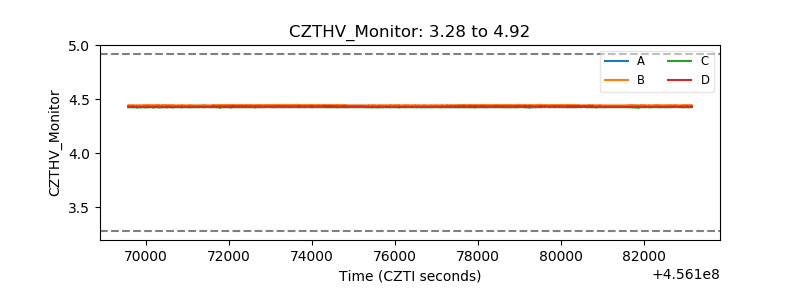 |
| D_VDD | 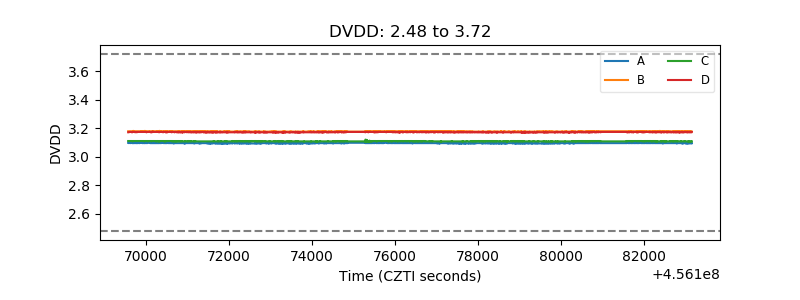 |
| Temperature 1 | 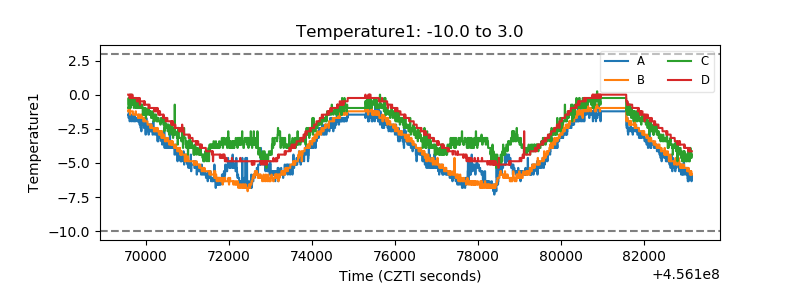 |
| Veto HV Monitor | 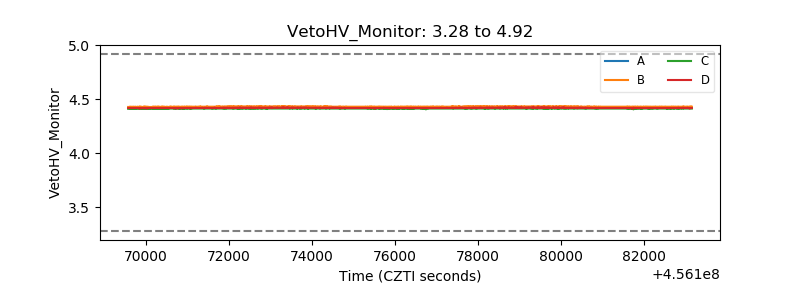 |
| Veto LLD | 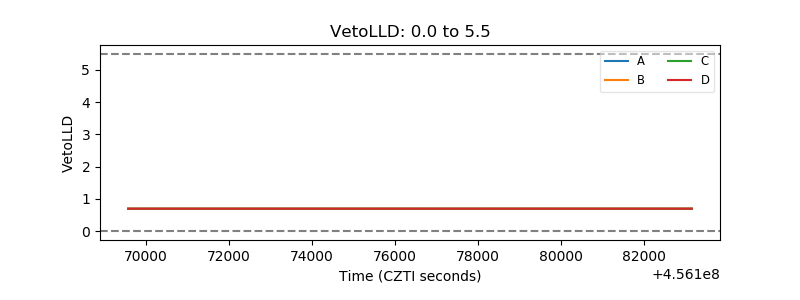 |
| Alpha Counter | 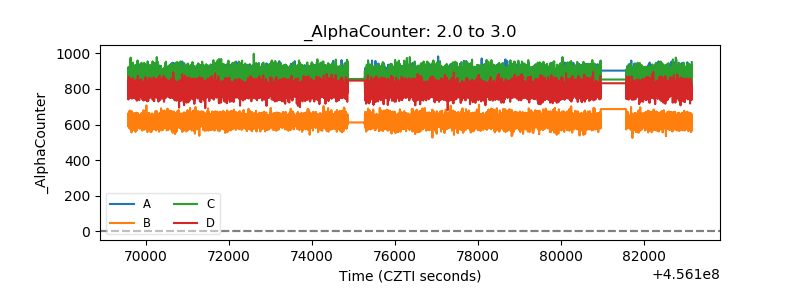 |
| _CPM_Rate |  |
| CZT Counter | 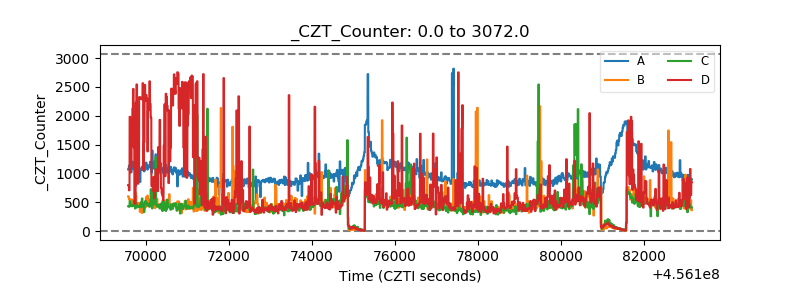 |
| +2.5 Volts monitor | 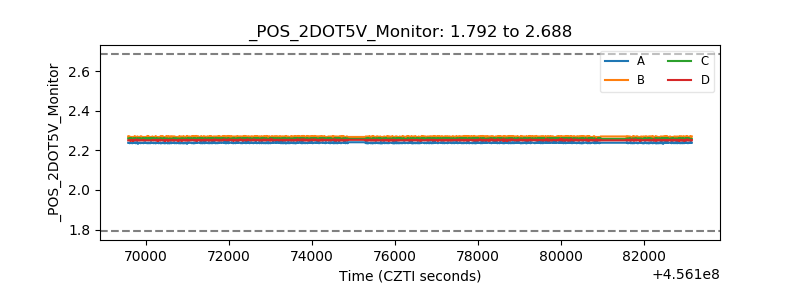 |
| +5 Volts monitor | 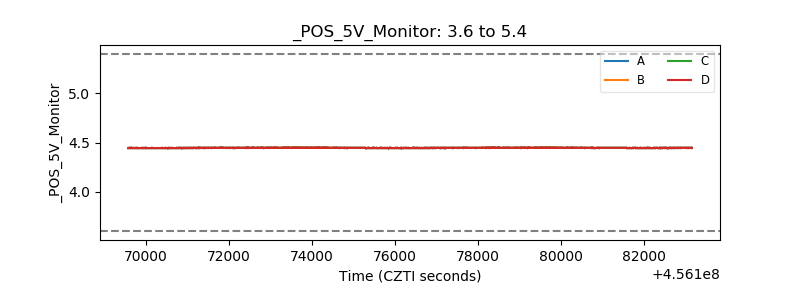 |
| _ROLL_ROT | 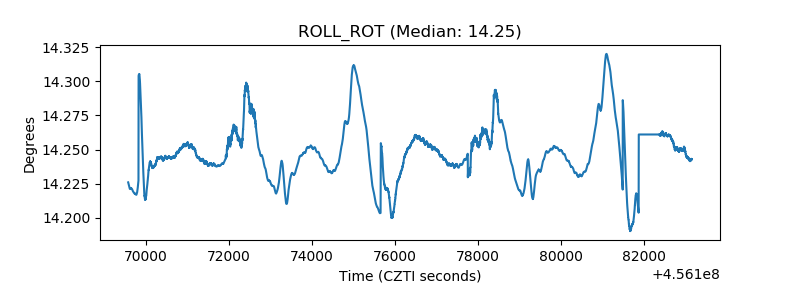 |
| _Roll_DEC | 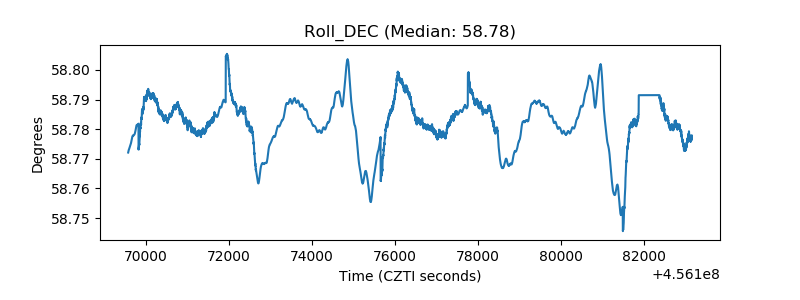 |
| _Roll_RA | 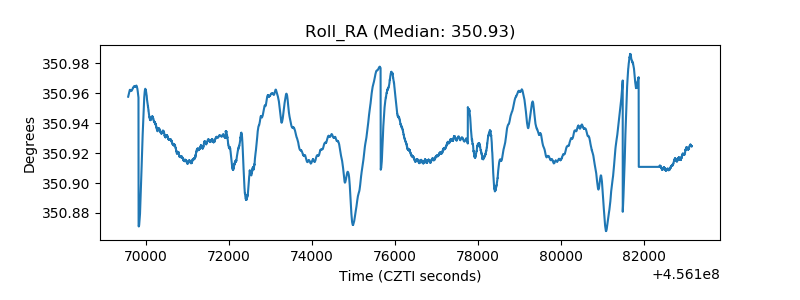 |
| Veto Counter | 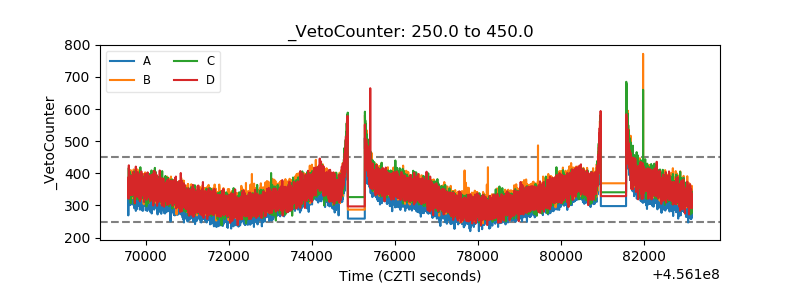 |