| Param | Original file | Final file |
|---|---|---|
| Filename | modeM0/AS1C09_003T01_9000006298_47151cztM0_level2.fits | modeM0/AS1C09_003T01_9000006298_47151cztM0_level2_quad_clean.evt |
| Size (bytes) | 489,476,160 | 112,803,840 |
| Size | 466.8 MB | 107.6 MB |
| Events in quadrant A | 7,103,911 | 739,778 |
| Events in quadrant B | 3,659,981 | 766,845 |
| Events in quadrant C | 3,302,767 | 730,797 |
| Events in quadrant D | 3,501,383 | 683,833 |
| Mode M9 | |||
|---|---|---|---|
| Quadrant | BADHDUFLAG | Total packets | Discarded packets |
| A | 0 | 16 | 0 |
| B | 0 | 16 | 0 |
| C | 0 | 16 | 0 |
| D | 0 | 16 | 0 |
| Mode M0 | |||
|---|---|---|---|
| Quadrant | BADHDUFLAG | Total packets | Discarded packets |
| A | 0 | 25900 | 2 |
| B | 0 | 15931 | 2 |
| C | 0 | 15141 | 2 |
| D | 0 | 15658 | 2 |
| Mode SS | |||
|---|---|---|---|
| Quadrant | BADHDUFLAG | Total packets | Discarded packets |
| A | 0 | 146 | 0 |
| B | 0 | 146 | 0 |
| C | 0 | 146 | 0 |
| D | 0 | 146 | 0 |
| Quadrant | Total seconds | Saturated seconds | Saturation percentage |
|---|---|---|---|
| A | 7095 | 360 | 5.073996% |
| B | 7095 | 96 | 1.353066% |
| C | 7096 | 85 | 1.197858% |
| D | 7096 | 79 | 1.113303% |
Noise dominated data is calculated using 1-second bins in cleaned event files. If a bin has >2000 counts, and if more than 50% of those come from <1% of pixels, then it is considered to be noise-dominated and hence unusable.
| Quadrant | # 1 sec bins | Bins with >0 counts | Bins with >2000 counts | High rate bins dominated by noise | Noise dominated (total time) | Noise dominated (detector-on time) | Marked lightcurve |
|---|---|---|---|---|---|---|---|
| A | 8755 | 7097 | 113 | 113 | 1.29% | 1.59% | 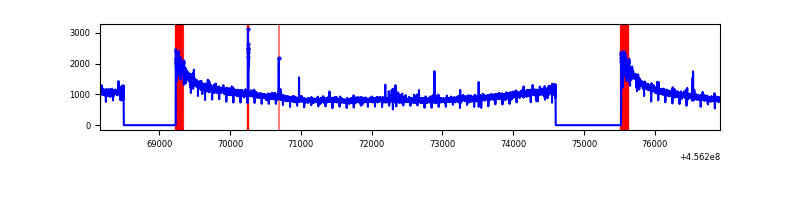 |
| B | 8755 | 7097 | 22 | 22 | 0.25% | 0.31% | 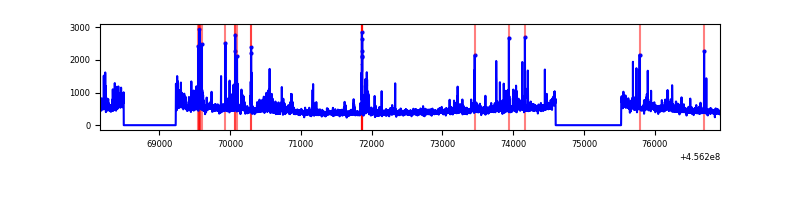 |
| C | 8756 | 7098 | 42 | 42 | 0.48% | 0.59% | 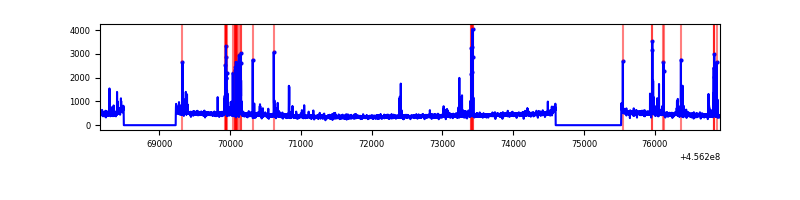 |
| D | 8756 | 7098 | 42 | 42 | 0.48% | 0.59% | 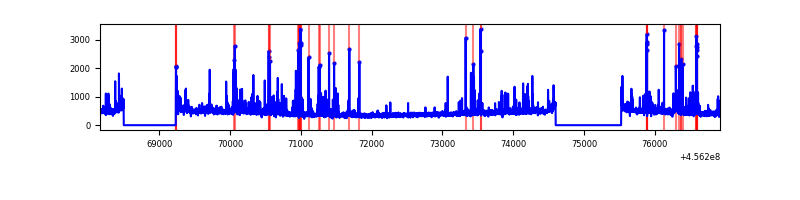 |
Top three noisy pixels from each quadrant. If the there are fewer than three noisy pixels in the level2.evt file, extra rows are filled as -1
| Pixel properties | Quadrant properties | ||||||
|---|---|---|---|---|---|---|---|
| Quadrant | DetID | PixID | Counts | Sigma | Mean | Median | Sigma |
| A | 10 | 83 | 4036426 | 25247.86 | 774 | 758 | 159.8 |
| A | 9 | 191 | 20215 | 121.73 | 774 | 758 | 159.8 |
| A | 0 | 243 | 16910 | 101.05 | 774 | 758 | 159.8 |
| B | 4 | 21 | 194744 | 1252.41 | 778 | 752 | 154.9 |
| B | 0 | 200 | 100044 | 641.03 | 778 | 752 | 154.9 |
| B | 0 | 190 | 88119 | 564.04 | 778 | 752 | 154.9 |
| C | 14 | 254 | 260146 | 1439.29 | 764 | 768 | 180.2 |
| C | 12 | 2 | 35537 | 192.93 | 764 | 768 | 180.2 |
| C | 3 | 233 | 10309 | 52.94 | 764 | 768 | 180.2 |
| D | 12 | 1 | 218461 | 1129.56 | 768 | 743 | 192.7 |
| D | 1 | 47 | 74057 | 380.37 | 768 | 743 | 192.7 |
| D | 5 | 171 | 41058 | 209.16 | 768 | 743 | 192.7 |
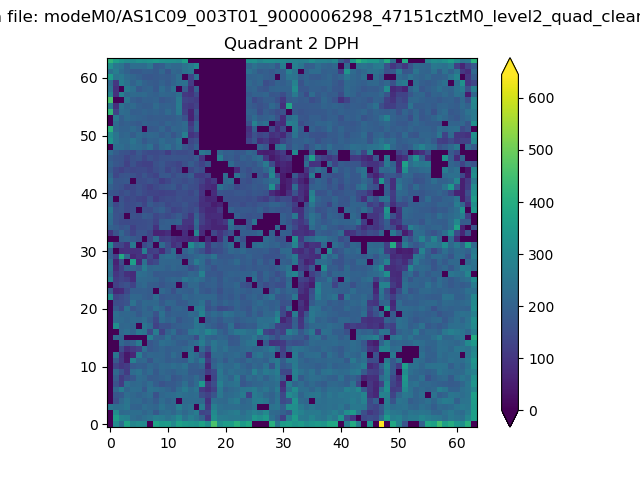
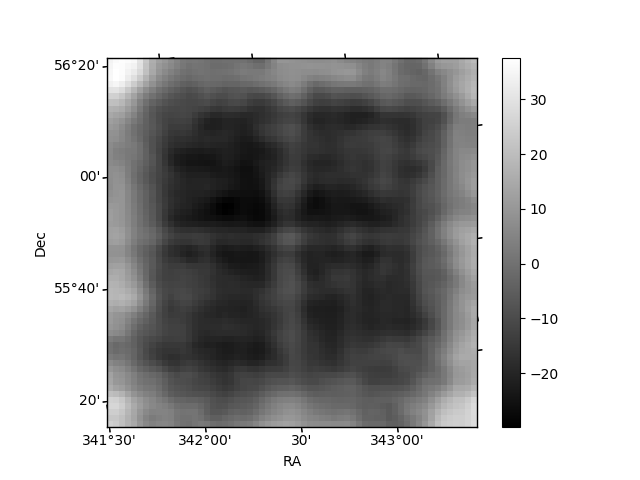
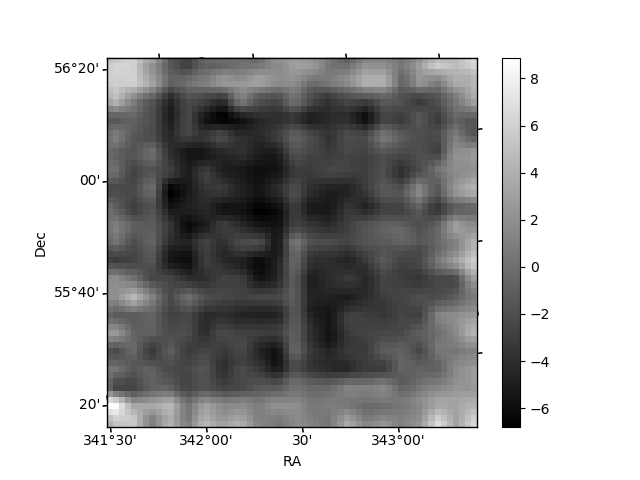
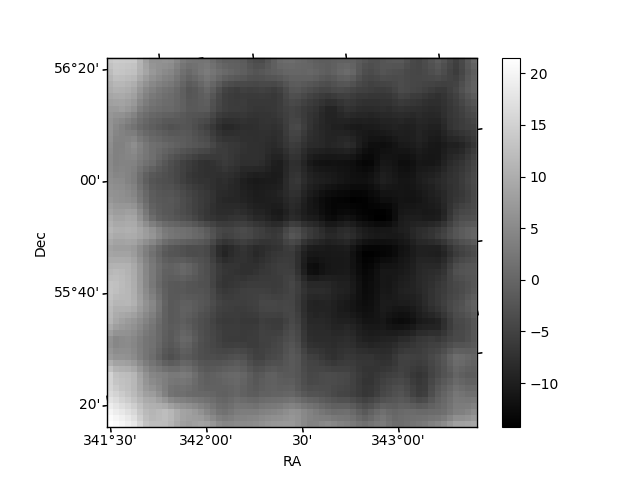
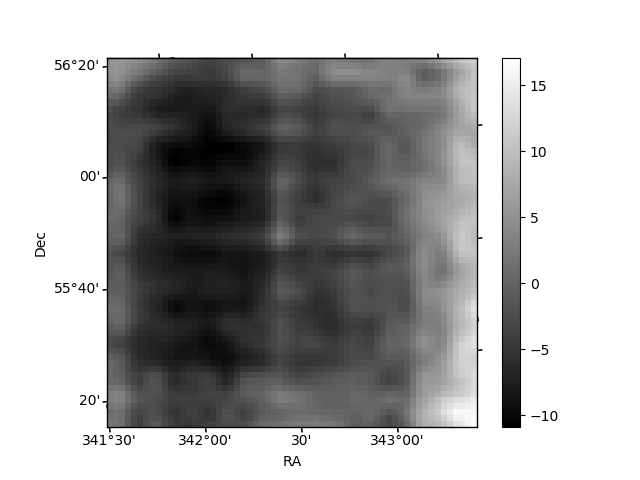
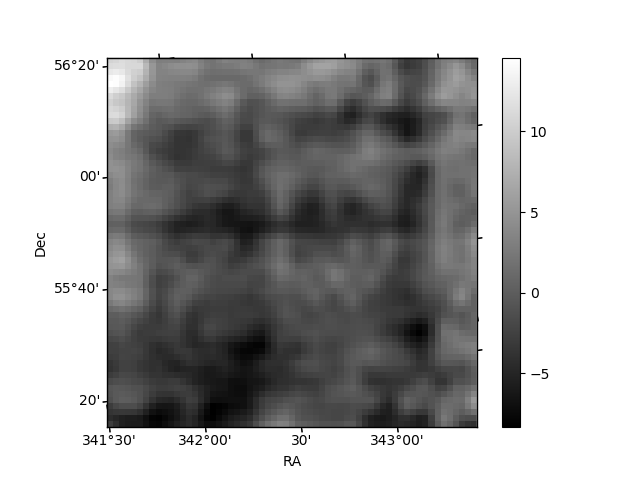
Histogram calculated using DETX and DETY for each event in the final _common_clean file
| Quadrant A | 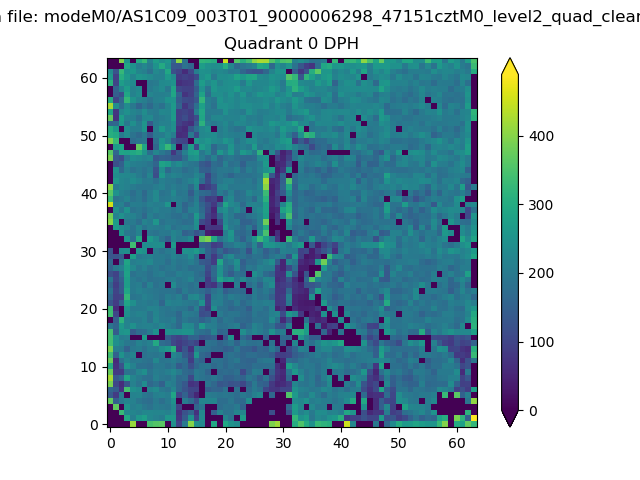 |
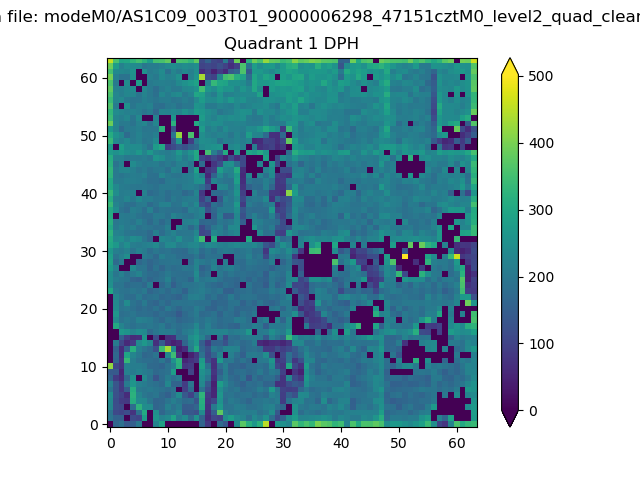 |
Quadrant B |
|---|---|---|---|
| Quadrant D | 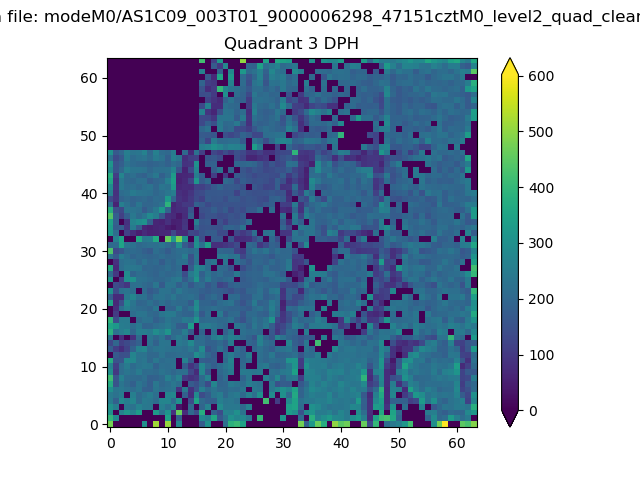 |
 |
Quadrant C |
| Plot type | Count rate plots | Images |
|---|---|---|
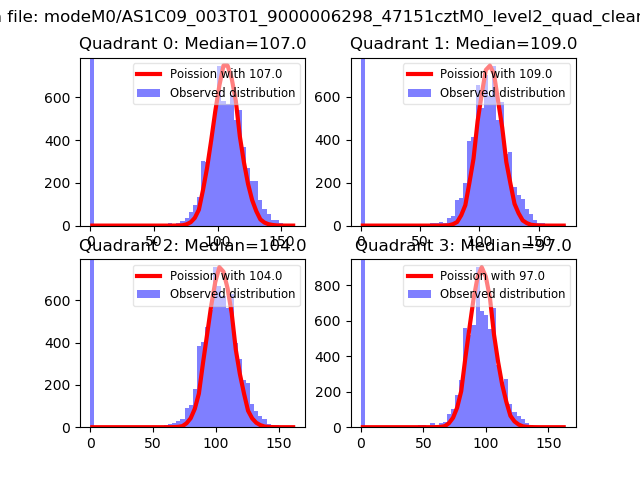
| Comparison with Poisson distribution Blue bars denote a histogram of data divided into 1 sec bins. Red curve is a Poisson curve with rate = median count rate of data. |
 |
 |
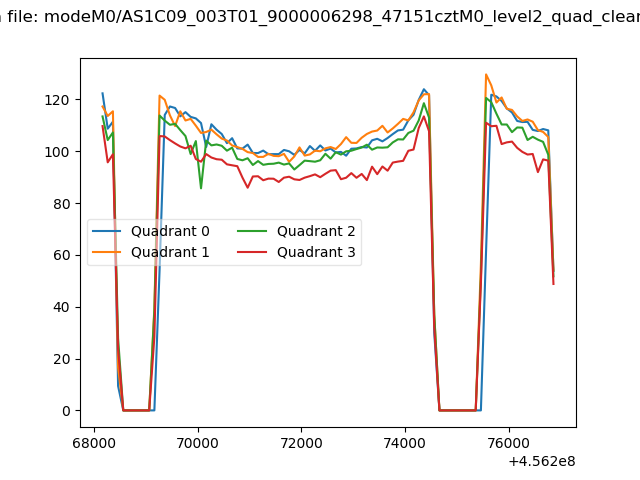
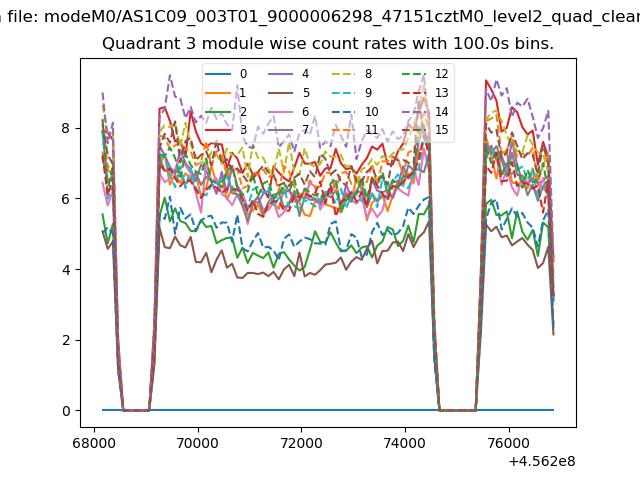
| Quadrant-wise count rates Data is divided into 100 sec bins |
 |
|
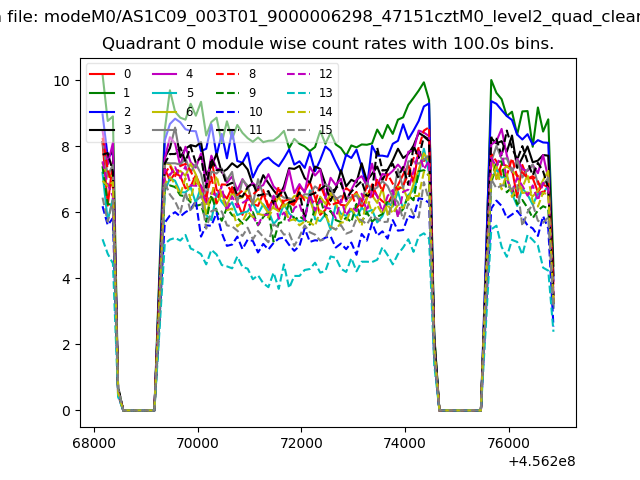
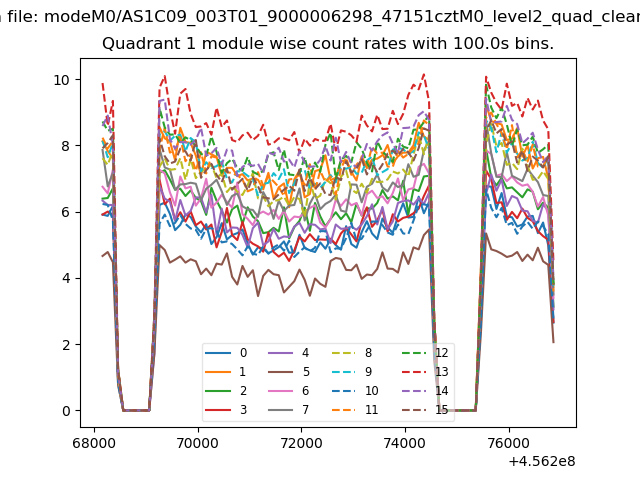
| Module-wise count rates for Quadrant A Data is divided into 100 sec bins |
 |
 |
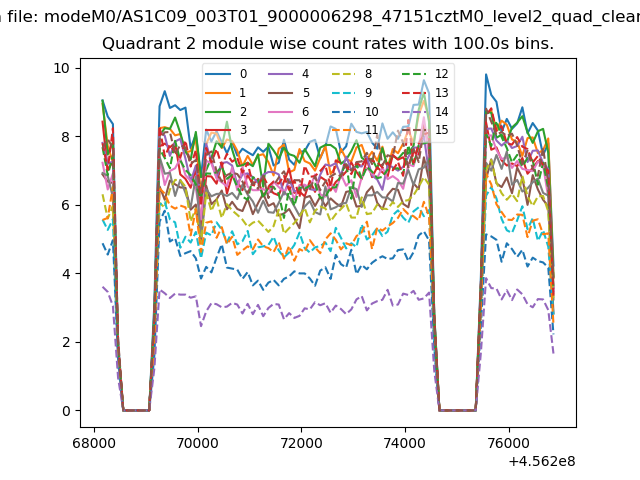
| Module-wise count rates for Quadrant B Data is divided into 100 sec bins |
 |
 |
| Module-wise count rates for Quadrant C Data is divided into 100 sec bins |
 |
 |
| Module-wise count rates for Quadrant D Data is divided into 100 sec bins |
 |
 |
| Parameter | Plot |
|---|---|
| CZT HV Monitor | 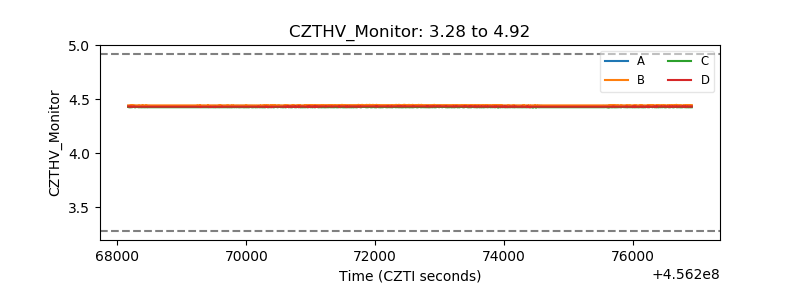 |
| D_VDD | 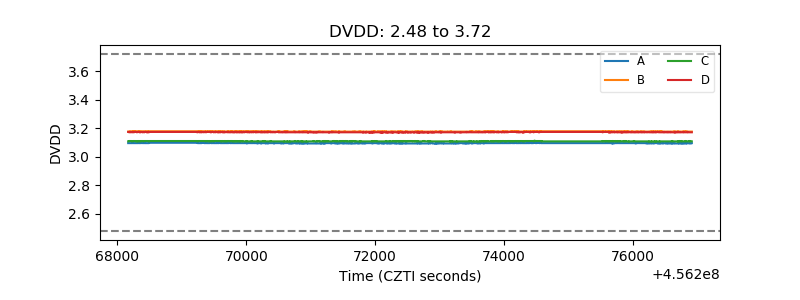 |
| Temperature 1 | 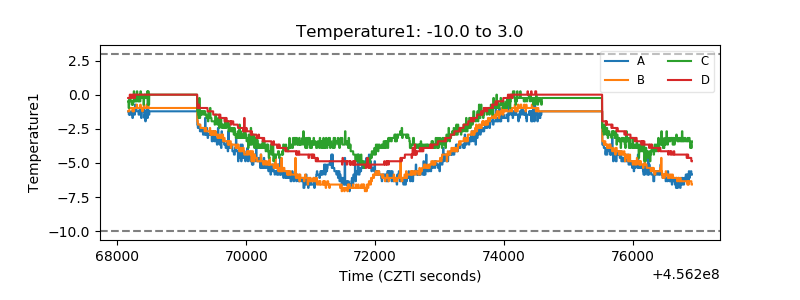 |
| Veto HV Monitor |  |
| Veto LLD | 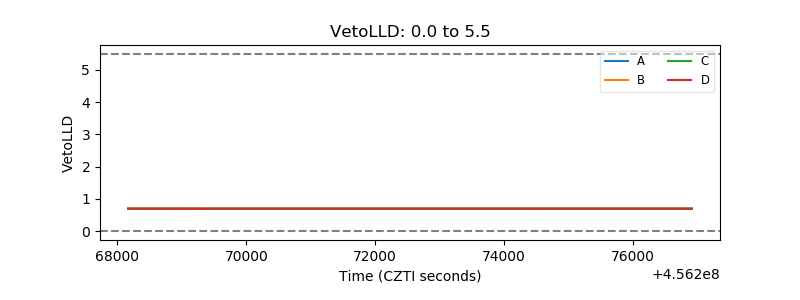 |
| Alpha Counter | 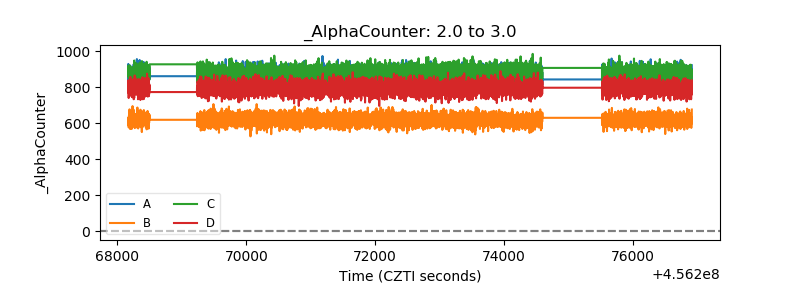 |
| _CPM_Rate | 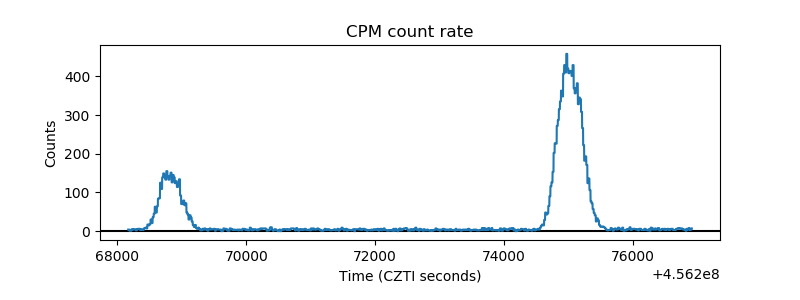 |
| CZT Counter | 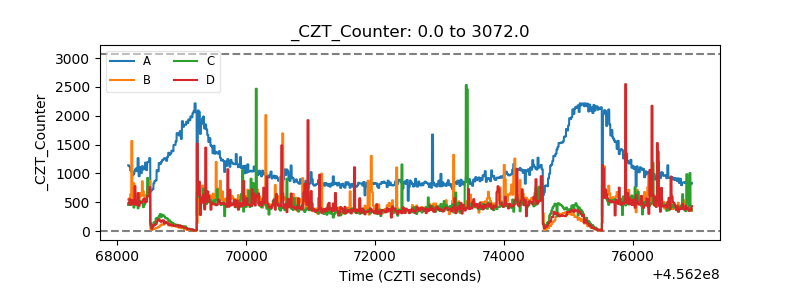 |
| +2.5 Volts monitor | 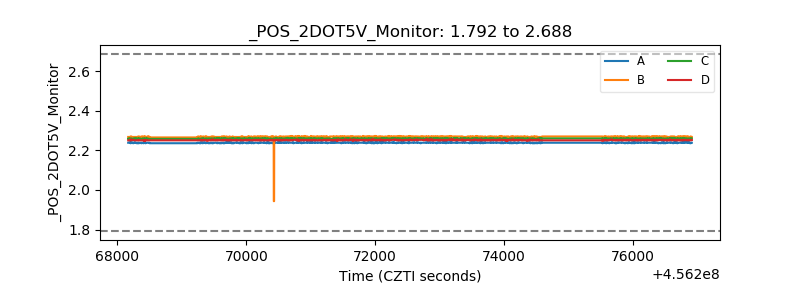 |
| +5 Volts monitor | 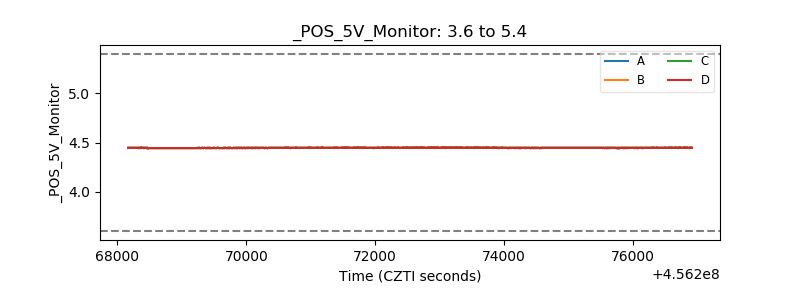 |
| _ROLL_ROT | 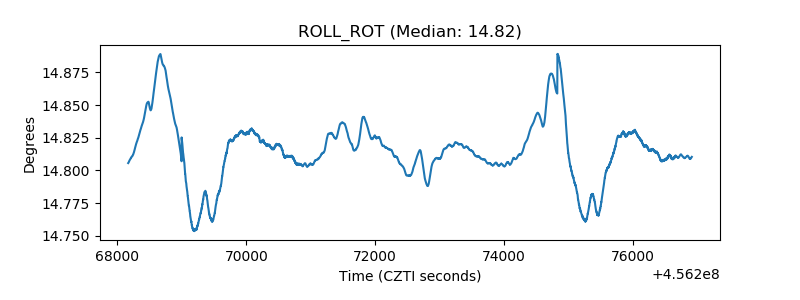 |
| _Roll_DEC | 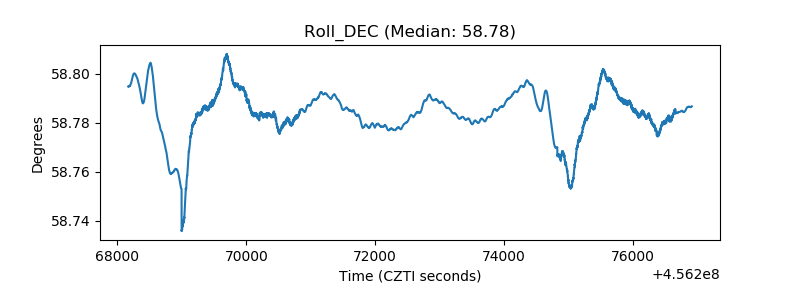 |
| _Roll_RA | 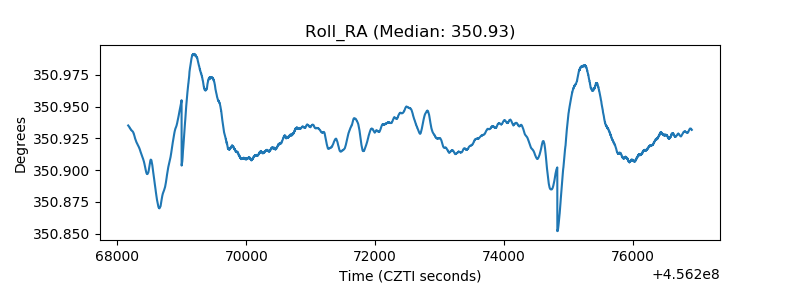 |
| Veto Counter | 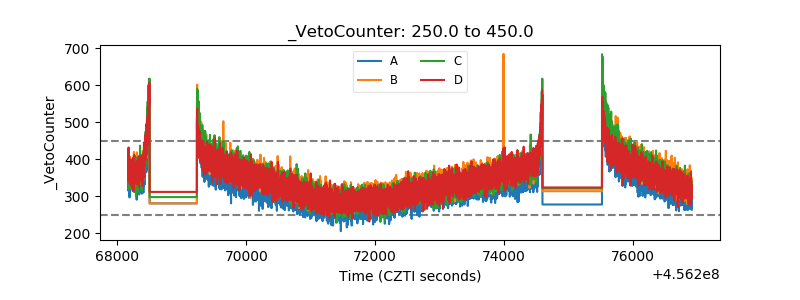 |