| Param | Original file | Final file |
|---|---|---|
| Filename | modeM0/AS1C09_003T01_9000006298_47160cztM0_level2.fits | modeM0/AS1C09_003T01_9000006298_47160cztM0_level2_quad_clean.evt |
| Size (bytes) | 534,936,960 | 126,498,240 |
| Size | 510.2 MB | 120.6 MB |
| Events in quadrant A | 7,754,557 | 844,489 |
| Events in quadrant B | 3,898,064 | 867,208 |
| Events in quadrant C | 3,506,892 | 810,213 |
| Events in quadrant D | 4,021,448 | 751,922 |
| Mode M0 | |||
|---|---|---|---|
| Quadrant | BADHDUFLAG | Total packets | Discarded packets |
| A | 0 | 28668 | 0 |
| B | 0 | 17156 | 0 |
| C | 0 | 16636 | 0 |
| D | 0 | 17852 | 0 |
| Mode SS | |||
|---|---|---|---|
| Quadrant | BADHDUFLAG | Total packets | Discarded packets |
| A | 0 | 160 | 0 |
| B | 0 | 160 | 0 |
| C | 0 | 160 | 0 |
| D | 0 | 160 | 0 |
| Quadrant | Total seconds | Saturated seconds | Saturation percentage |
|---|---|---|---|
| A | 8002 | 195 | 2.436891% |
| B | 8002 | 81 | 1.012247% |
| C | 8002 | 37 | 0.462384% |
| D | 8002 | 76 | 0.949763% |
Noise dominated data is calculated using 1-second bins in cleaned event files. If a bin has >2000 counts, and if more than 50% of those come from <1% of pixels, then it is considered to be noise-dominated and hence unusable.
| Quadrant | # 1 sec bins | Bins with >0 counts | Bins with >2000 counts | High rate bins dominated by noise | Noise dominated (total time) | Noise dominated (detector-on time) | Marked lightcurve |
|---|---|---|---|---|---|---|---|
| A | 8002 | 8002 | 8 | 8 | 0.10% | 0.10% |  |
| B | 8002 | 8002 | 19 | 19 | 0.24% | 0.24% |  |
| C | 8002 | 8002 | 25 | 25 | 0.31% | 0.31% |  |
| D | 8002 | 8002 | 56 | 56 | 0.70% | 0.70% |  |
Top three noisy pixels from each quadrant. If the there are fewer than three noisy pixels in the level2.evt file, extra rows are filled as -1
| Pixel properties | Quadrant properties | ||||||
|---|---|---|---|---|---|---|---|
| Quadrant | DetID | PixID | Counts | Sigma | Mean | Median | Sigma |
| A | 10 | 83 | 4209329 | 23121.21 | 882 | 864 | 182.0 |
| A | 15 | 235 | 59779 | 323.68 | 882 | 864 | 182.0 |
| A | 9 | 191 | 22520 | 118.98 | 882 | 864 | 182.0 |
| B | 0 | 190 | 123066 | 706.92 | 876 | 847 | 172.9 |
| B | 4 | 21 | 75517 | 431.9 | 876 | 847 | 172.9 |
| B | 0 | 200 | 49607 | 282.03 | 876 | 847 | 172.9 |
| C | 14 | 254 | 146888 | 729.48 | 851 | 852 | 200.2 |
| C | 15 | 208 | 22787 | 109.57 | 851 | 852 | 200.2 |
| C | 3 | 233 | 11367 | 52.52 | 851 | 852 | 200.2 |
| D | 12 | 233 | 209368 | 961.58 | 858 | 828 | 216.9 |
| D | 1 | 47 | 75057 | 342.27 | 858 | 828 | 216.9 |
| D | 2 | 249 | 70447 | 321.01 | 858 | 828 | 216.9 |
Histogram calculated using DETX and DETY for each event in the final _common_clean file
| Quadrant A |  |
 |
Quadrant B |
|---|---|---|---|
| Quadrant D |  |
 |
Quadrant C |
| Plot type | Count rate plots | Images |
|---|---|---|
| Comparison with Poisson distribution Blue bars denote a histogram of data divided into 1 sec bins. Red curve is a Poisson curve with rate = median count rate of data. |
 |
 |
| Quadrant-wise count rates Data is divided into 100 sec bins |
 |
|
| Module-wise count rates for Quadrant A Data is divided into 100 sec bins |
 |
 |
| Module-wise count rates for Quadrant B Data is divided into 100 sec bins |
 |
 |
| Module-wise count rates for Quadrant C Data is divided into 100 sec bins |
 |
 |
| Module-wise count rates for Quadrant D Data is divided into 100 sec bins |
 |
 |
| Parameter | Plot |
|---|---|
| CZT HV Monitor |  |
| D_VDD |  |
| Temperature 1 |  |
| Veto HV Monitor |  |
| Veto LLD |  |
| Alpha Counter |  |
| _CPM_Rate |  |
| CZT Counter |  |
| +2.5 Volts monitor | 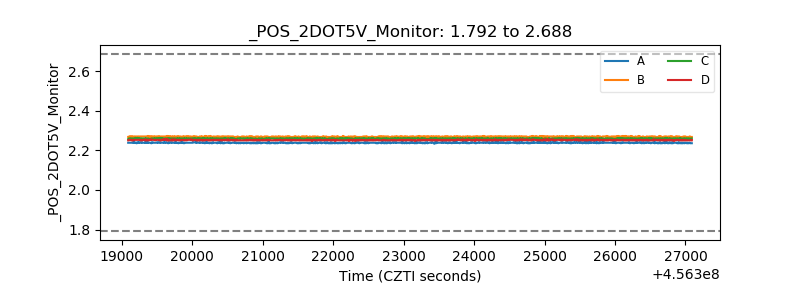 |
| +5 Volts monitor | 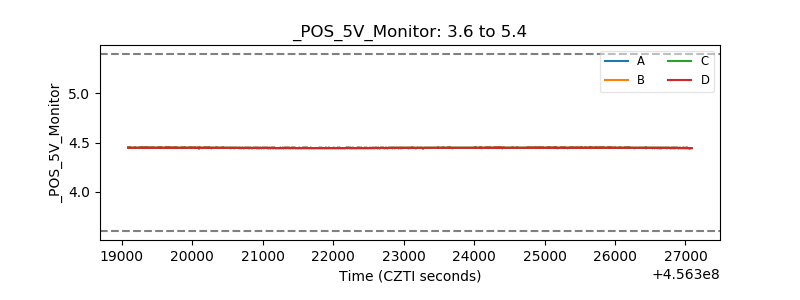 |
| _ROLL_ROT |  |
| _Roll_DEC |  |
| _Roll_RA |  |
| Veto Counter |  |