| Param | Original file | Final file |
|---|---|---|
| Filename | modeM0/AS1A13_037T01_9000006300_47191cztM0_level2.fits | modeM0/AS1A13_037T01_9000006300_47191cztM0_level2_quad_clean.evt |
| Size (bytes) | 576,072,000 | 125,533,440 |
| Size | 549.4 MB | 119.7 MB |
| Events in quadrant A | 7,624,382 | 830,651 |
| Events in quadrant B | 4,091,127 | 865,538 |
| Events in quadrant C | 4,045,161 | 805,215 |
| Events in quadrant D | 4,946,496 | 745,664 |
| Mode SS | |||
|---|---|---|---|
| Quadrant | BADHDUFLAG | Total packets | Discarded packets |
| A | 0 | 160 | 0 |
| B | 0 | 160 | 0 |
| C | 0 | 160 | 0 |
| D | 0 | 160 | 0 |
| Mode M0 | |||
|---|---|---|---|
| Quadrant | BADHDUFLAG | Total packets | Discarded packets |
| A | 0 | 28544 | 11 |
| B | 0 | 17451 | 4 |
| C | 0 | 17791 | 0 |
| D | 0 | 20443 | 9 |
| Quadrant | Total seconds | Saturated seconds | Saturation percentage |
|---|---|---|---|
| A | 7960 | 293 | 3.680905% |
| B | 7961 | 188 | 2.361512% |
| C | 7964 | 187 | 2.348066% |
| D | 7962 | 233 | 2.926400% |
Noise dominated data is calculated using 1-second bins in cleaned event files. If a bin has >2000 counts, and if more than 50% of those come from <1% of pixels, then it is considered to be noise-dominated and hence unusable.
| Quadrant | # 1 sec bins | Bins with >0 counts | Bins with >2000 counts | High rate bins dominated by noise | Noise dominated (total time) | Noise dominated (detector-on time) | Marked lightcurve |
|---|---|---|---|---|---|---|---|
| A | 7964 | 7963 | 3 | 3 | 0.04% | 0.04% |  |
| B | 7964 | 7964 | 18 | 18 | 0.23% | 0.23% |  |
| C | 7964 | 7964 | 101 | 101 | 1.27% | 1.27% |  |
| D | 7964 | 7963 | 130 | 130 | 1.63% | 1.63% |  |
Top three noisy pixels from each quadrant. If the there are fewer than three noisy pixels in the level2.evt file, extra rows are filled as -1
| Pixel properties | Quadrant properties | ||||||
|---|---|---|---|---|---|---|---|
| Quadrant | DetID | PixID | Counts | Sigma | Mean | Median | Sigma |
| A | 10 | 83 | 3959266 | 20737.69 | 911 | 888 | 190.9 |
| A | 9 | 191 | 104570 | 543.18 | 911 | 888 | 190.9 |
| A | 14 | 235 | 30436 | 154.8 | 911 | 888 | 190.9 |
| B | 0 | 190 | 350200 | 1908.23 | 909 | 878 | 183.1 |
| B | 0 | 200 | 51414 | 276.06 | 909 | 878 | 183.1 |
| B | 4 | 21 | 33780 | 179.73 | 909 | 878 | 183.1 |
| C | 14 | 254 | 459347 | 2197.22 | 884 | 885 | 208.7 |
| C | 15 | 208 | 117230 | 557.59 | 884 | 885 | 208.7 |
| C | 3 | 233 | 17418 | 79.24 | 884 | 885 | 208.7 |
| D | 6 | 112 | 1150834 | 5142.92 | 890 | 857 | 223.6 |
| D | 5 | 171 | 76578 | 338.64 | 890 | 857 | 223.6 |
| D | 13 | 171 | 58559 | 258.05 | 890 | 857 | 223.6 |
Histogram calculated using DETX and DETY for each event in the final _common_clean file
| Quadrant A |  |
 |
Quadrant B |
|---|---|---|---|
| Quadrant D |  |
 |
Quadrant C |
| Plot type | Count rate plots | Images |
|---|---|---|
| Comparison with Poisson distribution Blue bars denote a histogram of data divided into 1 sec bins. Red curve is a Poisson curve with rate = median count rate of data. |
 |
 |
| Quadrant-wise count rates Data is divided into 100 sec bins |
 |
|
| Module-wise count rates for Quadrant A Data is divided into 100 sec bins |
 |
 |
| Module-wise count rates for Quadrant B Data is divided into 100 sec bins |
 |
 |
| Module-wise count rates for Quadrant C Data is divided into 100 sec bins |
 |
 |
| Module-wise count rates for Quadrant D Data is divided into 100 sec bins |
 |
 |
| Parameter | Plot |
|---|---|
| CZT HV Monitor |  |
| D_VDD |  |
| Temperature 1 |  |
| Veto HV Monitor |  |
| Veto LLD |  |
| Alpha Counter |  |
| _CPM_Rate |  |
| CZT Counter |  |
| +2.5 Volts monitor | 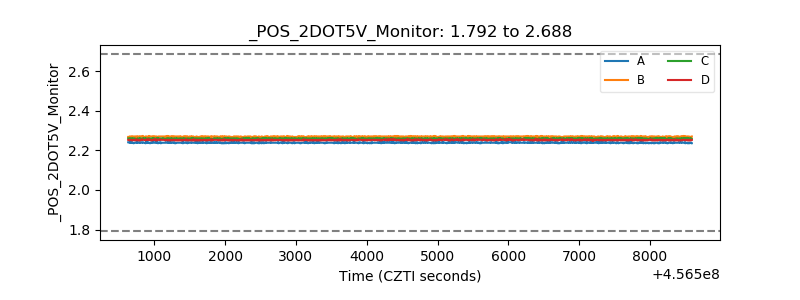 |
| +5 Volts monitor | 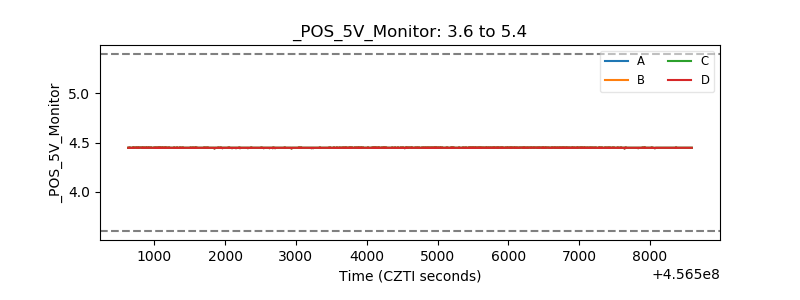 |
| _ROLL_ROT |  |
| _Roll_DEC |  |
| _Roll_RA |  |
| Veto Counter |  |