| Param | Original file | Final file |
|---|---|---|
| Filename | modeM0/AS1C09_005T01_9000006304cztM0_level2.fits | modeM0/AS1C09_005T01_9000006304cztM0_level2_quad_clean.evt |
| Size (bytes) | 1,767,663,360 | 2,648,606,400 |
| Size | 1.6 GB | 2.5 GB |
| Events in quadrant A | 10,108,352 | 16,832,506 |
| Events in quadrant B | 10,144,746 | 17,559,948 |
| Events in quadrant C | 10,633,364 | 17,156,986 |
| Events in quadrant D | 8,836,308 | 14,878,892 |
| Mode SS | |||
|---|---|---|---|
| Quadrant | BADHDUFLAG | Total packets | Discarded packets |
| A | 0 | 3894 | 0 |
| B | 0 | 3894 | 0 |
| C | 0 | 3894 | 0 |
| D | 0 | 3894 | 0 |
| Mode M0 | |||
|---|---|---|---|
| Quadrant | BADHDUFLAG | Total packets | Discarded packets |
| A | 0 | 825137 | 0 |
| B | 0 | 460048 | 0 |
| C | 0 | 420286 | 0 |
| D | 0 | 541911 | 0 |
| Mode M9 | |||
|---|---|---|---|
| Quadrant | BADHDUFLAG | Total packets | Discarded packets |
| A | 0 | 245 | 0 |
| B | 0 | 245 | 0 |
| C | 0 | 245 | 0 |
| D | 0 | 245 | 0 |
| Quadrant | Total seconds | Saturated seconds | Saturation percentage |
|---|---|---|---|
| A | 202053 | 14229 | 7.042212% |
| B | 202069 | 5876 | 2.907918% |
| C | 202079 | 1676 | 0.829379% |
| D | 202065 | 11989 | 5.933239% |
Noise dominated data is calculated using 1-second bins in cleaned event files. If a bin has >2000 counts, and if more than 50% of those come from <1% of pixels, then it is considered to be noise-dominated and hence unusable.
| Quadrant | # 1 sec bins | Bins with >0 counts | Bins with >2000 counts | High rate bins dominated by noise | Noise dominated (total time) | Noise dominated (detector-on time) | Marked lightcurve |
|---|---|---|---|---|---|---|---|
| A | 230411 | 202081 | 0 | 0 | 0.00% | 0.00% | 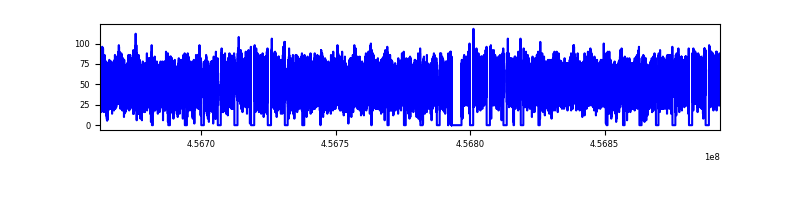 |
| B | 230411 | 202013 | 0 | 0 | 0.00% | 0.00% |  |
| C | 230411 | 202096 | 0 | 0 | 0.00% | 0.00% |  |
| D | 230411 | 201658 | 0 | 0 | 0.00% | 0.00% |  |
Top three noisy pixels from each quadrant. If the there are fewer than three noisy pixels in the level2.evt file, extra rows are filled as -1
| Pixel properties | Quadrant properties | ||||||
|---|---|---|---|---|---|---|---|
| Quadrant | DetID | PixID | Counts | Sigma | Mean | Median | Sigma |
| A | 7 | 110 | 8353 | 8.81 | 2637 | 2461 | 668.4 |
| A | 14 | 95 | 7768 | 7.94 | 2637 | 2461 | 668.4 |
| A | 0 | 29 | 7729 | 7.88 | 2637 | 2461 | 668.4 |
| B | 2 | 9 | 9810 | 13.73 | 2681 | 2548 | 528.8 |
| B | 2 | 8 | 7899 | 10.12 | 2681 | 2548 | 528.8 |
| B | 3 | 17 | 7365 | 9.11 | 2681 | 2548 | 528.8 |
| C | 3 | 202 | 8114 | 7.61 | 2810 | 2618 | 721.8 |
| C | 1 | 81 | 8074 | 7.56 | 2810 | 2618 | 721.8 |
| C | 3 | 203 | 7777 | 7.15 | 2810 | 2618 | 721.8 |
| D | 10 | 189 | 6714 | 6.37 | 2538 | 2302 | 692.2 |
| D | 3 | 14 | 6527 | 6.1 | 2538 | 2302 | 692.2 |
| D | 15 | 47 | 6476 | 6.03 | 2538 | 2302 | 692.2 |
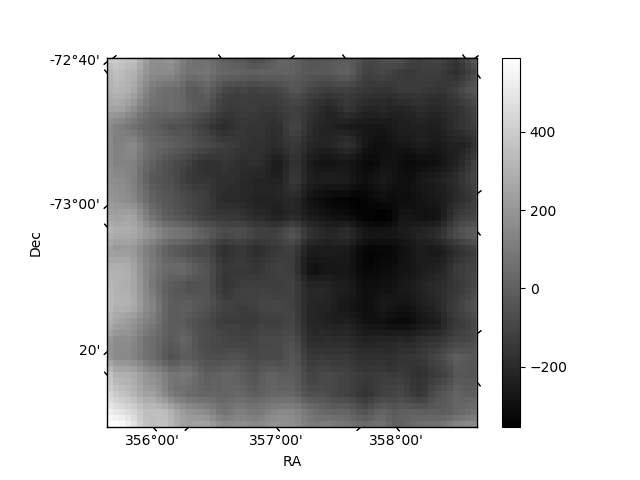
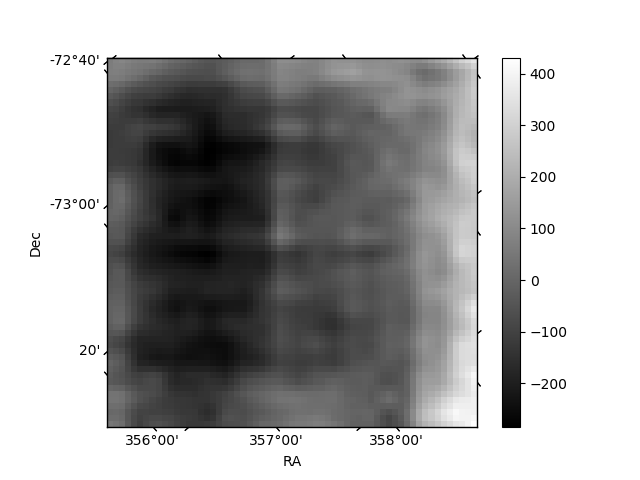
Histogram calculated using DETX and DETY for each event in the final _common_clean file
| Quadrant A | 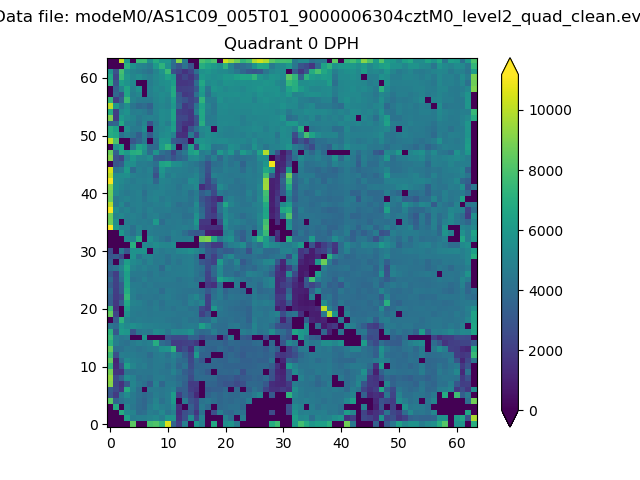 |
 |
Quadrant B |
|---|---|---|---|
| Quadrant D | 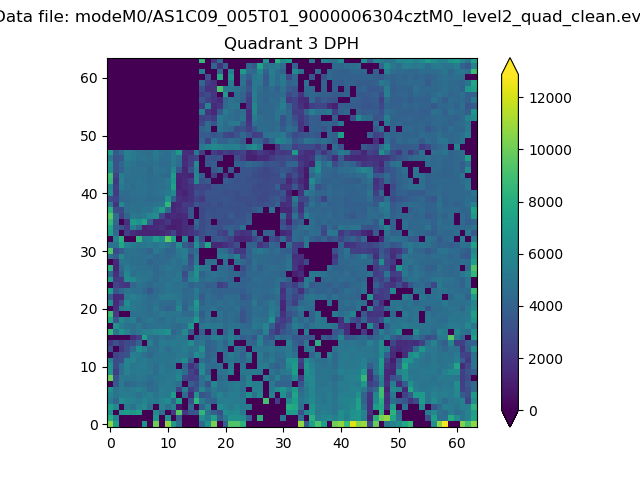 |
 |
Quadrant C |
| Plot type | Count rate plots | Images |
|---|---|---|
| Comparison with Poisson distribution Blue bars denote a histogram of data divided into 1 sec bins. Red curve is a Poisson curve with rate = median count rate of data. |
 |
 |
| Quadrant-wise count rates Data is divided into 100 sec bins |
 |
|
| Module-wise count rates for Quadrant A Data is divided into 100 sec bins |
 |
 |
| Module-wise count rates for Quadrant B Data is divided into 100 sec bins |
 |
 |
| Module-wise count rates for Quadrant C Data is divided into 100 sec bins |
 |
 |
| Module-wise count rates for Quadrant D Data is divided into 100 sec bins |
 |
 |
| Parameter | Plot |
|---|---|
| CZT HV Monitor |  |
| D_VDD | 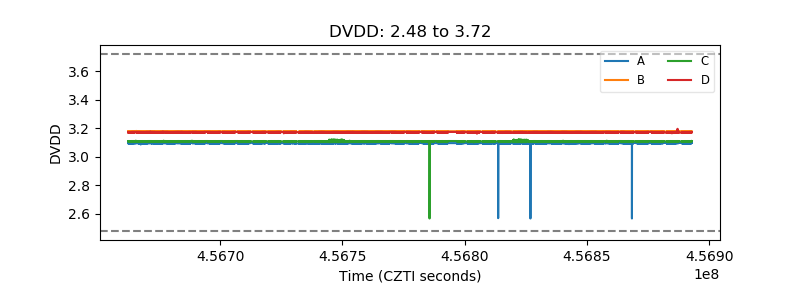 |
| Temperature 1 | 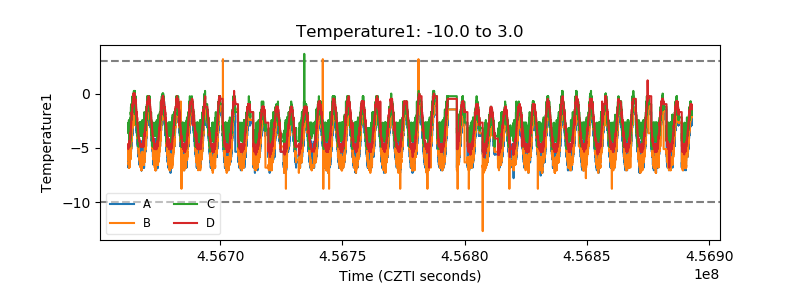 |
| Veto HV Monitor |  |
| Veto LLD | 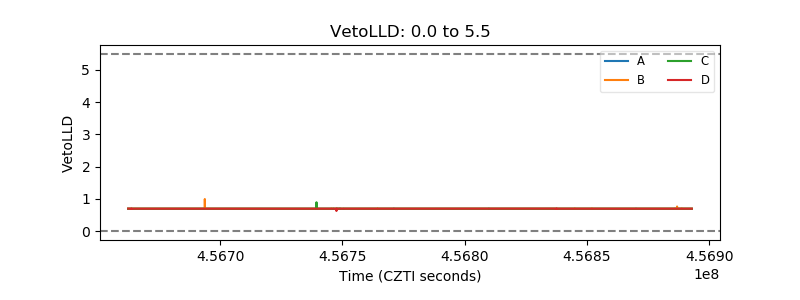 |
| Alpha Counter |  |
| _CPM_Rate | 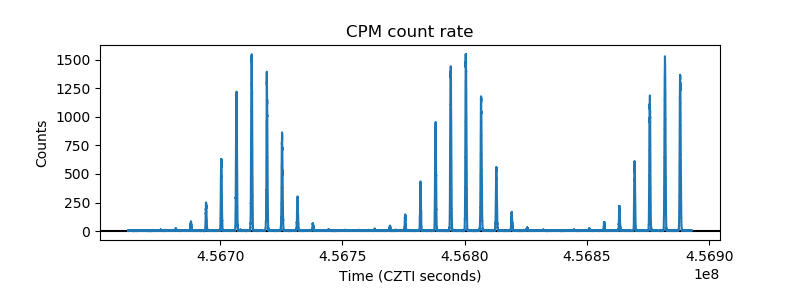 |
| CZT Counter |  |
| +2.5 Volts monitor | 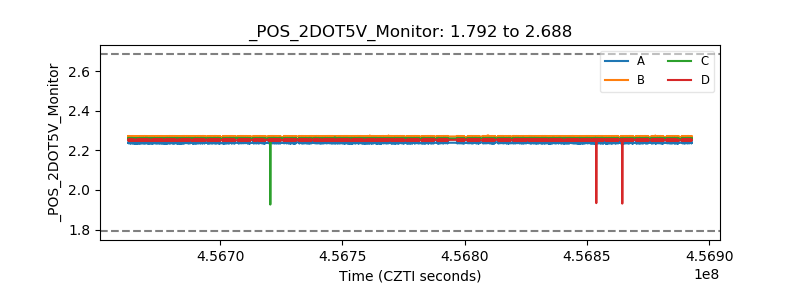 |
| +5 Volts monitor | 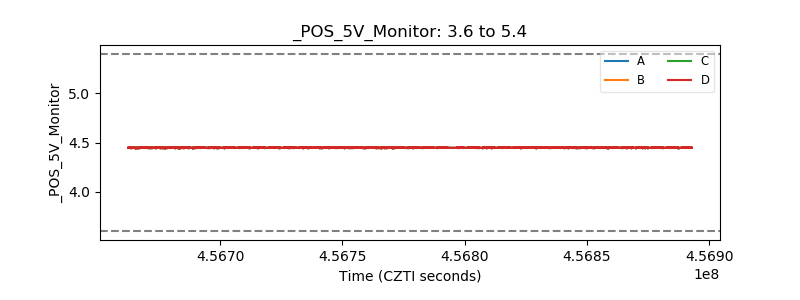 |
| _ROLL_ROT | 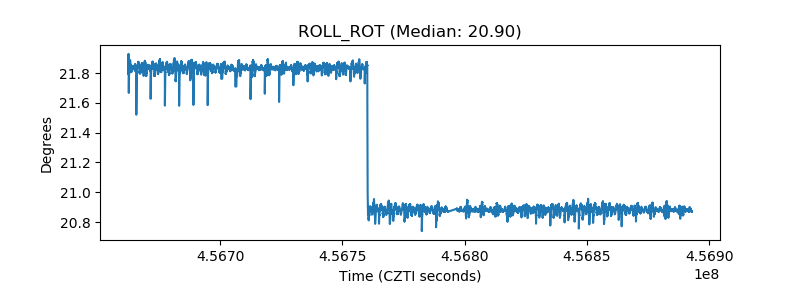 |
| _Roll_DEC |  |
| _Roll_RA |  |
| Veto Counter |  |