| Param | Original file | Final file |
|---|---|---|
| Filename | modeM0/AS1A13_025T01_9000006312_47301cztM0_level2.fits | modeM0/AS1A13_025T01_9000006312_47301cztM0_level2_quad_clean.evt |
| Size (bytes) | 498,755,520 | 109,137,600 |
| Size | 475.7 MB | 104.1 MB |
| Events in quadrant A | 7,913,569 | 668,781 |
| Events in quadrant B | 3,494,574 | 779,303 |
| Events in quadrant C | 3,008,480 | 738,080 |
| Events in quadrant D | 3,548,690 | 671,619 |
| Mode M9 | |||
|---|---|---|---|
| Quadrant | BADHDUFLAG | Total packets | Discarded packets |
| A | 0 | 18 | 0 |
| B | 0 | 19 | 0 |
| C | 0 | 19 | 0 |
| D | 0 | 19 | 0 |
| Mode M0 | |||
|---|---|---|---|
| Quadrant | BADHDUFLAG | Total packets | Discarded packets |
| A | 0 | 27931 | 2 |
| B | 0 | 14684 | 2 |
| C | 0 | 13351 | 2 |
| D | 0 | 15211 | 2 |
| Mode SS | |||
|---|---|---|---|
| Quadrant | BADHDUFLAG | Total packets | Discarded packets |
| A | 0 | 130 | 0 |
| B | 0 | 130 | 0 |
| C | 0 | 130 | 0 |
| D | 0 | 130 | 0 |
| Quadrant | Total seconds | Saturated seconds | Saturation percentage |
|---|---|---|---|
| A | 6406 | 822 | 12.831720% |
| B | 6406 | 135 | 2.107399% |
| C | 6406 | 58 | 0.905401% |
| D | 6406 | 154 | 2.403996% |
Noise dominated data is calculated using 1-second bins in cleaned event files. If a bin has >2000 counts, and if more than 50% of those come from <1% of pixels, then it is considered to be noise-dominated and hence unusable.
| Quadrant | # 1 sec bins | Bins with >0 counts | Bins with >2000 counts | High rate bins dominated by noise | Noise dominated (total time) | Noise dominated (detector-on time) | Marked lightcurve |
|---|---|---|---|---|---|---|---|
| A | 7621 | 6407 | 446 | 446 | 5.85% | 6.96% | 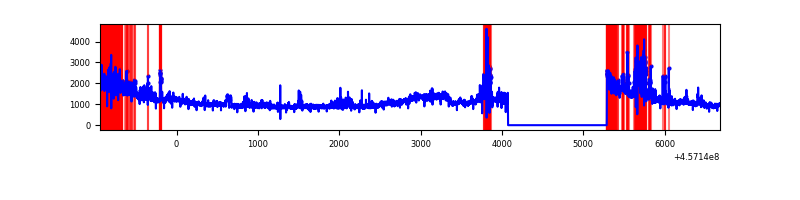 |
| B | 7621 | 6407 | 19 | 19 | 0.25% | 0.30% | 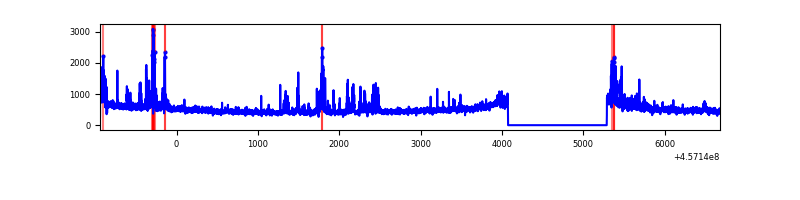 |
| C | 7621 | 6407 | 2 | 2 | 0.03% | 0.03% | 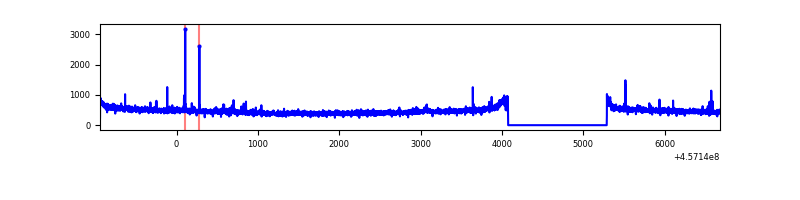 |
| D | 7621 | 6407 | 75 | 75 | 0.98% | 1.17% | 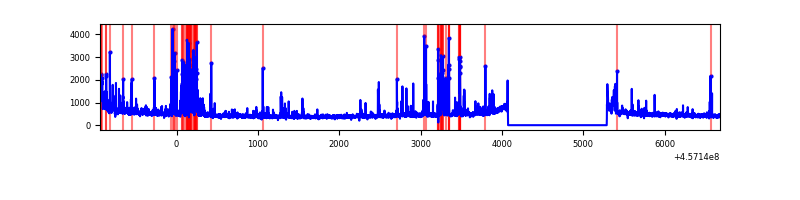 |
Top three noisy pixels from each quadrant. If the there are fewer than three noisy pixels in the level2.evt file, extra rows are filled as -1
| Pixel properties | Quadrant properties | ||||||
|---|---|---|---|---|---|---|---|
| Quadrant | DetID | PixID | Counts | Sigma | Mean | Median | Sigma |
| A | 10 | 83 | 3623707 | 24290.71 | 718 | 704 | 149.2 |
| A | 15 | 235 | 873742 | 5853.35 | 718 | 704 | 149.2 |
| A | 9 | 191 | 577219 | 3865.29 | 718 | 704 | 149.2 |
| B | 0 | 200 | 140618 | 946.07 | 760 | 738 | 147.9 |
| B | 0 | 190 | 123288 | 828.86 | 760 | 738 | 147.9 |
| B | 5 | 171 | 47659 | 317.35 | 760 | 738 | 147.9 |
| C | 3 | 233 | 49929 | 278.81 | 749 | 753 | 176.4 |
| C | 14 | 254 | 21338 | 116.71 | 749 | 753 | 176.4 |
| C | 1 | 3 | 7845 | 40.21 | 749 | 753 | 176.4 |
| D | 12 | 2 | 403126 | 2184.6 | 738 | 716 | 184.2 |
| D | 8 | 176 | 106471 | 574.12 | 738 | 716 | 184.2 |
| D | 7 | 96 | 45433 | 242.76 | 738 | 716 | 184.2 |
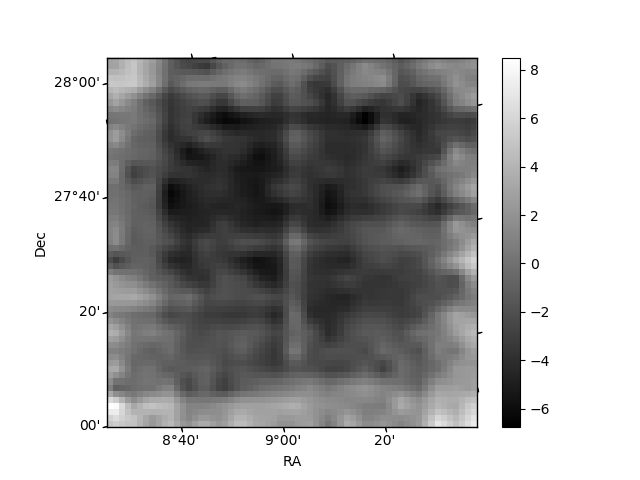
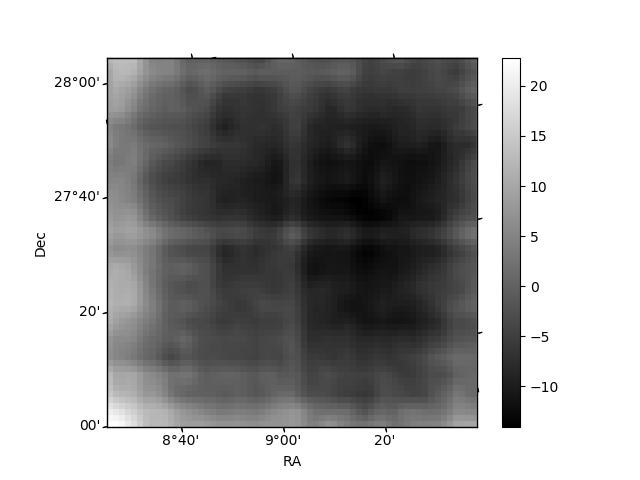
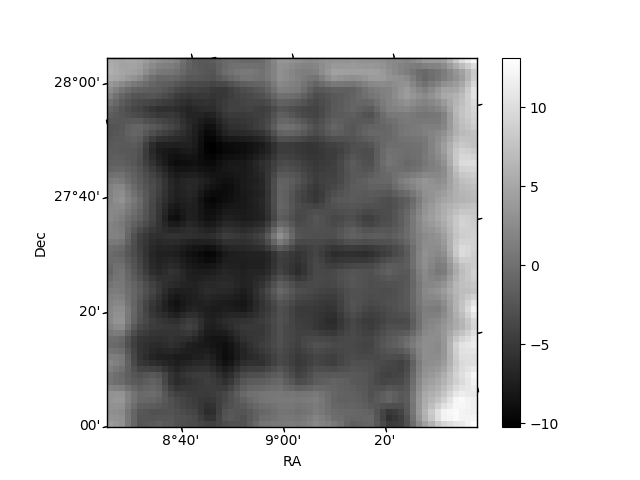
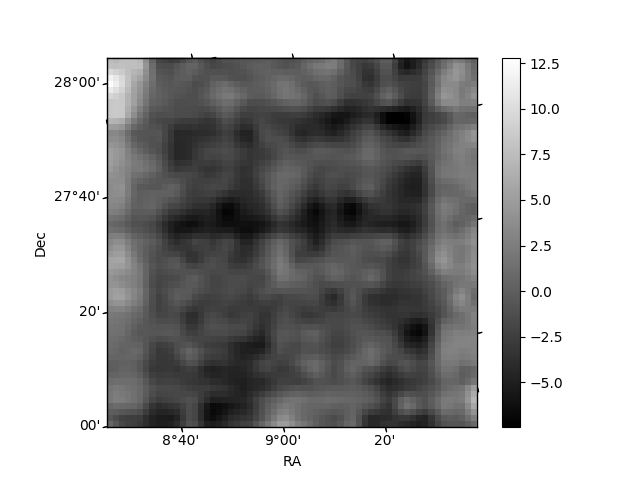
Histogram calculated using DETX and DETY for each event in the final _common_clean file
| Quadrant A | 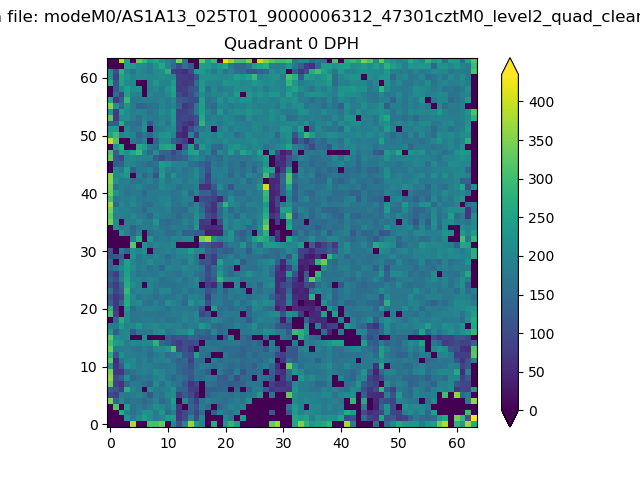 |
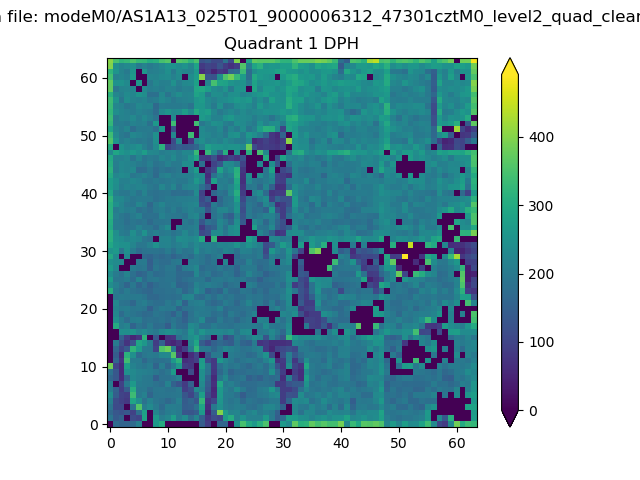 |
Quadrant B |
|---|---|---|---|
| Quadrant D | 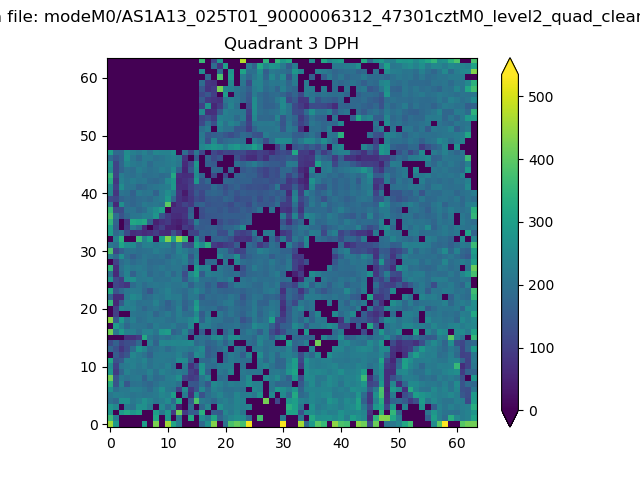 |
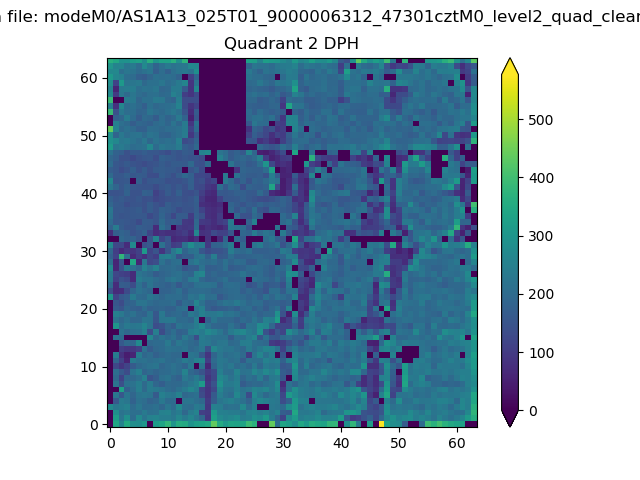 |
Quadrant C |
| Plot type | Count rate plots | Images |
|---|---|---|
| Comparison with Poisson distribution Blue bars denote a histogram of data divided into 1 sec bins. Red curve is a Poisson curve with rate = median count rate of data. |
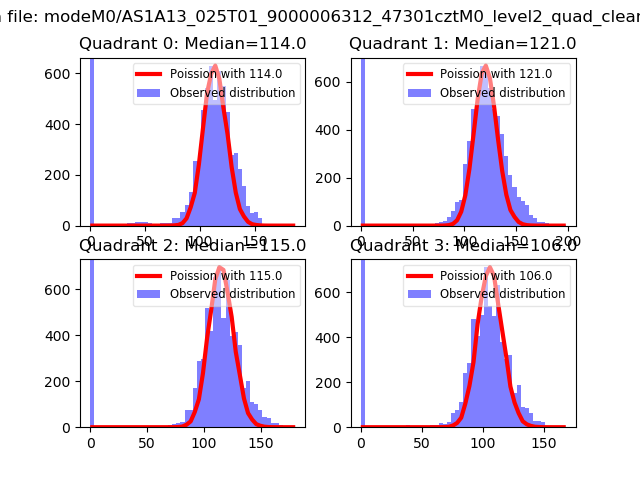 |
 |
| Quadrant-wise count rates Data is divided into 100 sec bins |
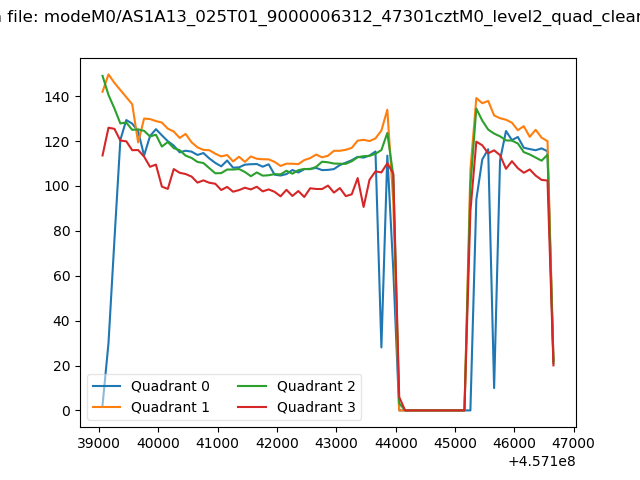 |
|
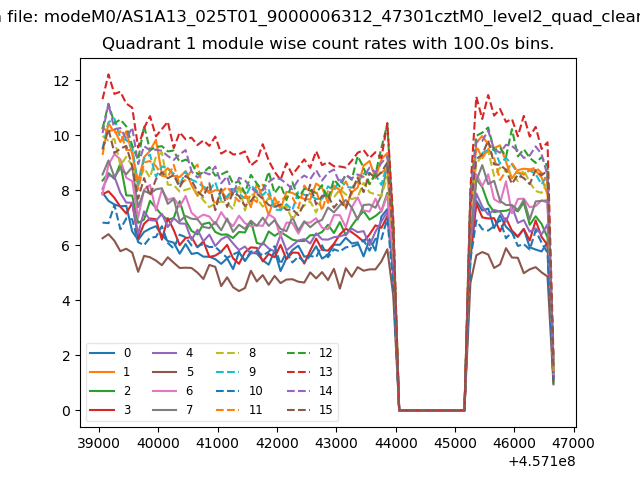
| Module-wise count rates for Quadrant A Data is divided into 100 sec bins |
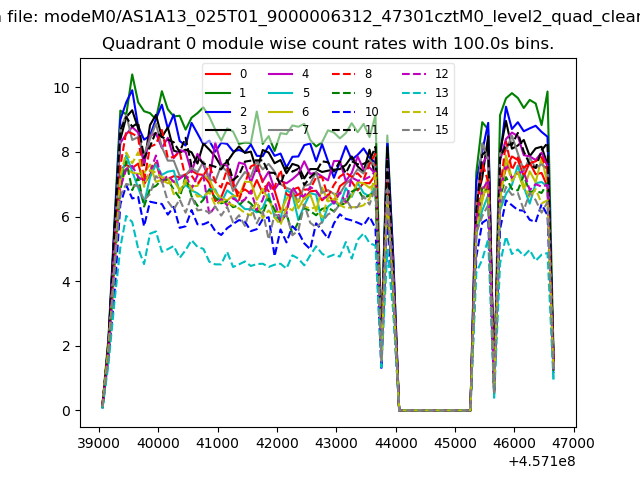 |
 |
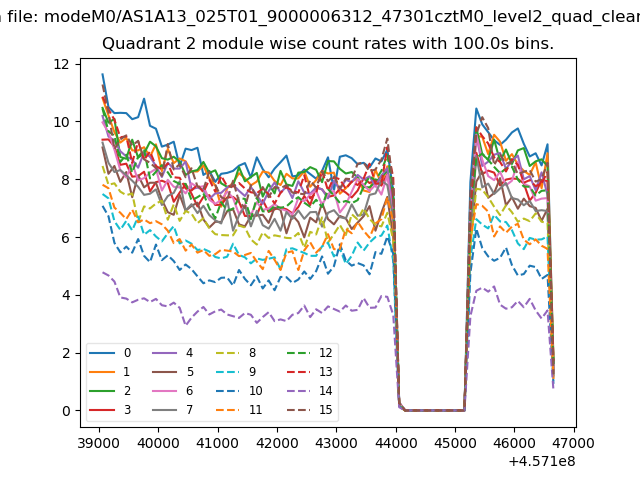
| Module-wise count rates for Quadrant B Data is divided into 100 sec bins |
 |
 |
| Module-wise count rates for Quadrant C Data is divided into 100 sec bins |
 |
 |
| Module-wise count rates for Quadrant D Data is divided into 100 sec bins |
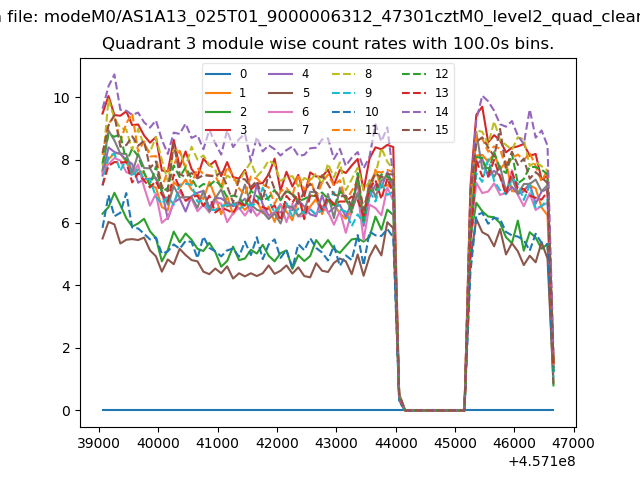 |
 |
| Parameter | Plot |
|---|---|
| CZT HV Monitor | 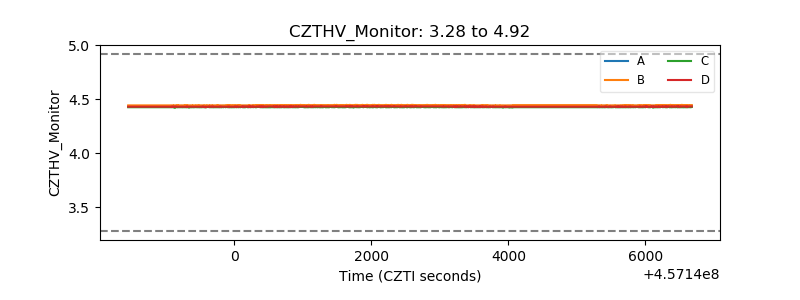 |
| D_VDD | 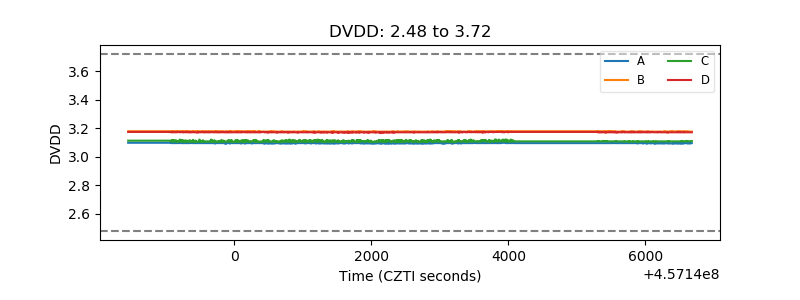 |
| Temperature 1 | 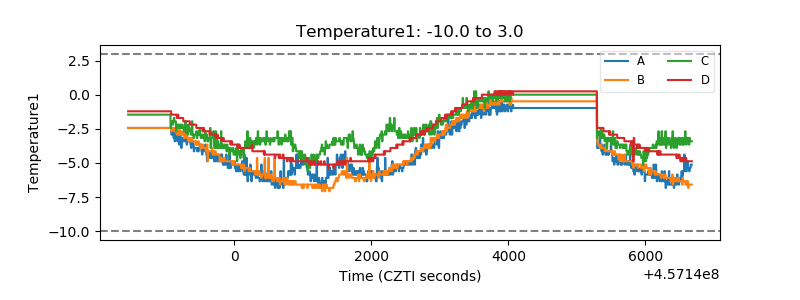 |
| Veto HV Monitor | 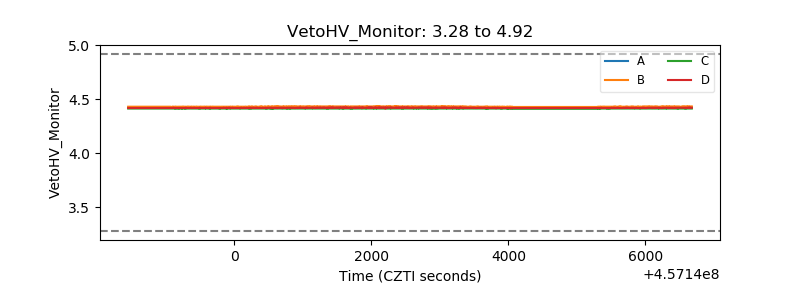 |
| Veto LLD | 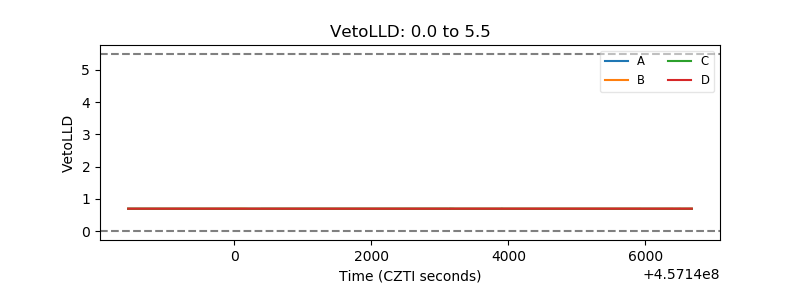 |
| Alpha Counter | 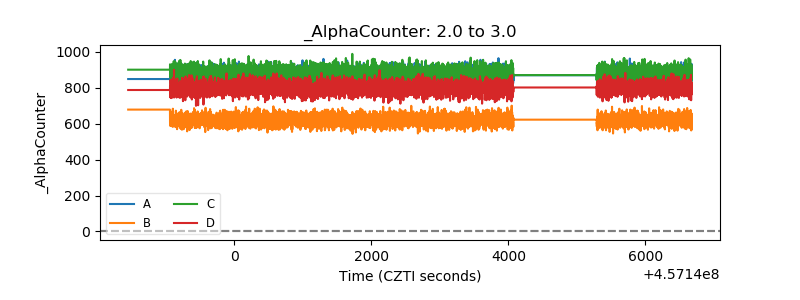 |
| _CPM_Rate | 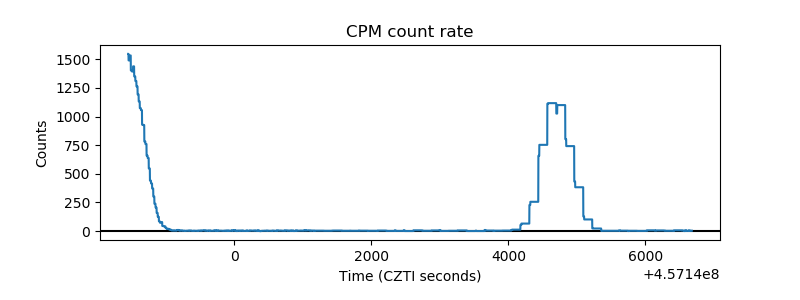 |
| CZT Counter | 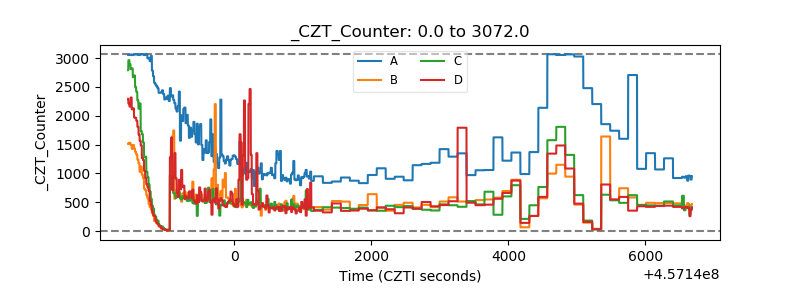 |
| +2.5 Volts monitor | 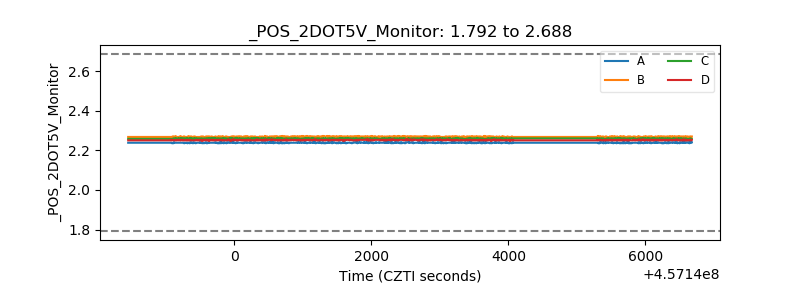 |
| +5 Volts monitor | 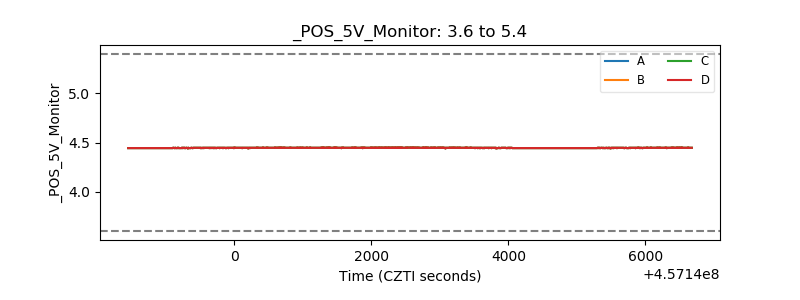 |
| _ROLL_ROT | 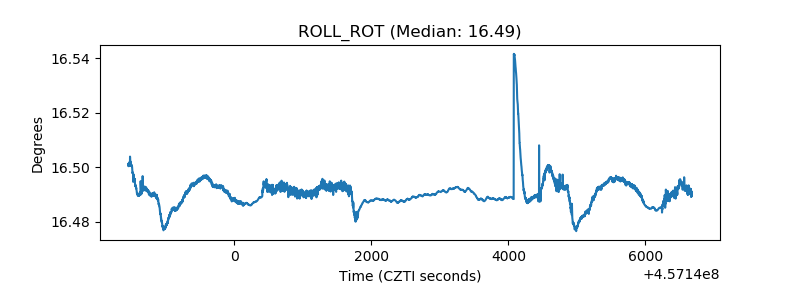 |
| _Roll_DEC | 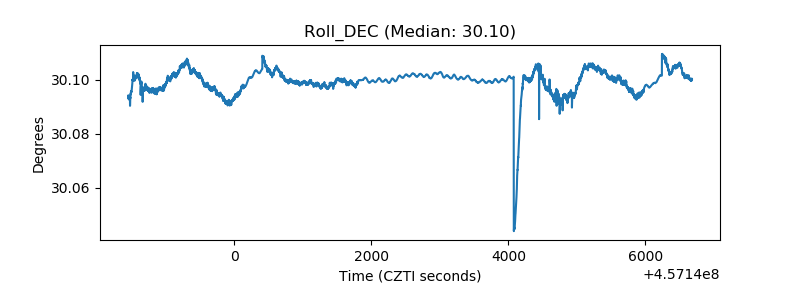 |
| _Roll_RA | 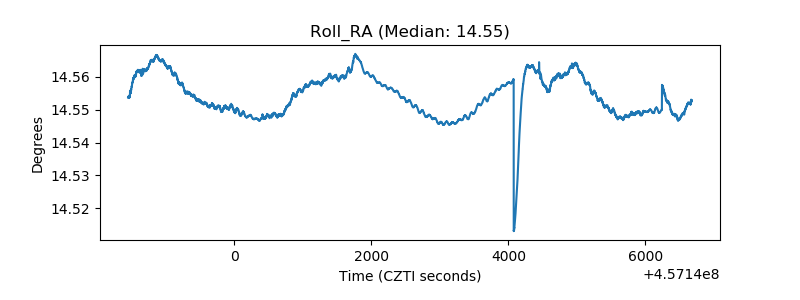 |
| Veto Counter | 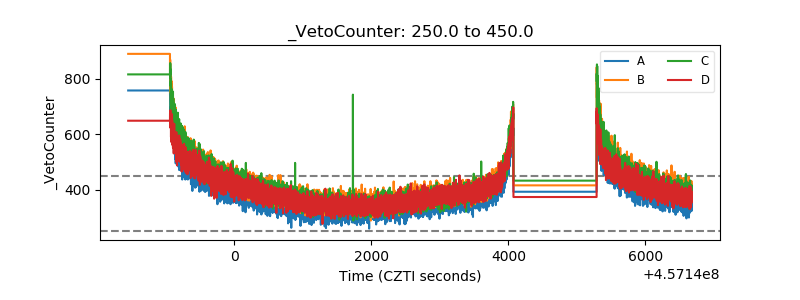 |