| Param | Original file | Final file |
|---|---|---|
| Filename | modeM0/AS1C09_008T04_9000006308cztM0_level2.fits | modeM0/AS1C09_008T04_9000006308cztM0_level2_quad_clean.evt |
| Size (bytes) | 37,969,920 | 31,008,960 |
| Size | 36.2 MB | 29.6 MB |
| Events in quadrant A | 190,966 | 134,638 |
| Events in quadrant B | 236,456 | 183,240 |
| Events in quadrant C | 243,532 | 171,259 |
| Events in quadrant D | 168,638 | 140,321 |
| Mode M0 | |||
|---|---|---|---|
| Quadrant | BADHDUFLAG | Total packets | Discarded packets |
| A | 0 | 17195 | 0 |
| B | 0 | 9956 | 0 |
| C | 0 | 9738 | 0 |
| D | 0 | 13166 | 0 |
| Mode M9 | |||
|---|---|---|---|
| Quadrant | BADHDUFLAG | Total packets | Discarded packets |
| A | 0 | 1 | 0 |
| B | 0 | 1 | 0 |
| C | 0 | 1 | 0 |
| D | 0 | 1 | 0 |
| Mode SS | |||
|---|---|---|---|
| Quadrant | BADHDUFLAG | Total packets | Discarded packets |
| A | 0 | 94 | 0 |
| B | 0 | 102 | 0 |
| C | 0 | 105 | 0 |
| D | 0 | 98 | 0 |
| Quadrant | Total seconds | Saturated seconds | Saturation percentage |
|---|---|---|---|
| A | 3963 | 522 | 13.171840% |
| B | 4698 | 157 | 3.341848% |
| C | 4714 | 116 | 2.460755% |
| D | 4010 | 595 | 14.837905% |
Noise dominated data is calculated using 1-second bins in cleaned event files. If a bin has >2000 counts, and if more than 50% of those come from <1% of pixels, then it is considered to be noise-dominated and hence unusable.
| Quadrant | # 1 sec bins | Bins with >0 counts | Bins with >2000 counts | High rate bins dominated by noise | Noise dominated (total time) | Noise dominated (detector-on time) | Marked lightcurve |
|---|---|---|---|---|---|---|---|
| A | 9806 | 4765 | 0 | 0 | 0.00% | 0.00% |  |
| B | 9813 | 5436 | 0 | 0 | 0.00% | 0.00% |  |
| C | 9817 | 5503 | 0 | 0 | 0.00% | 0.00% | 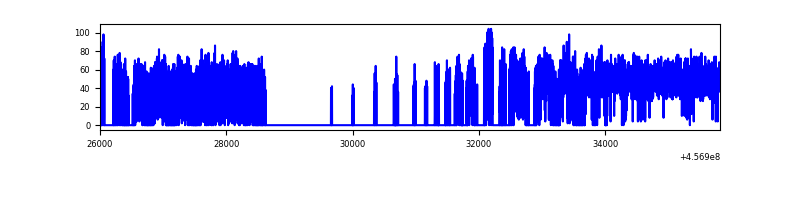 |
| D | 9817 | 4742 | 0 | 0 | 0.00% | 0.00% |  |
Top three noisy pixels from each quadrant. If the there are fewer than three noisy pixels in the level2.evt file, extra rows are filled as -1
| Pixel properties | Quadrant properties | ||||||
|---|---|---|---|---|---|---|---|
| Quadrant | DetID | PixID | Counts | Sigma | Mean | Median | Sigma |
| A | 0 | 29 | 156 | 7.53 | 49 | 46 | 14.6 |
| A | 7 | 30 | 155 | 7.47 | 49 | 46 | 14.6 |
| A | 0 | 30 | 150 | 7.12 | 49 | 46 | 14.6 |
| B | 2 | 9 | 235 | 11.68 | 62 | 59 | 15.1 |
| B | 2 | 8 | 184 | 8.3 | 62 | 59 | 15.1 |
| B | 3 | 17 | 183 | 8.23 | 62 | 59 | 15.1 |
| C | 3 | 187 | 180 | 6.56 | 64 | 59 | 18.5 |
| C | 3 | 158 | 175 | 6.29 | 64 | 59 | 18.5 |
| C | 3 | 202 | 173 | 6.18 | 64 | 59 | 18.5 |
| D | 10 | 113 | 143 | 6.63 | 48 | 43 | 15.1 |
| D | 15 | 63 | 136 | 6.17 | 48 | 43 | 15.1 |
| D | 10 | 114 | 128 | 5.64 | 48 | 43 | 15.1 |
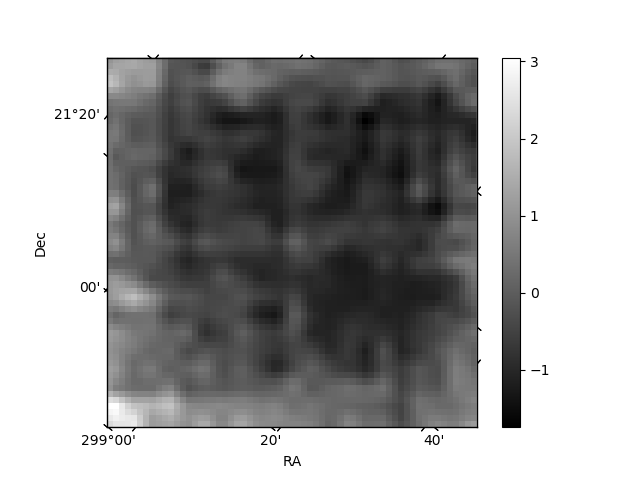
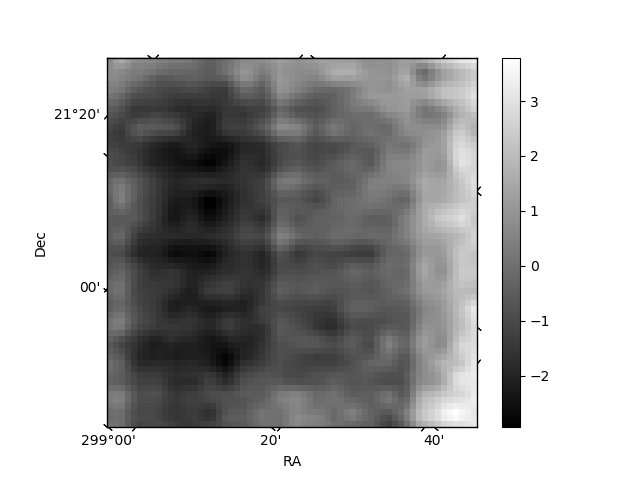
Histogram calculated using DETX and DETY for each event in the final _common_clean file
| Quadrant A | 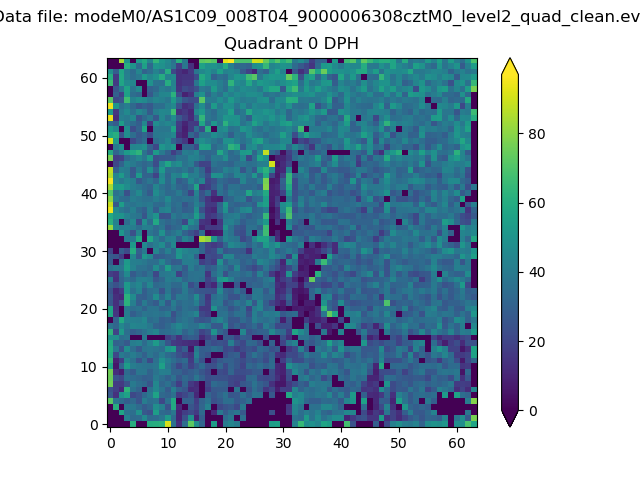 |
 |
Quadrant B |
|---|---|---|---|
| Quadrant D |  |
 |
Quadrant C |
| Plot type | Count rate plots | Images |
|---|---|---|
| Comparison with Poisson distribution Blue bars denote a histogram of data divided into 1 sec bins. Red curve is a Poisson curve with rate = median count rate of data. |
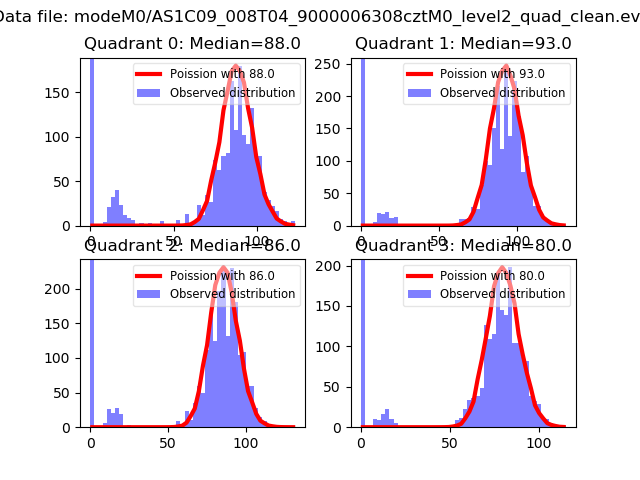 |
 |
| Quadrant-wise count rates Data is divided into 100 sec bins |
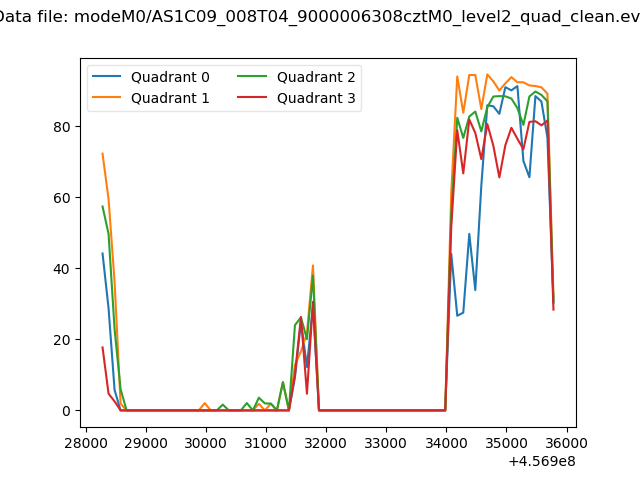 |
|
| Module-wise count rates for Quadrant A Data is divided into 100 sec bins |
 |
 |
| Module-wise count rates for Quadrant B Data is divided into 100 sec bins |
 |
 |
| Module-wise count rates for Quadrant C Data is divided into 100 sec bins |
 |
 |
| Module-wise count rates for Quadrant D Data is divided into 100 sec bins |
 |
 |
| Parameter | Plot |
|---|---|
| CZT HV Monitor |  |
| D_VDD | 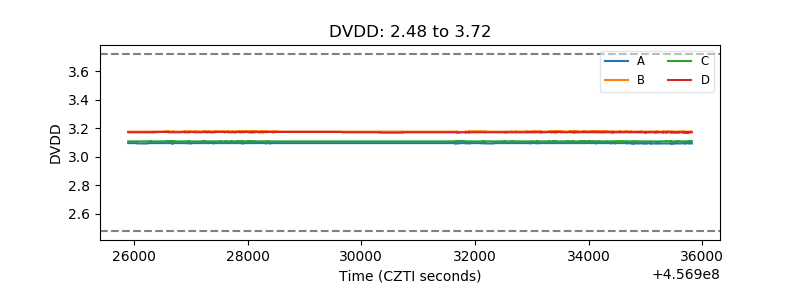 |
| Temperature 1 |  |
| Veto HV Monitor |  |
| Veto LLD |  |
| Alpha Counter |  |
| _CPM_Rate |  |
| CZT Counter |  |
| +2.5 Volts monitor |  |
| +5 Volts monitor |  |
| _ROLL_ROT |  |
| _Roll_DEC |  |
| _Roll_RA |  |
| Veto Counter |  |