| Param | Original file | Final file |
|---|---|---|
| Filename | modeM0/AS1A13_093T09_9000006320_47344cztM0_level2.fits | modeM0/AS1A13_093T09_9000006320_47344cztM0_level2_quad_clean.evt |
| Size (bytes) | 626,788,800 | 97,441,920 |
| Size | 597.8 MB | 92.9 MB |
| Events in quadrant A | 7,238,196 | 680,196 |
| Events in quadrant B | 3,210,431 | 737,731 |
| Events in quadrant C | 2,937,906 | 706,420 |
| Events in quadrant D | 9,328,433 | 387,729 |
| Mode M0 | |||
|---|---|---|---|
| Quadrant | BADHDUFLAG | Total packets | Discarded packets |
| A | 0 | 25765 | 2 |
| B | 0 | 13906 | 2 |
| C | 0 | 13094 | 2 |
| D | 0 | 32057 | 2 |
| Mode SS | |||
|---|---|---|---|
| Quadrant | BADHDUFLAG | Total packets | Discarded packets |
| A | 0 | 128 | 0 |
| B | 0 | 128 | 0 |
| C | 0 | 128 | 0 |
| D | 0 | 128 | 0 |
| Mode M9 | |||
|---|---|---|---|
| Quadrant | BADHDUFLAG | Total packets | Discarded packets |
| A | 0 | 19 | 0 |
| B | 0 | 20 | 0 |
| C | 0 | 20 | 0 |
| D | 0 | 20 | 0 |
| Quadrant | Total seconds | Saturated seconds | Saturation percentage |
|---|---|---|---|
| A | 6280 | 369 | 5.875796% |
| B | 6279 | 59 | 0.939640% |
| C | 6279 | 13 | 0.207039% |
| D | 6279 | 2538 | 40.420449% |
Noise dominated data is calculated using 1-second bins in cleaned event files. If a bin has >2000 counts, and if more than 50% of those come from <1% of pixels, then it is considered to be noise-dominated and hence unusable.
| Quadrant | # 1 sec bins | Bins with >0 counts | Bins with >2000 counts | High rate bins dominated by noise | Noise dominated (total time) | Noise dominated (detector-on time) | Marked lightcurve |
|---|---|---|---|---|---|---|---|
| A | 7495 | 6281 | 340 | 340 | 4.54% | 5.41% | 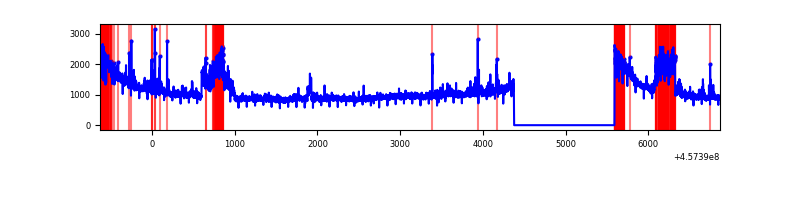 |
| B | 7494 | 6280 | 10 | 10 | 0.13% | 0.16% | 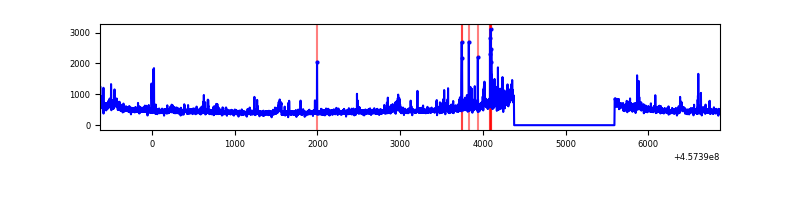 |
| C | 7494 | 6280 | 1 | 1 | 0.01% | 0.02% | 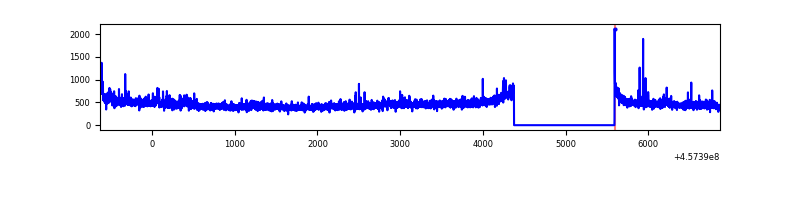 |
| D | 7493 | 6279 | 2162 | 2162 | 28.85% | 34.43% | 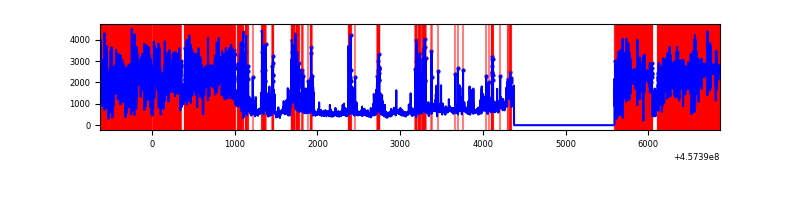 |
Top three noisy pixels from each quadrant. If the there are fewer than three noisy pixels in the level2.evt file, extra rows are filled as -1
| Pixel properties | Quadrant properties | ||||||
|---|---|---|---|---|---|---|---|
| Quadrant | DetID | PixID | Counts | Sigma | Mean | Median | Sigma |
| A | 10 | 83 | 3640605 | 25010.5 | 699 | 686 | 145.5 |
| A | 15 | 235 | 582511 | 3997.82 | 699 | 686 | 145.5 |
| A | 9 | 191 | 286258 | 1962.21 | 699 | 686 | 145.5 |
| B | 0 | 190 | 87509 | 625.98 | 714 | 693 | 138.7 |
| B | 4 | 171 | 59632 | 424.97 | 714 | 693 | 138.7 |
| B | 0 | 198 | 56569 | 402.89 | 714 | 693 | 138.7 |
| C | 0 | 207 | 107965 | 651.36 | 702 | 706 | 164.7 |
| C | 3 | 233 | 82699 | 497.92 | 702 | 706 | 164.7 |
| C | 12 | 2 | 7168 | 39.24 | 702 | 706 | 164.7 |
| D | 12 | 2 | 3048959 | 22661.23 | 536 | 519 | 134.5 |
| D | 2 | 165 | 2851086 | 21190.3 | 536 | 519 | 134.5 |
| D | 6 | 112 | 941490 | 6994.91 | 536 | 519 | 134.5 |
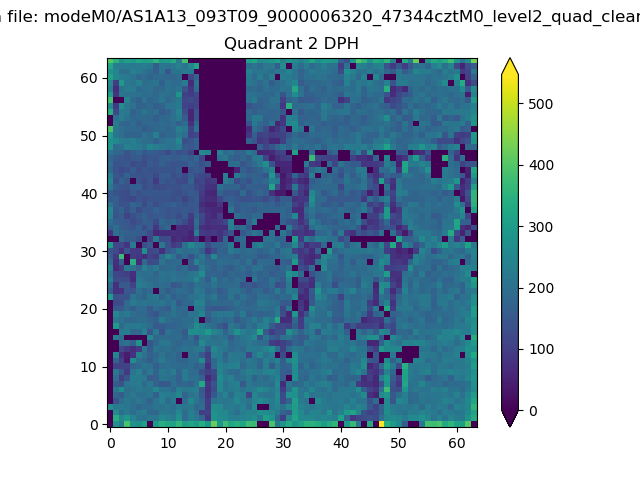
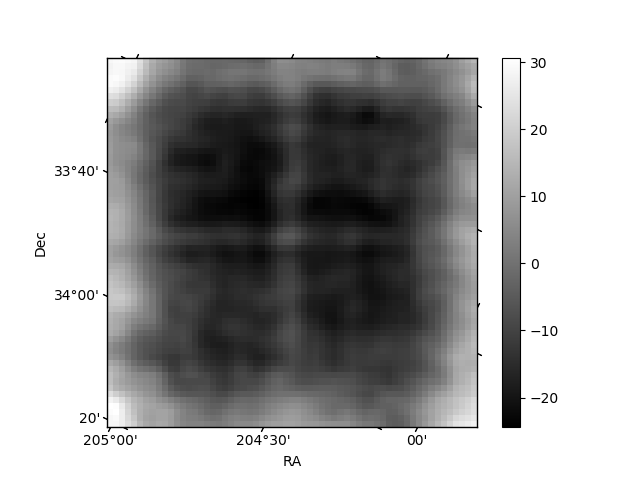
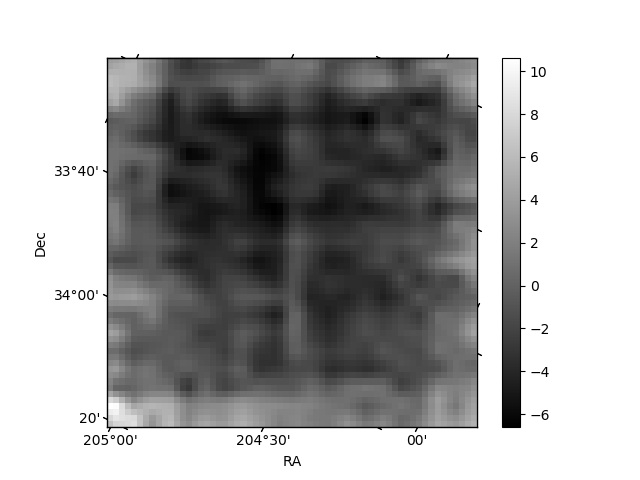
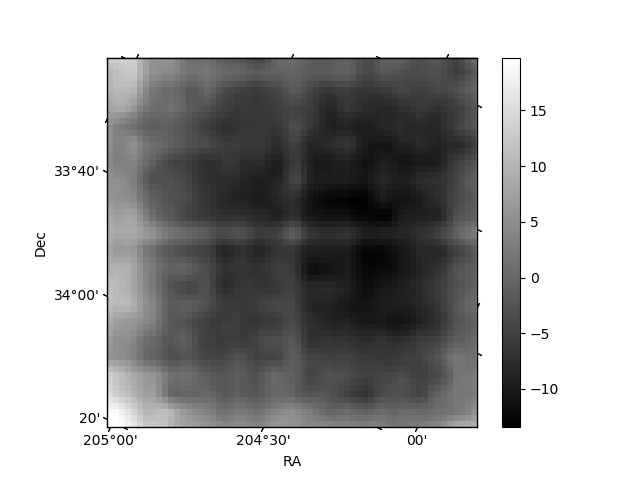
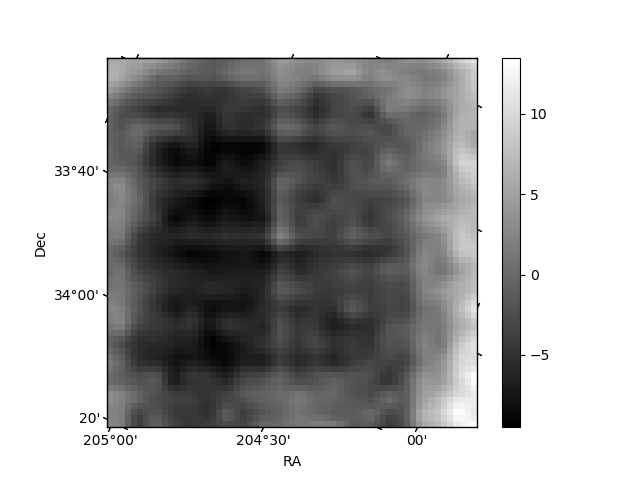
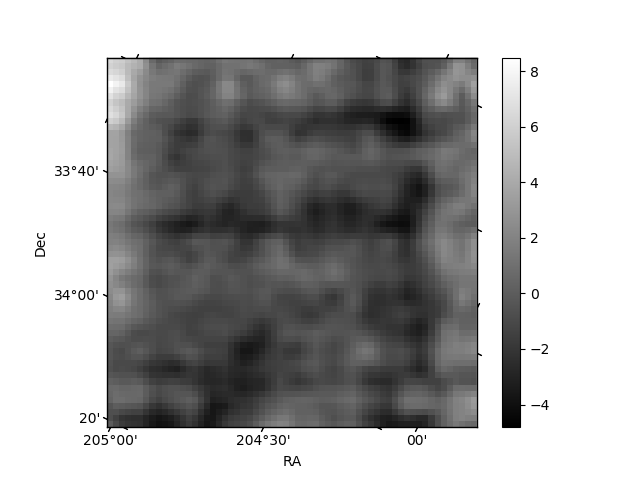
Histogram calculated using DETX and DETY for each event in the final _common_clean file
| Quadrant A | 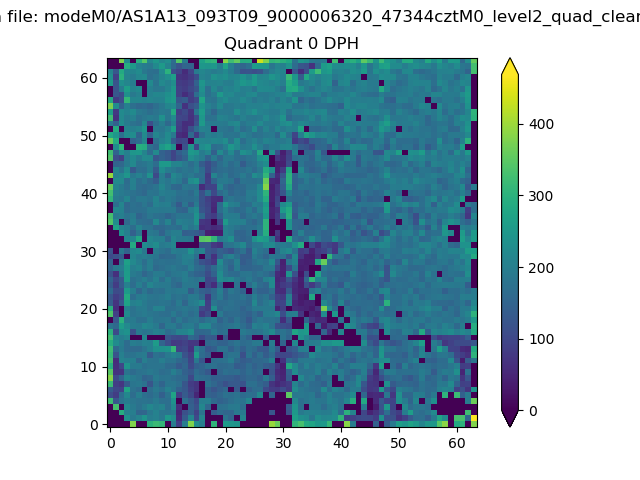 |
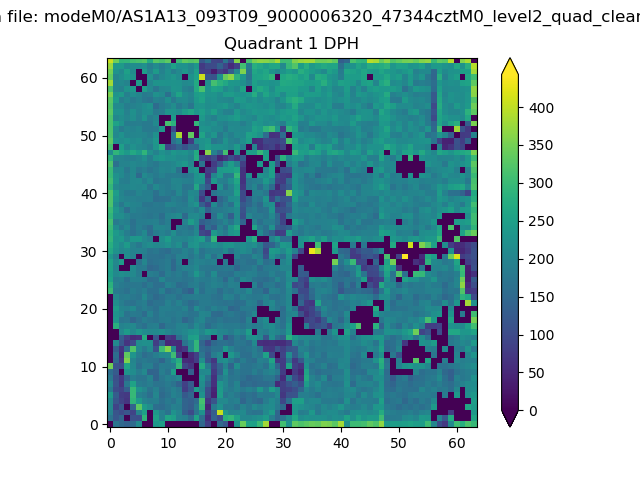 |
Quadrant B |
|---|---|---|---|
| Quadrant D | 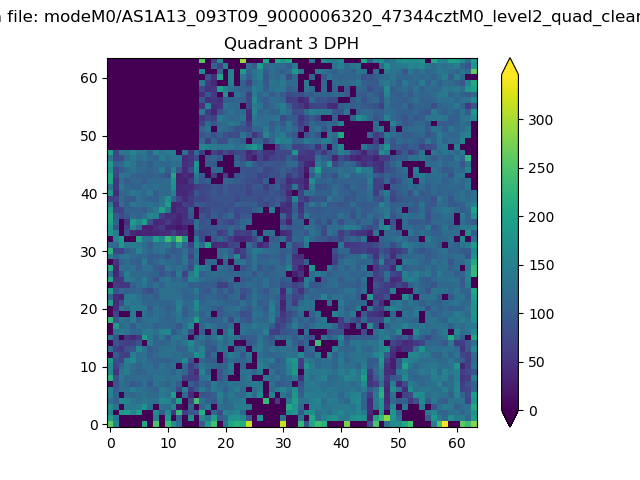 |
 |
Quadrant C |
| Plot type | Count rate plots | Images |
|---|---|---|
| Comparison with Poisson distribution Blue bars denote a histogram of data divided into 1 sec bins. Red curve is a Poisson curve with rate = median count rate of data. |
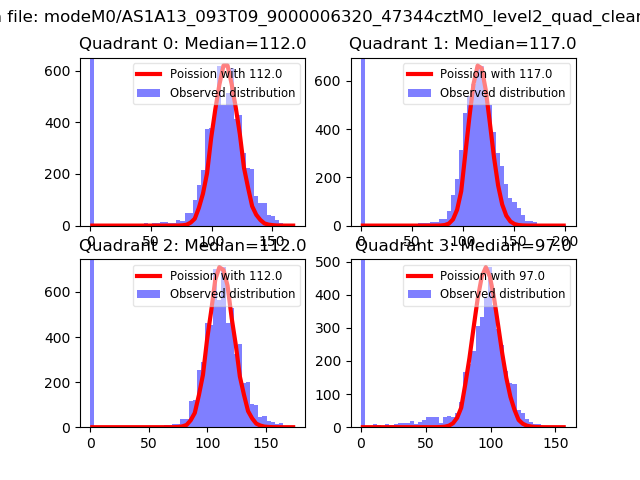 |
 |
| Quadrant-wise count rates Data is divided into 100 sec bins |
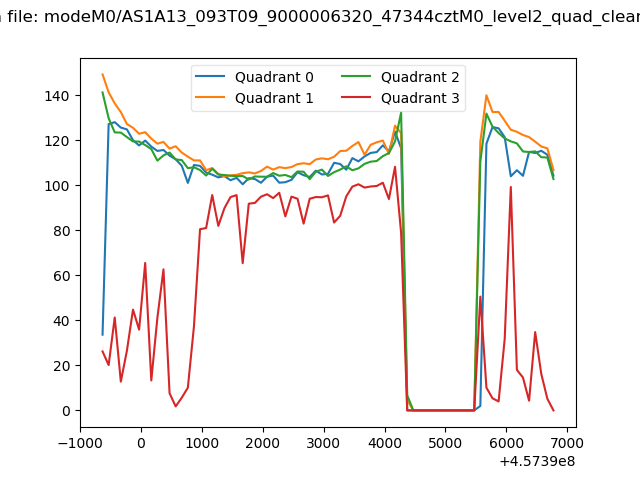 |
|
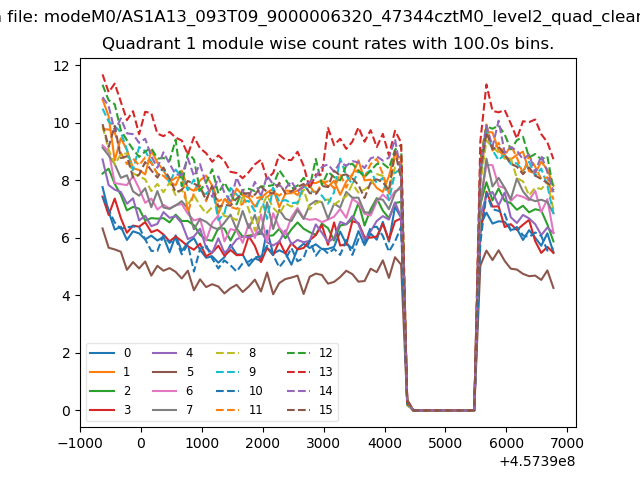
| Module-wise count rates for Quadrant A Data is divided into 100 sec bins |
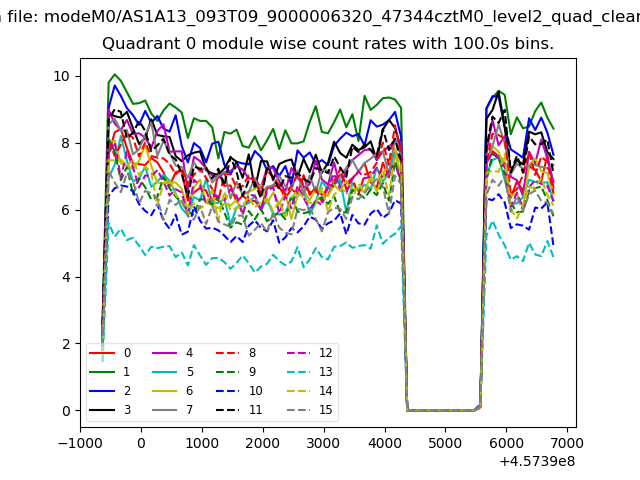 |
 |
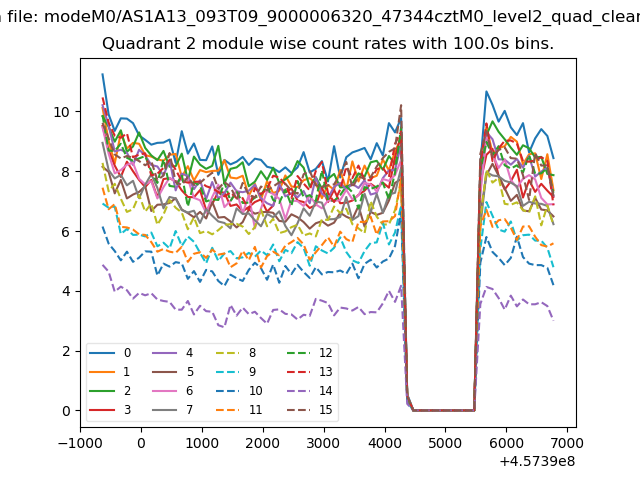
| Module-wise count rates for Quadrant B Data is divided into 100 sec bins |
 |
 |
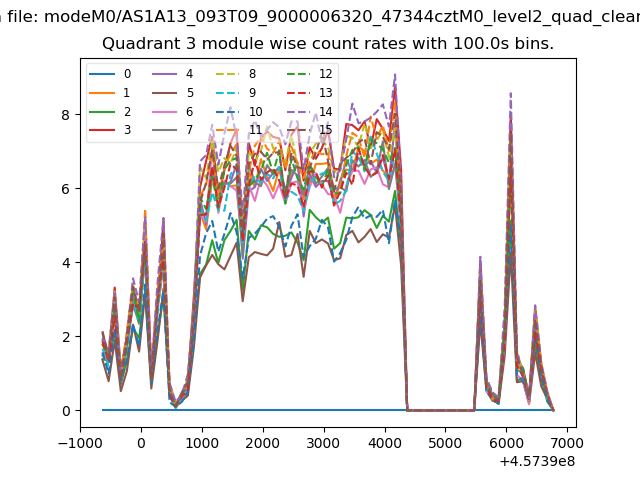
| Module-wise count rates for Quadrant C Data is divided into 100 sec bins |
 |
 |
| Module-wise count rates for Quadrant D Data is divided into 100 sec bins |
 |
 |
| Parameter | Plot |
|---|---|
| CZT HV Monitor | 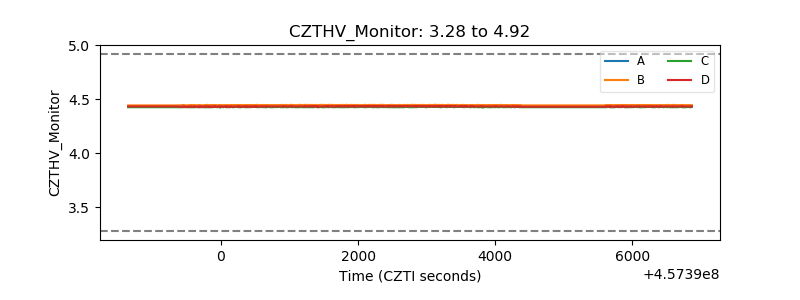 |
| D_VDD | 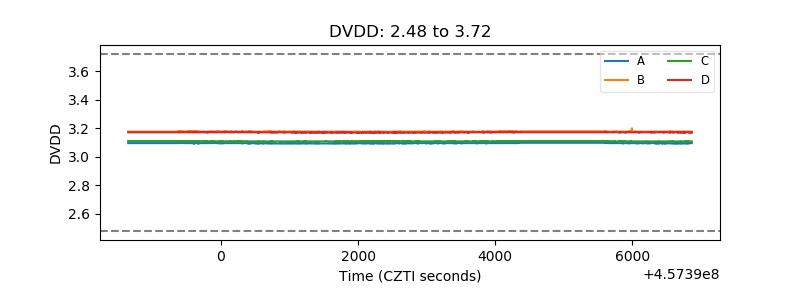 |
| Temperature 1 | 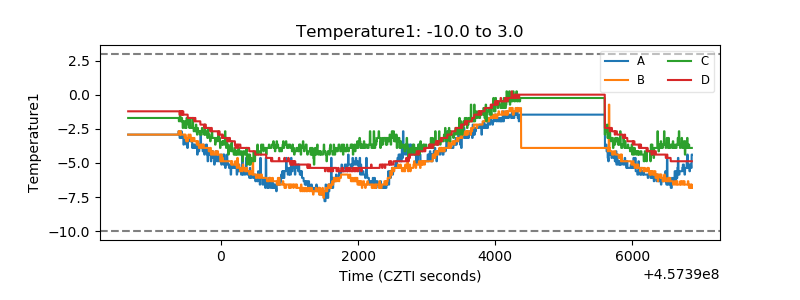 |
| Veto HV Monitor | 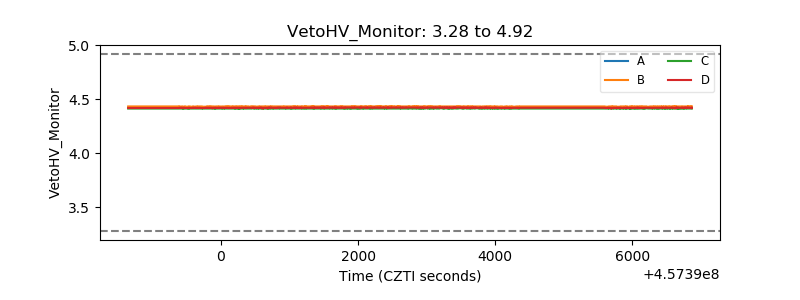 |
| Veto LLD | 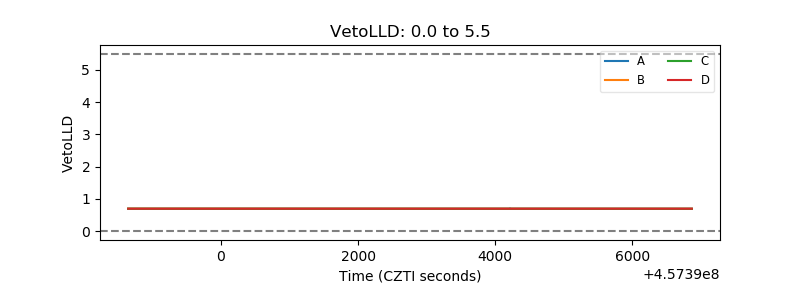 |
| Alpha Counter | 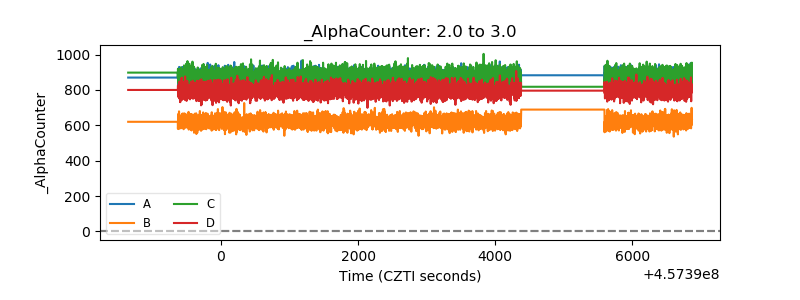 |
| _CPM_Rate |  |
| CZT Counter | 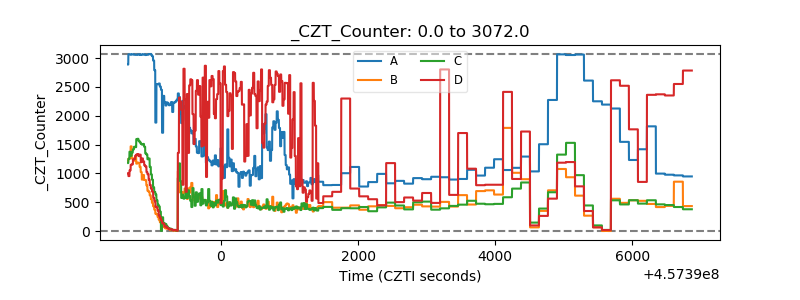 |
| +2.5 Volts monitor | 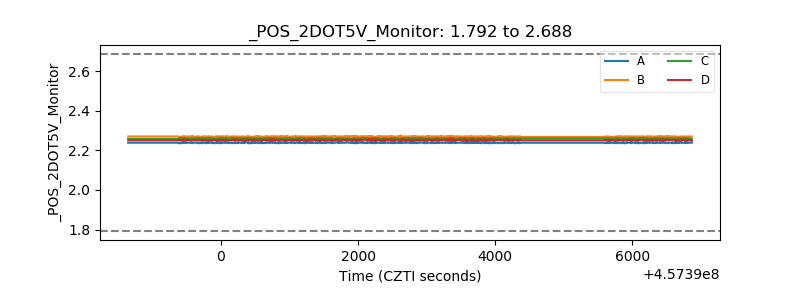 |
| +5 Volts monitor |  |
| _ROLL_ROT | 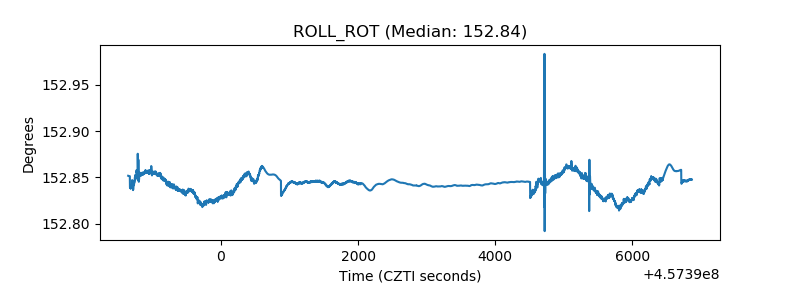 |
| _Roll_DEC | 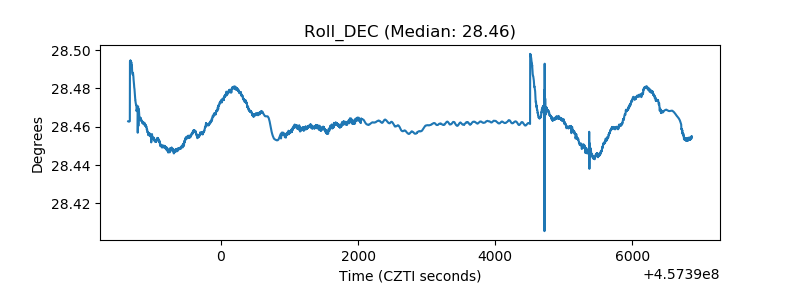 |
| _Roll_RA | 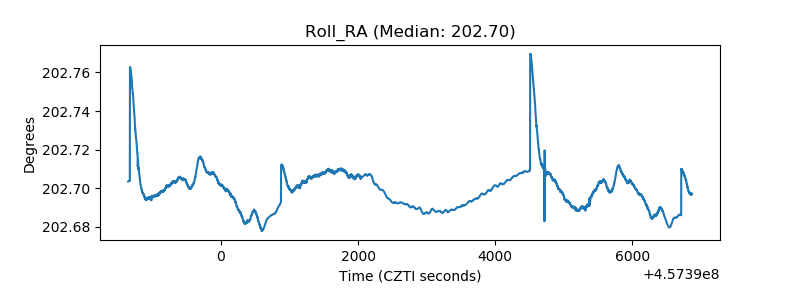 |
| Veto Counter | 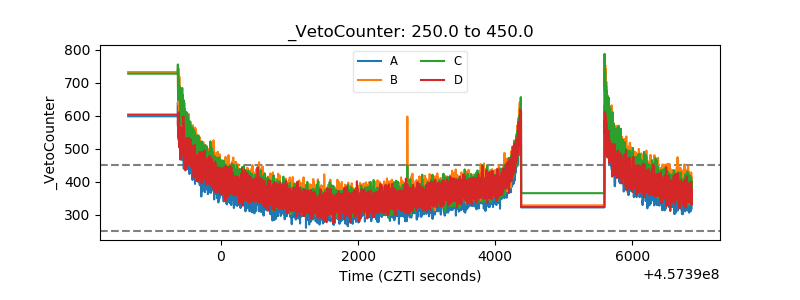 |