| Param | Original file | Final file |
|---|---|---|
| Filename | modeM0/AS1A13_093T25_9000006324_47376cztM0_level2.fits | modeM0/AS1A13_093T25_9000006324_47376cztM0_level2_quad_clean.evt |
| Size (bytes) | 510,448,320 | 113,198,400 |
| Size | 486.8 MB | 108.0 MB |
| Events in quadrant A | 7,236,357 | 737,542 |
| Events in quadrant B | 3,379,791 | 782,916 |
| Events in quadrant C | 3,373,181 | 737,928 |
| Events in quadrant D | 4,360,275 | 679,675 |
| Mode M9 | |||
|---|---|---|---|
| Quadrant | BADHDUFLAG | Total packets | Discarded packets |
| A | 0 | 19 | 0 |
| B | 0 | 19 | 0 |
| C | 0 | 19 | 0 |
| D | 0 | 19 | 0 |
| Mode M0 | |||
|---|---|---|---|
| Quadrant | BADHDUFLAG | Total packets | Discarded packets |
| A | 0 | 26297 | 2 |
| B | 0 | 14721 | 2 |
| C | 0 | 15135 | 3 |
| D | 0 | 17934 | 2 |
| Mode SS | |||
|---|---|---|---|
| Quadrant | BADHDUFLAG | Total packets | Discarded packets |
| A | 0 | 144 | 0 |
| B | 0 | 144 | 0 |
| C | 0 | 144 | 0 |
| D | 0 | 144 | 0 |
| Quadrant | Total seconds | Saturated seconds | Saturation percentage |
|---|---|---|---|
| A | 7031 | 359 | 5.105959% |
| B | 7032 | 138 | 1.962457% |
| C | 7031 | 132 | 1.877400% |
| D | 7031 | 214 | 3.043664% |
Noise dominated data is calculated using 1-second bins in cleaned event files. If a bin has >2000 counts, and if more than 50% of those come from <1% of pixels, then it is considered to be noise-dominated and hence unusable.
| Quadrant | # 1 sec bins | Bins with >0 counts | Bins with >2000 counts | High rate bins dominated by noise | Noise dominated (total time) | Noise dominated (detector-on time) | Marked lightcurve |
|---|---|---|---|---|---|---|---|
| A | 8921 | 7032 | 39 | 39 | 0.44% | 0.55% | 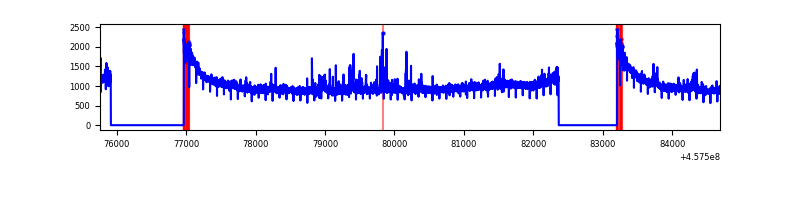 |
| B | 8922 | 7033 | 2 | 2 | 0.02% | 0.03% | 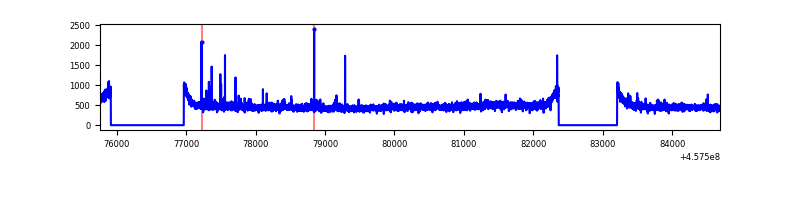 |
| C | 8921 | 7033 | 63 | 63 | 0.71% | 0.90% | 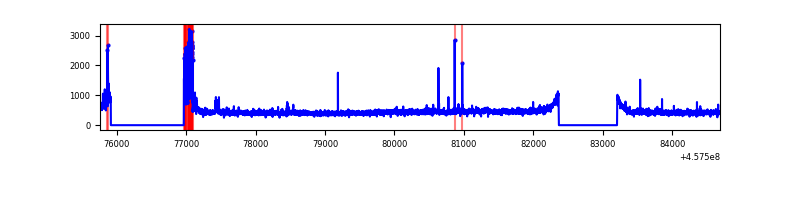 |
| D | 8921 | 7033 | 183 | 183 | 2.05% | 2.60% | 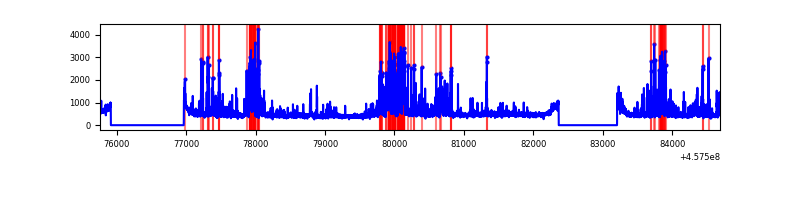 |
Top three noisy pixels from each quadrant. If the there are fewer than three noisy pixels in the level2.evt file, extra rows are filled as -1
| Pixel properties | Quadrant properties | ||||||
|---|---|---|---|---|---|---|---|
| Quadrant | DetID | PixID | Counts | Sigma | Mean | Median | Sigma |
| A | 10 | 83 | 3855752 | 22858.24 | 806 | 787 | 168.6 |
| A | 9 | 191 | 249129 | 1472.56 | 806 | 787 | 168.6 |
| A | 13 | 6 | 12234 | 67.87 | 806 | 787 | 168.6 |
| B | 0 | 190 | 50191 | 302.7 | 816 | 791 | 163.2 |
| B | 0 | 218 | 28575 | 170.25 | 816 | 791 | 163.2 |
| B | 12 | 111 | 21583 | 127.4 | 816 | 791 | 163.2 |
| C | 0 | 207 | 249517 | 1310.65 | 795 | 800 | 189.8 |
| C | 3 | 233 | 12284 | 60.52 | 795 | 800 | 189.8 |
| C | 12 | 250 | 9974 | 48.34 | 795 | 800 | 189.8 |
| D | 12 | 2 | 925856 | 4633.31 | 791 | 765 | 199.7 |
| D | 11 | 224 | 181920 | 907.31 | 791 | 765 | 199.7 |
| D | 7 | 38 | 72699 | 360.28 | 791 | 765 | 199.7 |
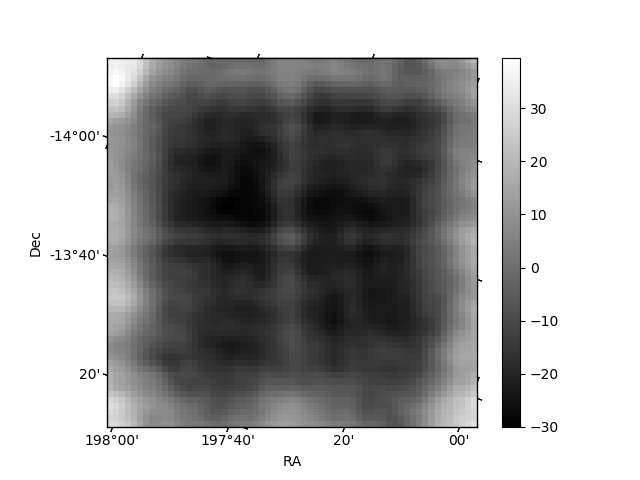
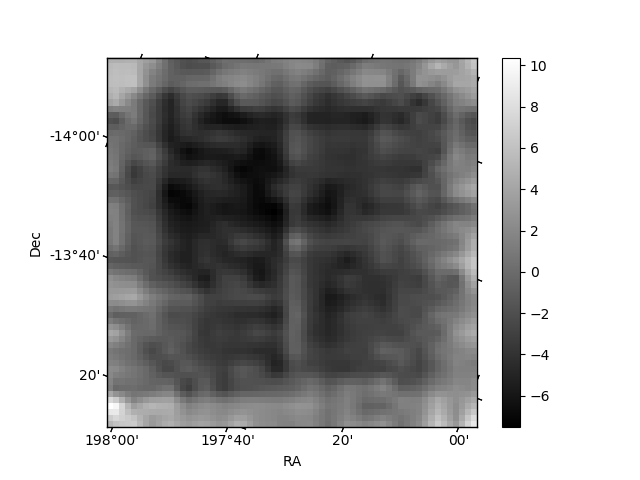
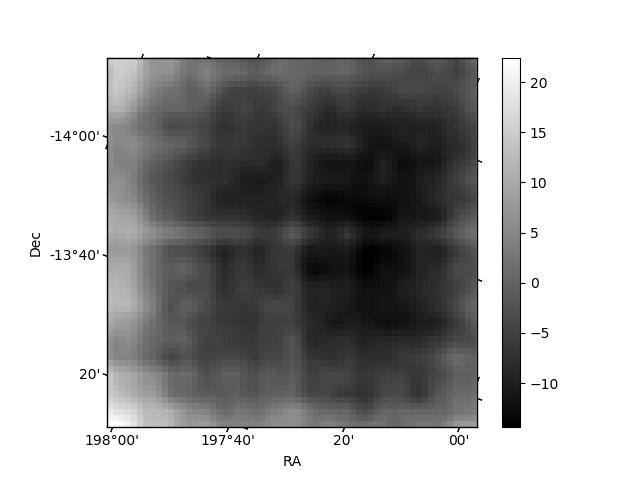
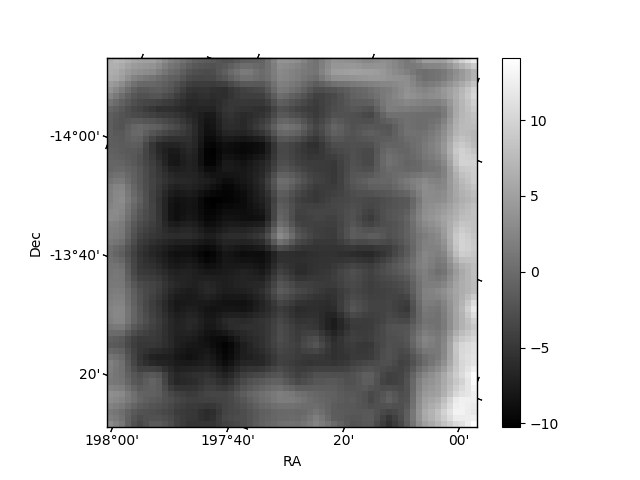
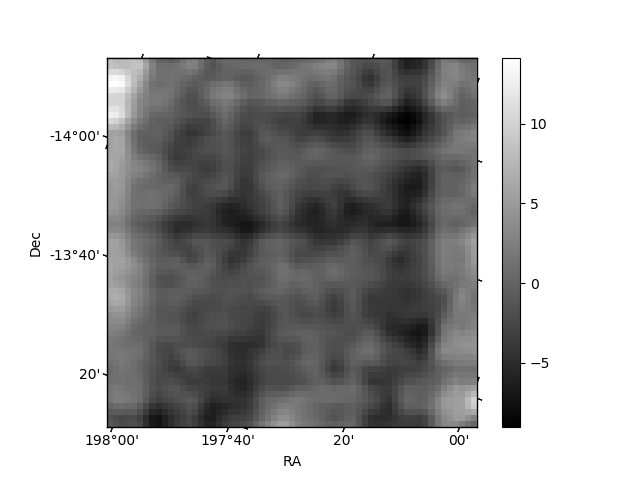
Histogram calculated using DETX and DETY for each event in the final _common_clean file
| Quadrant A | 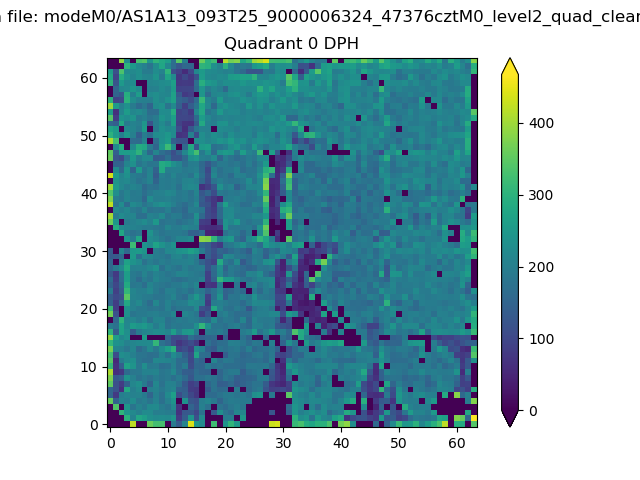 |
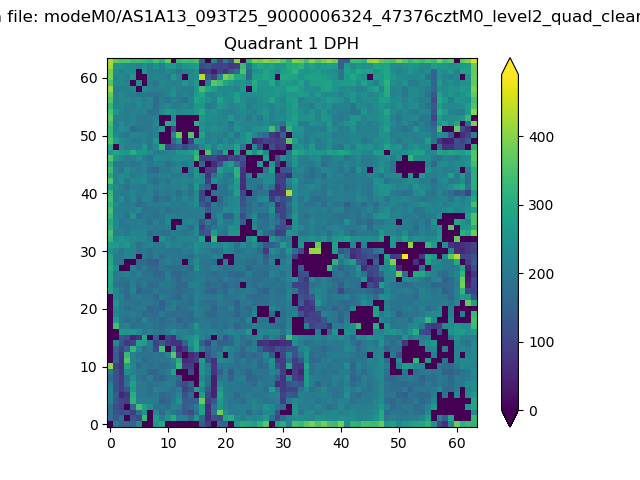 |
Quadrant B |
|---|---|---|---|
| Quadrant D | 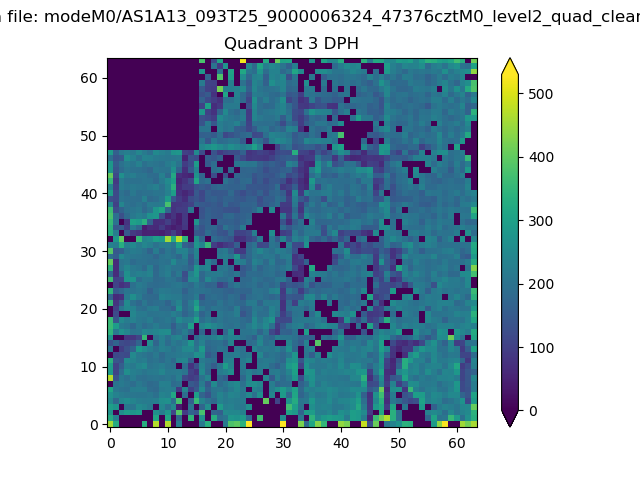 |
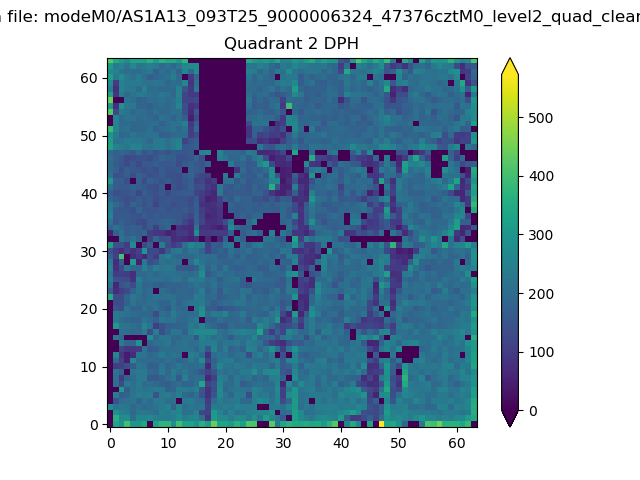 |
Quadrant C |
| Plot type | Count rate plots | Images |
|---|---|---|
| Comparison with Poisson distribution Blue bars denote a histogram of data divided into 1 sec bins. Red curve is a Poisson curve with rate = median count rate of data. |
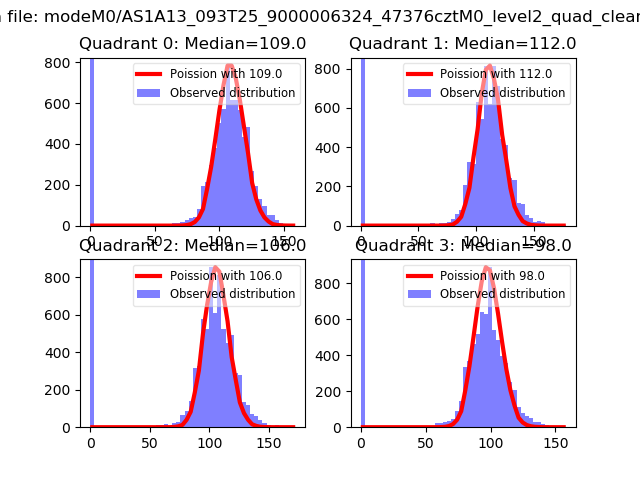 |
 |
| Quadrant-wise count rates Data is divided into 100 sec bins |
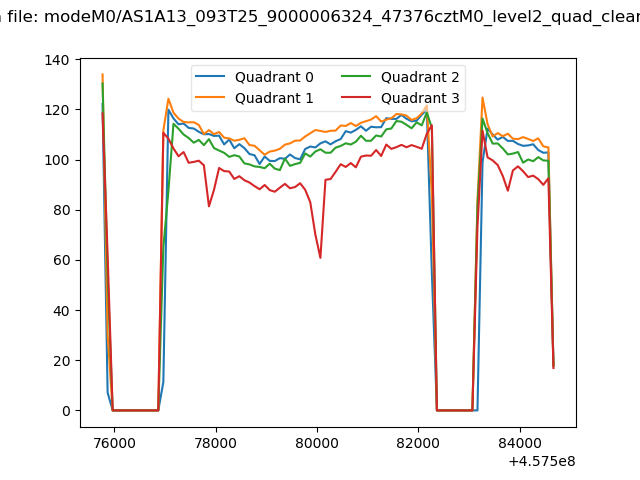 |
|
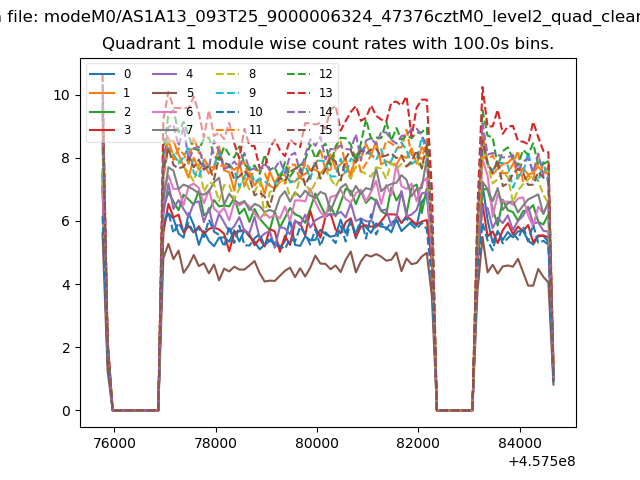
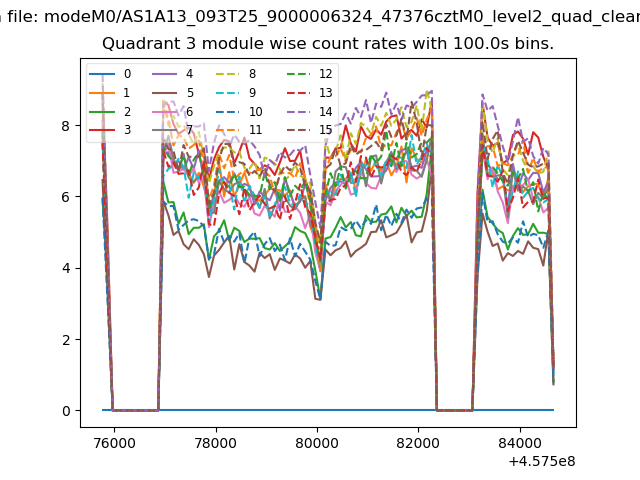
| Module-wise count rates for Quadrant A Data is divided into 100 sec bins |
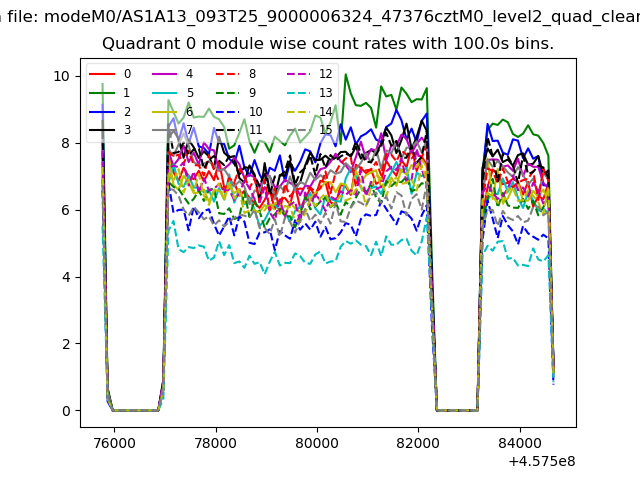 |
 |
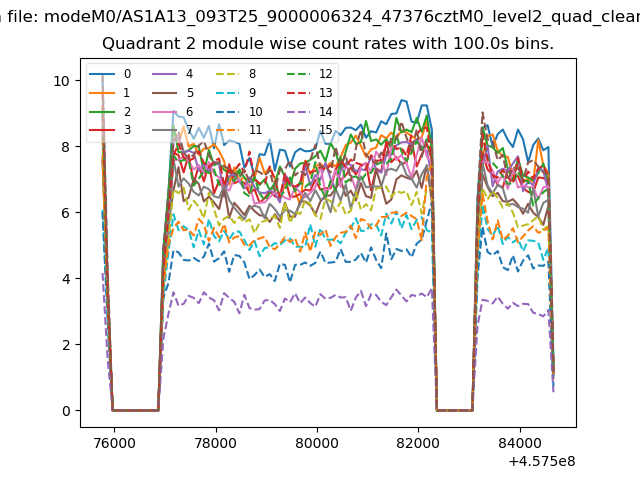
| Module-wise count rates for Quadrant B Data is divided into 100 sec bins |
 |
 |
| Module-wise count rates for Quadrant C Data is divided into 100 sec bins |
 |
 |
| Module-wise count rates for Quadrant D Data is divided into 100 sec bins |
 |
 |
| Parameter | Plot |
|---|---|
| CZT HV Monitor | 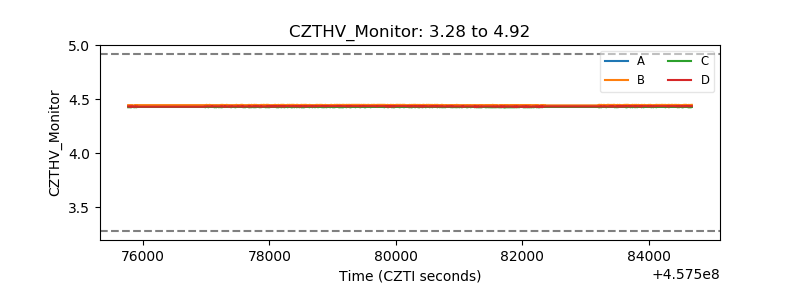 |
| D_VDD | 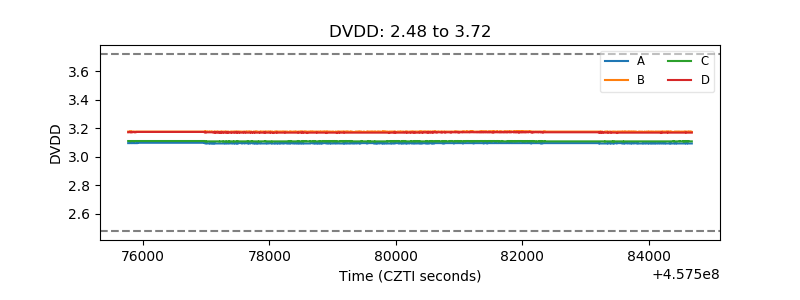 |
| Temperature 1 | 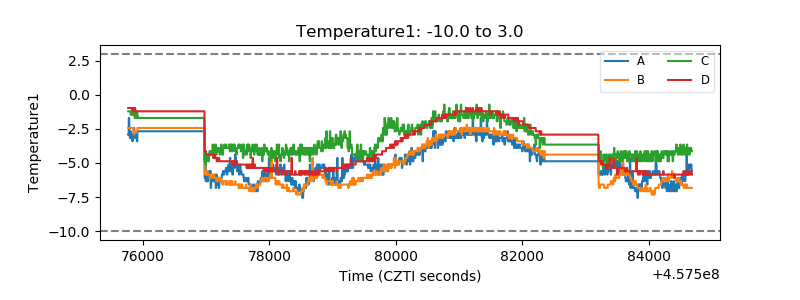 |
| Veto HV Monitor | 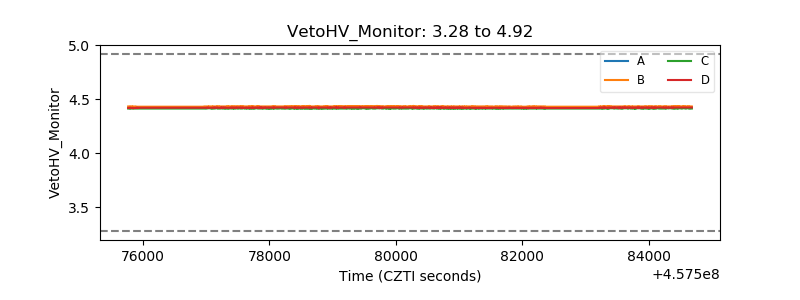 |
| Veto LLD | 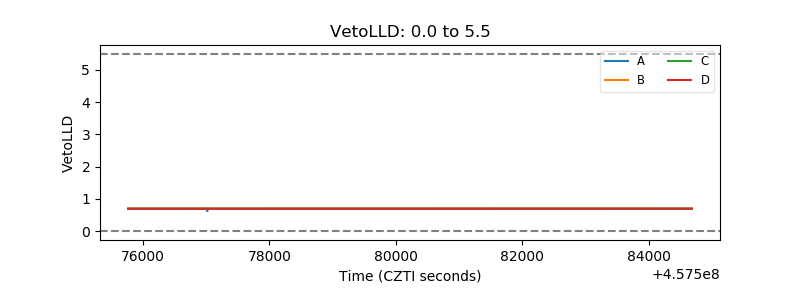 |
| Alpha Counter | 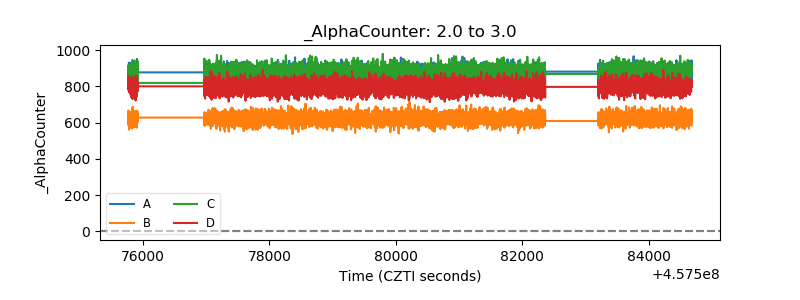 |
| _CPM_Rate | 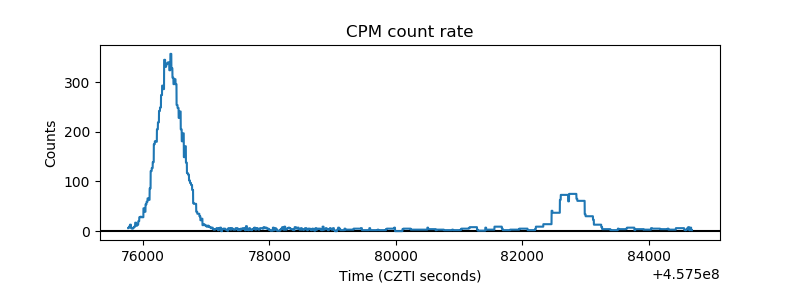 |
| CZT Counter | 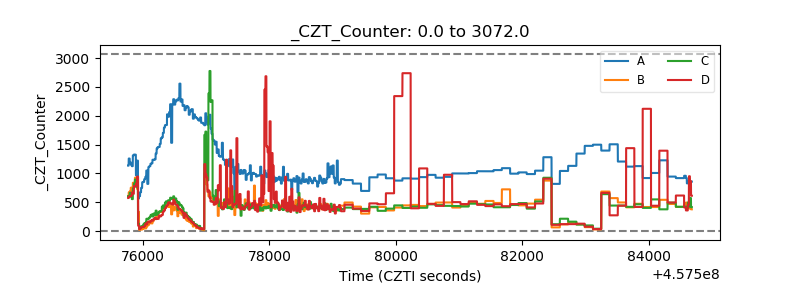 |
| +2.5 Volts monitor |  |
| +5 Volts monitor | 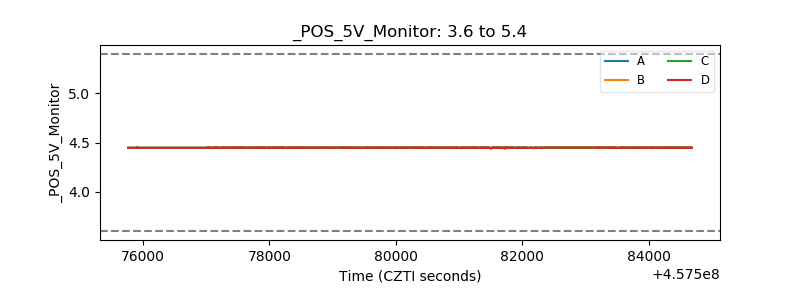 |
| _ROLL_ROT | 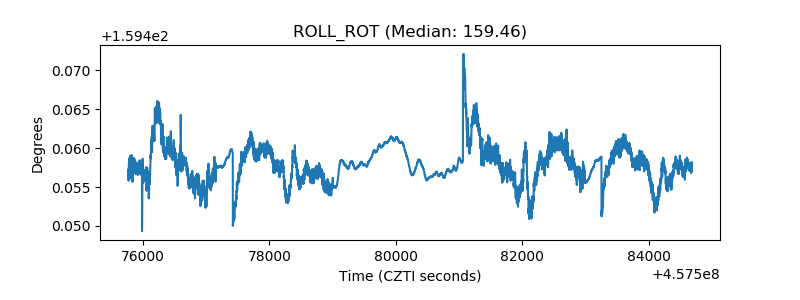 |
| _Roll_DEC | 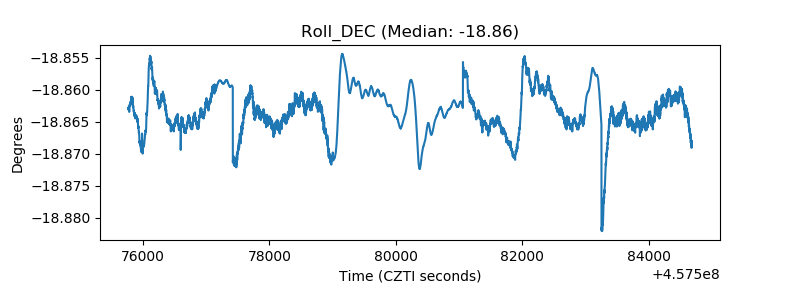 |
| _Roll_RA | 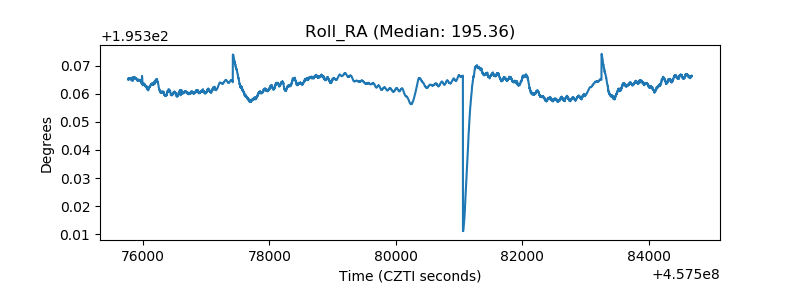 |
| Veto Counter | 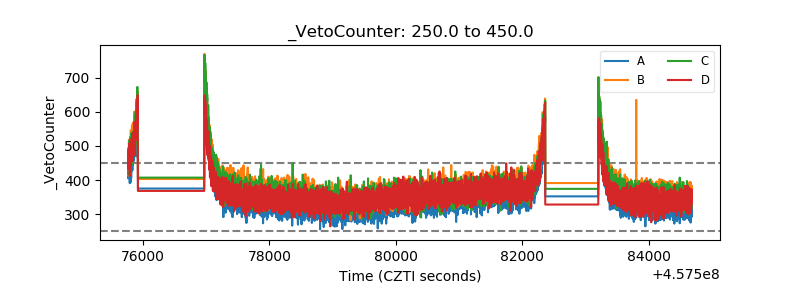 |