| Param | Original file | Final file |
|---|---|---|
| Filename | modeM0/AS1A13_089T01_9000006330_47481cztM0_level2.fits | modeM0/AS1A13_089T01_9000006330_47481cztM0_level2_quad_clean.evt |
| Size (bytes) | 578,551,680 | 118,972,800 |
| Size | 551.7 MB | 113.5 MB |
| Events in quadrant A | 7,541,961 | 771,519 |
| Events in quadrant B | 4,548,325 | 792,205 |
| Events in quadrant C | 3,517,716 | 792,959 |
| Events in quadrant D | 5,214,892 | 713,164 |
| Mode SS | |||
|---|---|---|---|
| Quadrant | BADHDUFLAG | Total packets | Discarded packets |
| A | 0 | 152 | 0 |
| B | 0 | 152 | 0 |
| C | 0 | 152 | 0 |
| D | 0 | 152 | 0 |
| Mode M0 | |||
|---|---|---|---|
| Quadrant | BADHDUFLAG | Total packets | Discarded packets |
| A | 0 | 27551 | 1 |
| B | 0 | 18697 | 0 |
| C | 0 | 16005 | 0 |
| D | 0 | 20876 | 0 |
| Quadrant | Total seconds | Saturated seconds | Saturation percentage |
|---|---|---|---|
| A | 7656 | 340 | 4.440961% |
| B | 7657 | 405 | 5.289278% |
| C | 7657 | 68 | 0.888076% |
| D | 7657 | 262 | 3.421706% |
Noise dominated data is calculated using 1-second bins in cleaned event files. If a bin has >2000 counts, and if more than 50% of those come from <1% of pixels, then it is considered to be noise-dominated and hence unusable.
| Quadrant | # 1 sec bins | Bins with >0 counts | Bins with >2000 counts | High rate bins dominated by noise | Noise dominated (total time) | Noise dominated (detector-on time) | Marked lightcurve |
|---|---|---|---|---|---|---|---|
| A | 7656 | 7656 | 2 | 2 | 0.03% | 0.03% |  |
| B | 7657 | 7657 | 80 | 80 | 1.04% | 1.04% |  |
| C | 7657 | 7657 | 3 | 3 | 0.04% | 0.04% |  |
| D | 7657 | 7657 | 219 | 219 | 2.86% | 2.86% |  |
Top three noisy pixels from each quadrant. If the there are fewer than three noisy pixels in the level2.evt file, extra rows are filled as -1
| Pixel properties | Quadrant properties | ||||||
|---|---|---|---|---|---|---|---|
| Quadrant | DetID | PixID | Counts | Sigma | Mean | Median | Sigma |
| A | 10 | 83 | 3911341 | 21331.0 | 866 | 845 | 183.3 |
| A | 9 | 191 | 239202 | 1300.19 | 866 | 845 | 183.3 |
| A | 15 | 235 | 41993 | 224.45 | 866 | 845 | 183.3 |
| B | 0 | 200 | 873233 | 5024.22 | 866 | 838 | 173.6 |
| B | 5 | 32 | 136696 | 782.42 | 866 | 838 | 173.6 |
| B | 0 | 198 | 50044 | 283.38 | 866 | 838 | 173.6 |
| C | 3 | 233 | 89697 | 435.26 | 861 | 867 | 204.1 |
| C | 12 | 250 | 23928 | 113.0 | 861 | 867 | 204.1 |
| C | 0 | 207 | 22381 | 105.42 | 861 | 867 | 204.1 |
| D | 11 | 192 | 1435211 | 6575.15 | 852 | 826 | 218.2 |
| D | 2 | 249 | 237362 | 1084.27 | 852 | 826 | 218.2 |
| D | 7 | 38 | 91920 | 417.57 | 852 | 826 | 218.2 |
Histogram calculated using DETX and DETY for each event in the final _common_clean file
| Quadrant A |  |
 |
Quadrant B |
|---|---|---|---|
| Quadrant D |  |
 |
Quadrant C |
| Plot type | Count rate plots | Images |
|---|---|---|
| Comparison with Poisson distribution Blue bars denote a histogram of data divided into 1 sec bins. Red curve is a Poisson curve with rate = median count rate of data. |
 |
 |
| Quadrant-wise count rates Data is divided into 100 sec bins |
 |
|
| Module-wise count rates for Quadrant A Data is divided into 100 sec bins |
 |
 |
| Module-wise count rates for Quadrant B Data is divided into 100 sec bins |
 |
 |
| Module-wise count rates for Quadrant C Data is divided into 100 sec bins |
 |
 |
| Module-wise count rates for Quadrant D Data is divided into 100 sec bins |
 |
 |
| Parameter | Plot |
|---|---|
| CZT HV Monitor |  |
| D_VDD |  |
| Temperature 1 |  |
| Veto HV Monitor |  |
| Veto LLD |  |
| Alpha Counter |  |
| _CPM_Rate |  |
| CZT Counter |  |
| +2.5 Volts monitor | 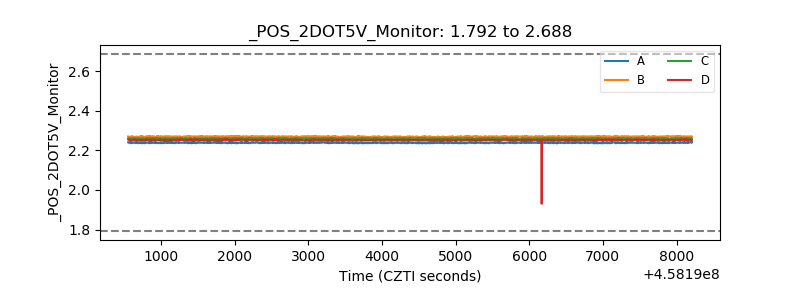 |
| +5 Volts monitor | 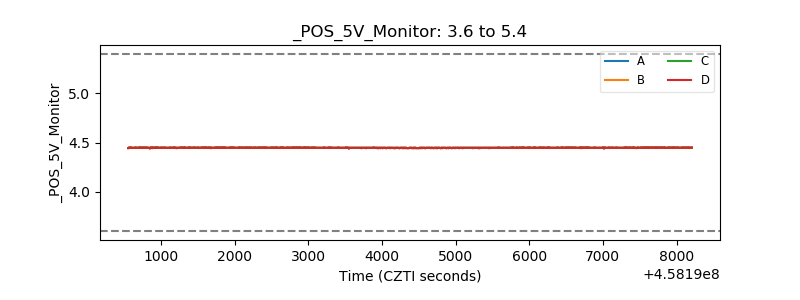 |
| _ROLL_ROT |  |
| _Roll_DEC |  |
| _Roll_RA |  |
| Veto Counter |  |