| Param | Original file | Final file |
|---|---|---|
| Filename | modeM0/AS1A13_037T05_9000006332_47507cztM0_level2.fits | modeM0/AS1A13_037T05_9000006332_47507cztM0_level2_quad_clean.evt |
| Size (bytes) | 501,629,760 | 114,477,120 |
| Size | 478.4 MB | 109.2 MB |
| Events in quadrant A | 7,009,739 | 761,141 |
| Events in quadrant B | 3,758,179 | 789,505 |
| Events in quadrant C | 2,960,683 | 756,363 |
| Events in quadrant D | 4,306,385 | 680,288 |
| Mode M9 | |||
|---|---|---|---|
| Quadrant | BADHDUFLAG | Total packets | Discarded packets |
| A | 0 | 6 | 0 |
| B | 0 | 6 | 0 |
| C | 0 | 6 | 0 |
| D | 0 | 6 | 0 |
| Mode SS | |||
|---|---|---|---|
| Quadrant | BADHDUFLAG | Total packets | Discarded packets |
| A | 0 | 138 | 0 |
| B | 0 | 138 | 0 |
| C | 0 | 138 | 0 |
| D | 0 | 138 | 0 |
| Mode M0 | |||
|---|---|---|---|
| Quadrant | BADHDUFLAG | Total packets | Discarded packets |
| A | 0 | 25496 | 1 |
| B | 0 | 15888 | 1 |
| C | 0 | 14006 | 1 |
| D | 0 | 17591 | 1 |
| Quadrant | Total seconds | Saturated seconds | Saturation percentage |
|---|---|---|---|
| A | 6880 | 269 | 3.909884% |
| B | 6880 | 122 | 1.773256% |
| C | 6881 | 17 | 0.247057% |
| D | 6881 | 182 | 2.644964% |
Noise dominated data is calculated using 1-second bins in cleaned event files. If a bin has >2000 counts, and if more than 50% of those come from <1% of pixels, then it is considered to be noise-dominated and hence unusable.
| Quadrant | # 1 sec bins | Bins with >0 counts | Bins with >2000 counts | High rate bins dominated by noise | Noise dominated (total time) | Noise dominated (detector-on time) | Marked lightcurve |
|---|---|---|---|---|---|---|---|
| A | 7475 | 6881 | 20 | 20 | 0.27% | 0.29% | 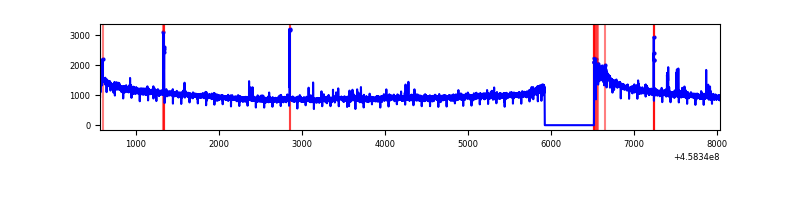 |
| B | 7475 | 6881 | 38 | 38 | 0.51% | 0.55% | 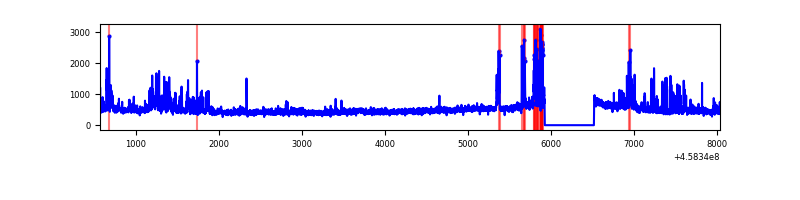 |
| C | 7476 | 6882 | 0 | 0 | 0.00% | 0.00% | 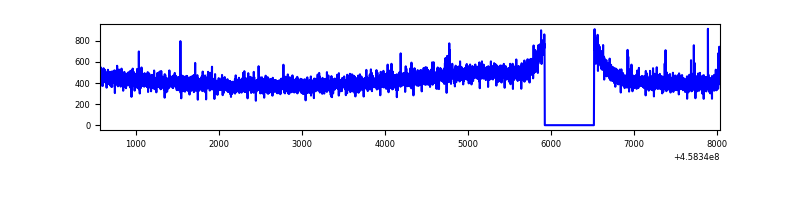 |
| D | 7476 | 6882 | 155 | 155 | 2.07% | 2.25% | 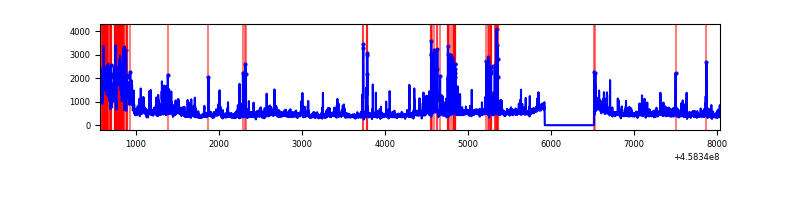 |
Top three noisy pixels from each quadrant. If the there are fewer than three noisy pixels in the level2.evt file, extra rows are filled as -1
| Pixel properties | Quadrant properties | ||||||
|---|---|---|---|---|---|---|---|
| Quadrant | DetID | PixID | Counts | Sigma | Mean | Median | Sigma |
| A | 10 | 83 | 3887982 | 24310.89 | 770 | 758 | 159.9 |
| A | 9 | 191 | 75828 | 469.49 | 770 | 758 | 159.9 |
| A | 13 | 248 | 54106 | 333.64 | 770 | 758 | 159.9 |
| B | 0 | 200 | 351682 | 2327.5 | 771 | 749 | 150.8 |
| B | 5 | 32 | 167204 | 1103.98 | 771 | 749 | 150.8 |
| B | 0 | 198 | 115023 | 757.9 | 771 | 749 | 150.8 |
| C | 1 | 3 | 6017 | 29.64 | 754 | 760 | 177.3 |
| C | 13 | 61 | 5079 | 24.36 | 754 | 760 | 177.3 |
| C | 0 | 207 | 4390 | 20.47 | 754 | 760 | 177.3 |
| D | 2 | 165 | 769308 | 4107.7 | 745 | 722 | 187.1 |
| D | 2 | 249 | 329788 | 1758.69 | 745 | 722 | 187.1 |
| D | 7 | 55 | 116550 | 619.04 | 745 | 722 | 187.1 |
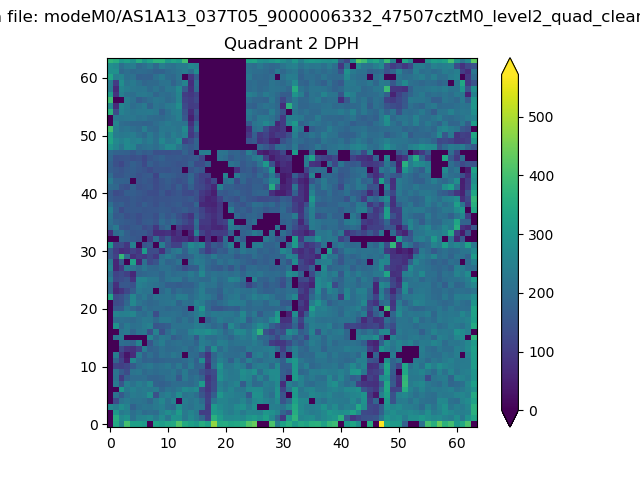
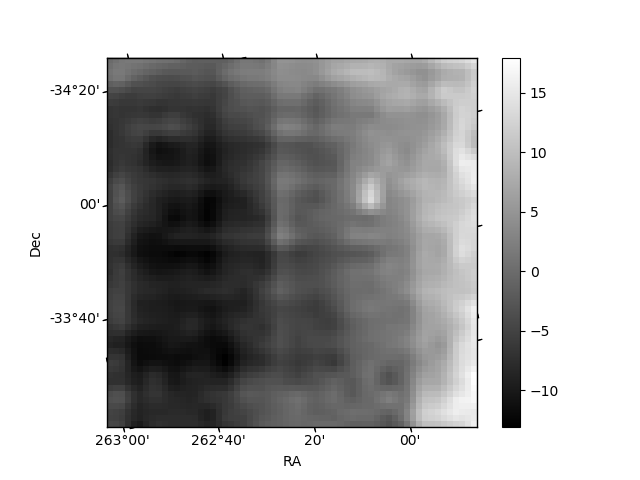
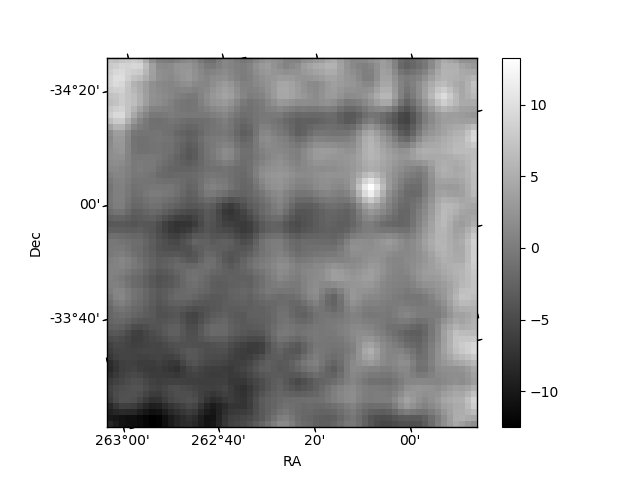
Histogram calculated using DETX and DETY for each event in the final _common_clean file
| Quadrant A | 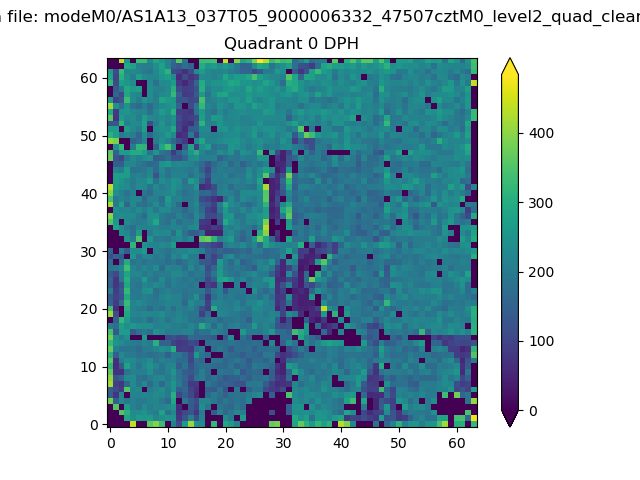 |
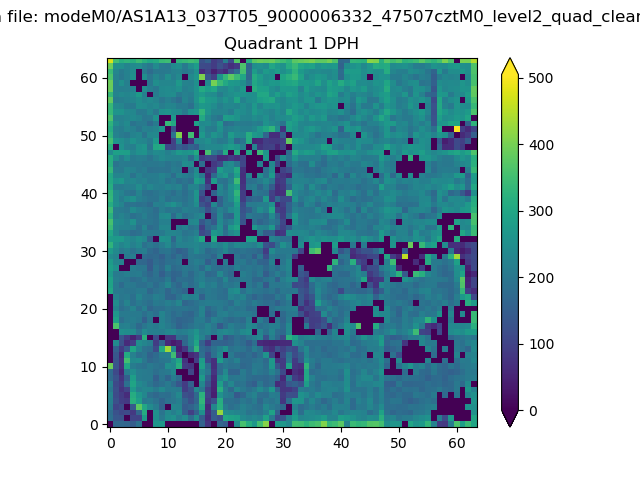 |
Quadrant B |
|---|---|---|---|
| Quadrant D | 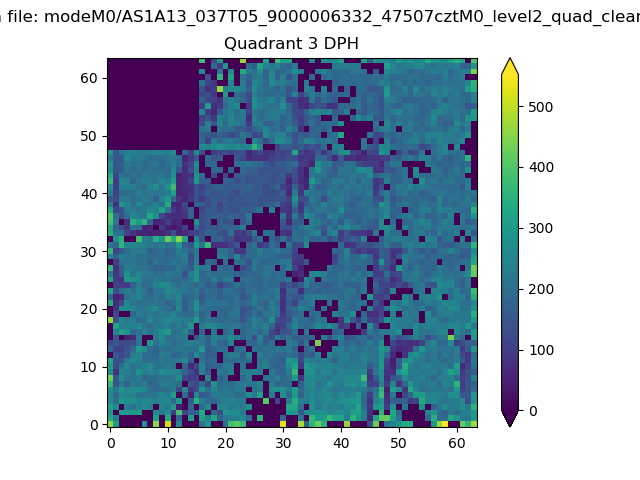 |
 |
Quadrant C |
| Plot type | Count rate plots | Images |
|---|---|---|
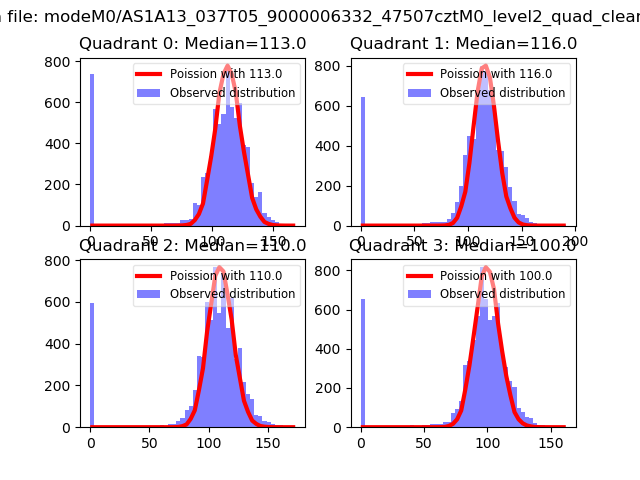
| Comparison with Poisson distribution Blue bars denote a histogram of data divided into 1 sec bins. Red curve is a Poisson curve with rate = median count rate of data. |
 |
 |
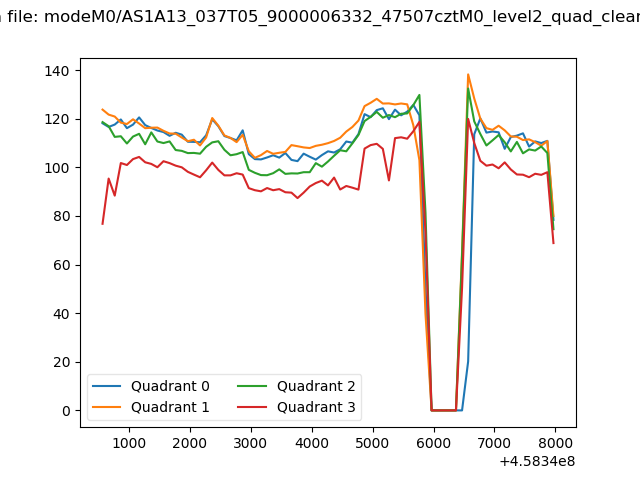
| Quadrant-wise count rates Data is divided into 100 sec bins |
 |
|
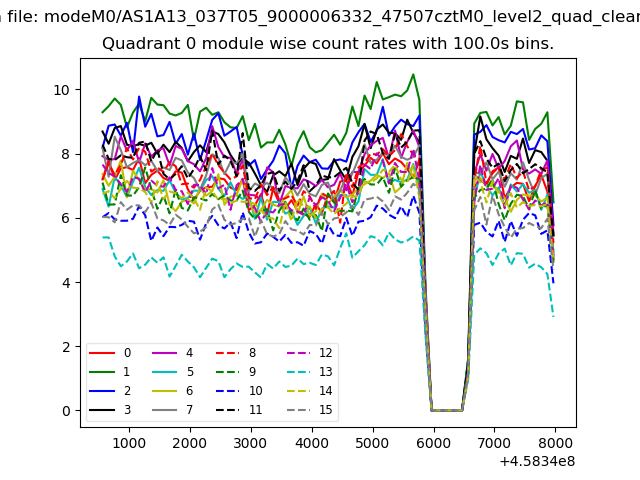
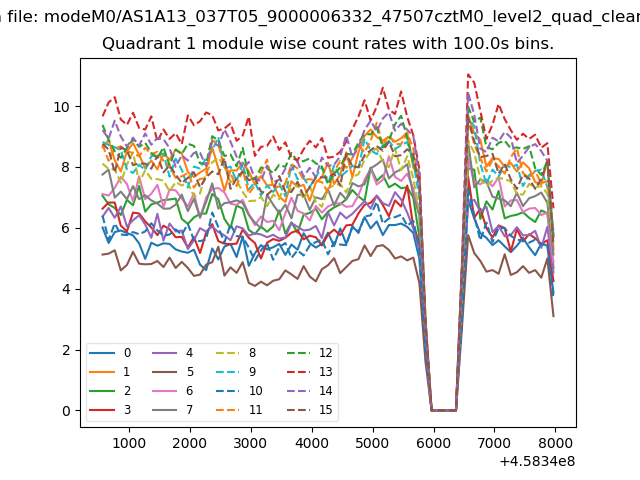
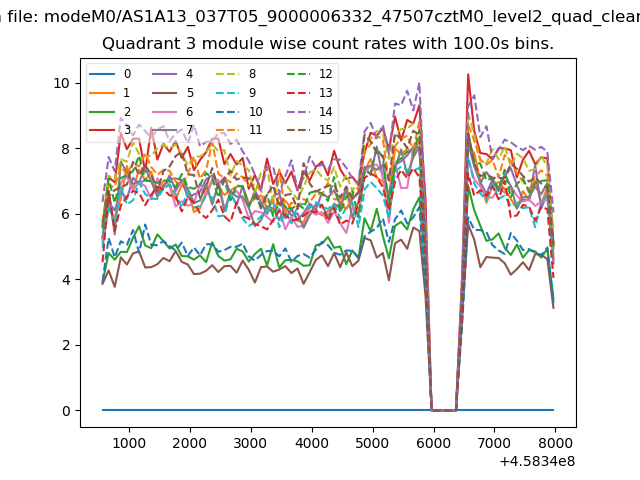
| Module-wise count rates for Quadrant A Data is divided into 100 sec bins |
 |
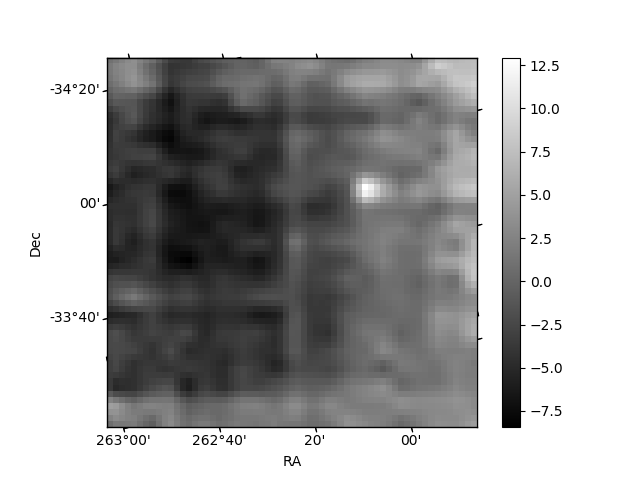 |
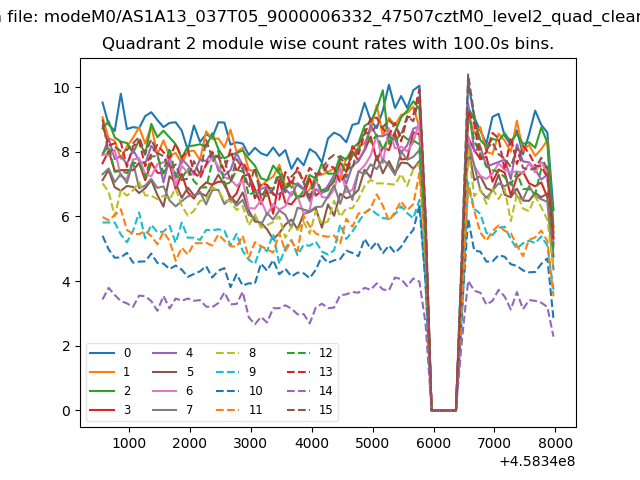
| Module-wise count rates for Quadrant B Data is divided into 100 sec bins |
 |
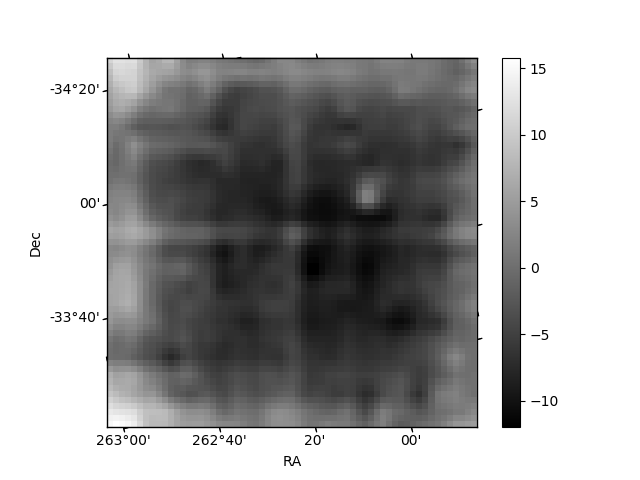 |
| Module-wise count rates for Quadrant C Data is divided into 100 sec bins |
 |
 |
| Module-wise count rates for Quadrant D Data is divided into 100 sec bins |
 |
 |
| Parameter | Plot |
|---|---|
| CZT HV Monitor | 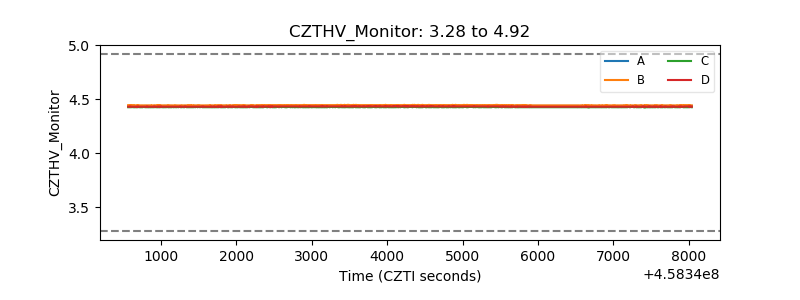 |
| D_VDD | 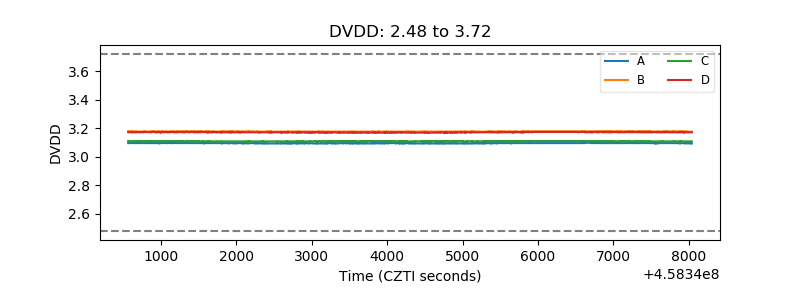 |
| Temperature 1 | 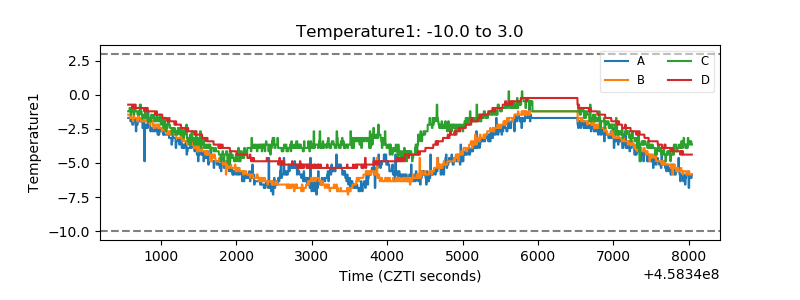 |
| Veto HV Monitor |  |
| Veto LLD | 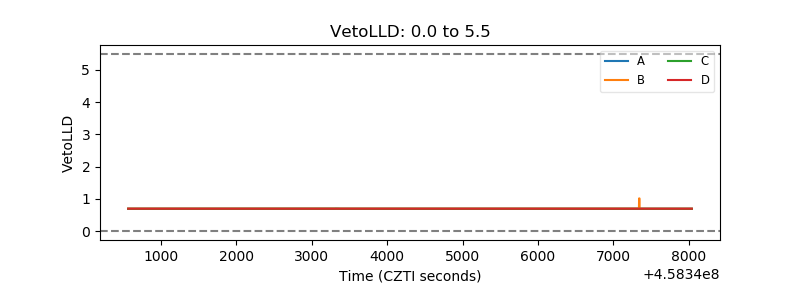 |
| Alpha Counter | 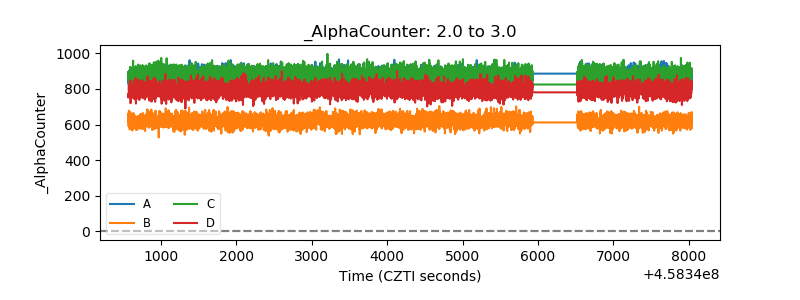 |
| _CPM_Rate | 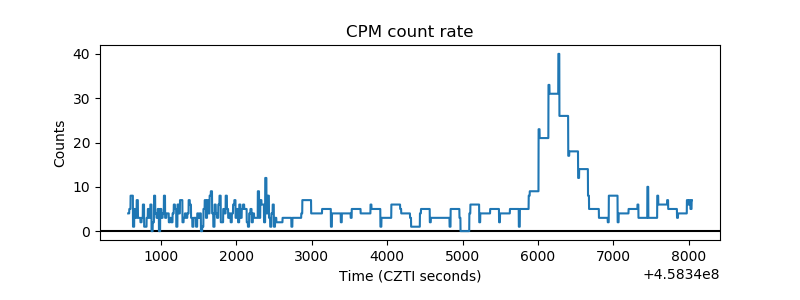 |
| CZT Counter | 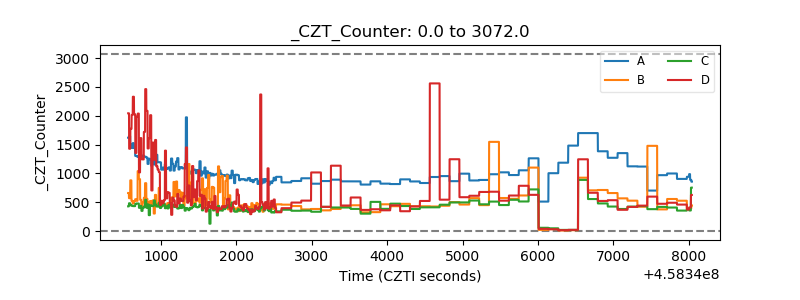 |
| +2.5 Volts monitor | 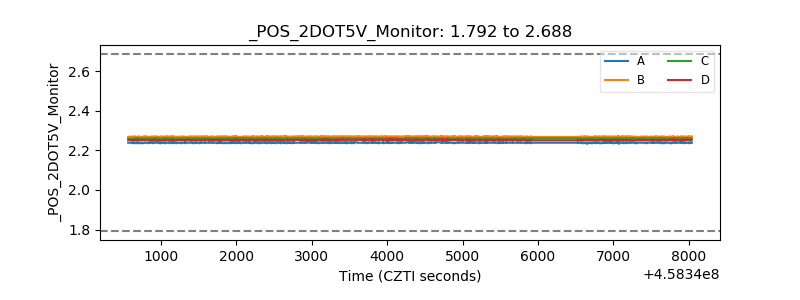 |
| +5 Volts monitor | 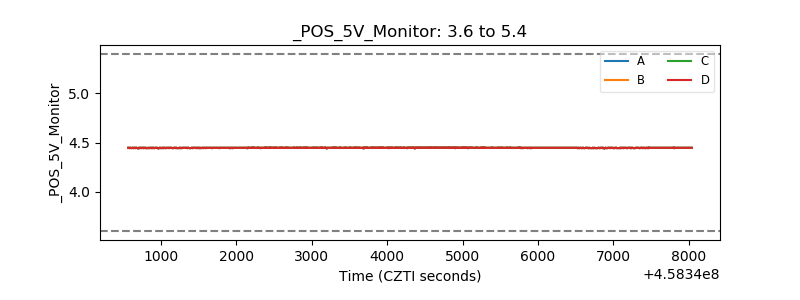 |
| _ROLL_ROT | 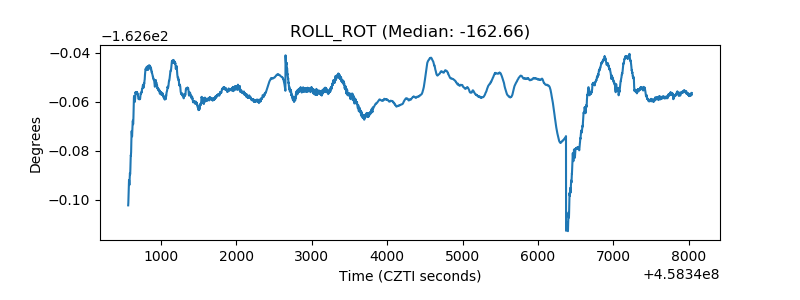 |
| _Roll_DEC | 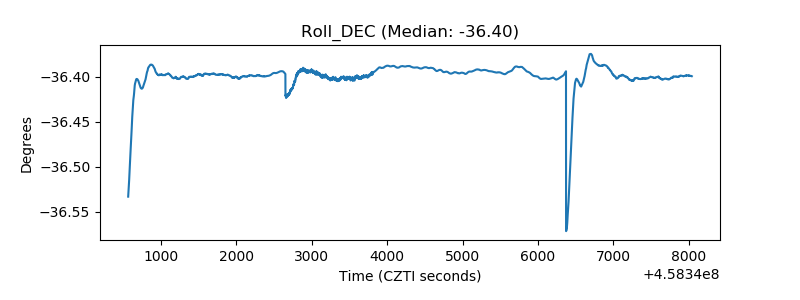 |
| _Roll_RA | 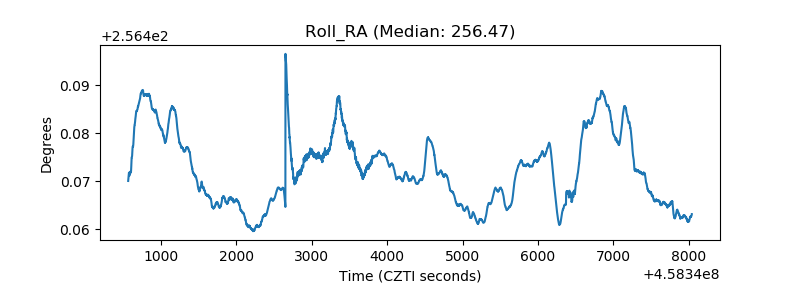 |
| Veto Counter | 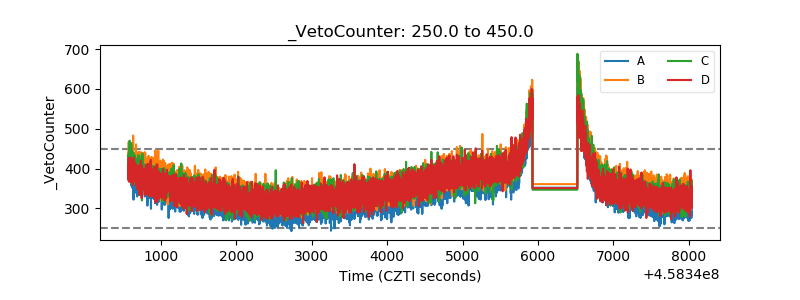 |