| Param | Original file | Final file |
|---|---|---|
| Filename | modeM0/AS1C09_002T01_9000006334_47532cztM0_level2.fits | modeM0/AS1C09_002T01_9000006334_47532cztM0_level2_quad_clean.evt |
| Size (bytes) | 477,541,440 | 112,285,440 |
| Size | 455.4 MB | 107.1 MB |
| Events in quadrant A | 6,856,965 | 754,494 |
| Events in quadrant B | 3,344,269 | 772,898 |
| Events in quadrant C | 2,894,342 | 750,417 |
| Events in quadrant D | 4,086,397 | 676,833 |
| Mode M0 | |||
|---|---|---|---|
| Quadrant | BADHDUFLAG | Total packets | Discarded packets |
| A | 0 | 24821 | 1 |
| B | 0 | 14003 | 1 |
| C | 0 | 13112 | 1 |
| D | 0 | 16546 | 1 |
| Mode M9 | |||
|---|---|---|---|
| Quadrant | BADHDUFLAG | Total packets | Discarded packets |
| A | 0 | 12 | 0 |
| B | 0 | 12 | 0 |
| C | 0 | 12 | 0 |
| D | 0 | 12 | 0 |
| Mode SS | |||
|---|---|---|---|
| Quadrant | BADHDUFLAG | Total packets | Discarded packets |
| A | 0 | 130 | 0 |
| B | 0 | 130 | 0 |
| C | 0 | 130 | 0 |
| D | 0 | 130 | 0 |
| Quadrant | Total seconds | Saturated seconds | Saturation percentage |
|---|---|---|---|
| A | 6381 | 279 | 4.372355% |
| B | 6382 | 217 | 3.400188% |
| C | 6382 | 75 | 1.175180% |
| D | 6382 | 269 | 4.214980% |
Noise dominated data is calculated using 1-second bins in cleaned event files. If a bin has >2000 counts, and if more than 50% of those come from <1% of pixels, then it is considered to be noise-dominated and hence unusable.
| Quadrant | # 1 sec bins | Bins with >0 counts | Bins with >2000 counts | High rate bins dominated by noise | Noise dominated (total time) | Noise dominated (detector-on time) | Marked lightcurve |
|---|---|---|---|---|---|---|---|
| A | 7571 | 6381 | 40 | 40 | 0.53% | 0.63% | 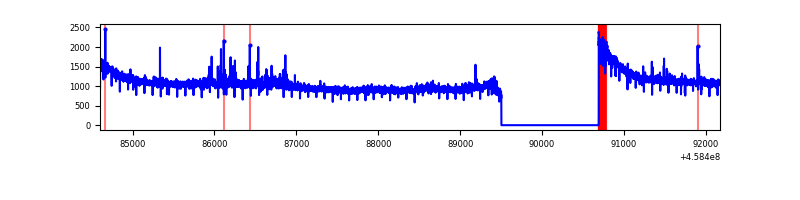 |
| B | 7572 | 6382 | 101 | 101 | 1.33% | 1.58% | 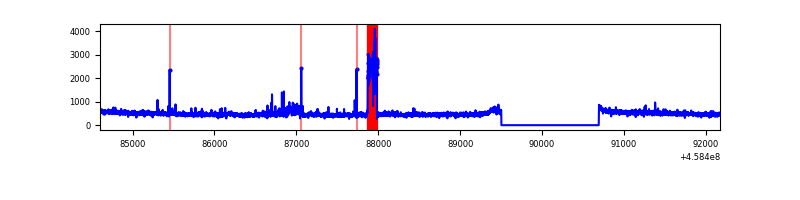 |
| C | 7572 | 6382 | 4 | 4 | 0.05% | 0.06% | 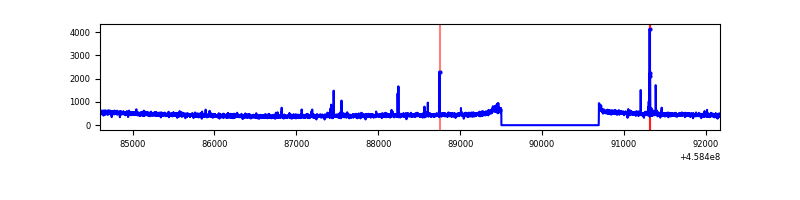 |
| D | 7572 | 6382 | 161 | 161 | 2.13% | 2.52% | 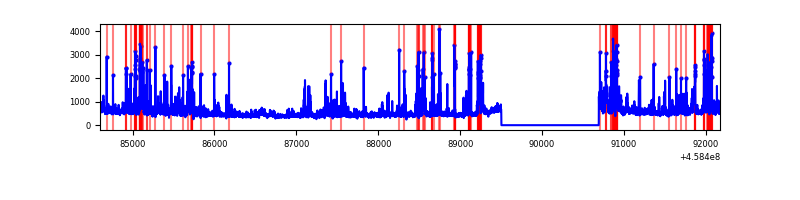 |
Top three noisy pixels from each quadrant. If the there are fewer than three noisy pixels in the level2.evt file, extra rows are filled as -1
| Pixel properties | Quadrant properties | ||||||
|---|---|---|---|---|---|---|---|
| Quadrant | DetID | PixID | Counts | Sigma | Mean | Median | Sigma |
| A | 10 | 83 | 3818721 | 24853.95 | 748 | 734 | 153.6 |
| A | 9 | 191 | 130963 | 847.75 | 748 | 734 | 153.6 |
| A | 13 | 248 | 12124 | 74.15 | 748 | 734 | 153.6 |
| B | 5 | 172 | 273876 | 1939.65 | 741 | 721 | 140.8 |
| B | 0 | 200 | 50419 | 352.9 | 741 | 721 | 140.8 |
| B | 0 | 198 | 33299 | 231.33 | 741 | 721 | 140.8 |
| C | 12 | 2 | 19355 | 109.13 | 731 | 735 | 170.6 |
| C | 1 | 3 | 11267 | 61.73 | 731 | 735 | 170.6 |
| C | 15 | 208 | 6446 | 33.47 | 731 | 735 | 170.6 |
| D | 2 | 249 | 611274 | 3400.58 | 730 | 706 | 179.5 |
| D | 2 | 165 | 224424 | 1246.0 | 730 | 706 | 179.5 |
| D | 7 | 96 | 129792 | 718.95 | 730 | 706 | 179.5 |
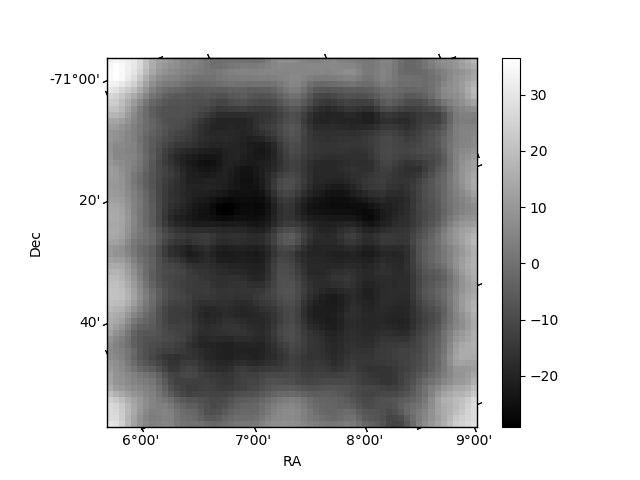
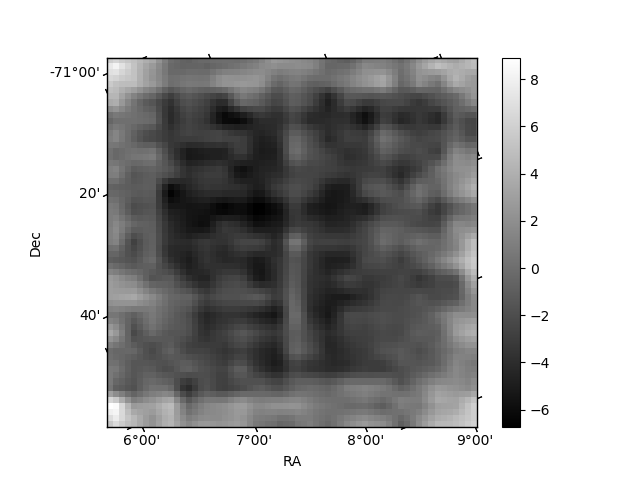
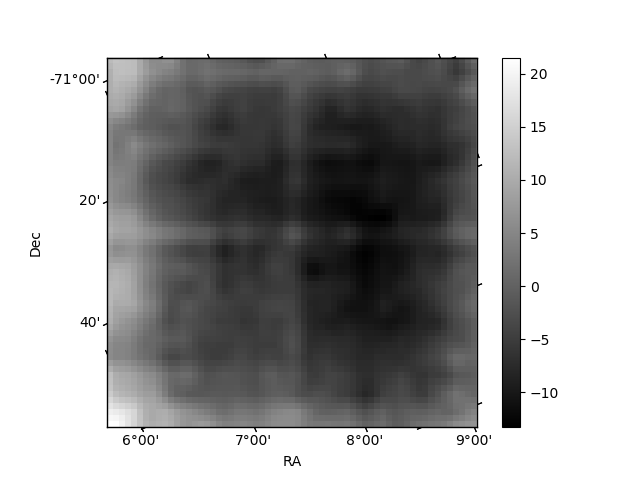
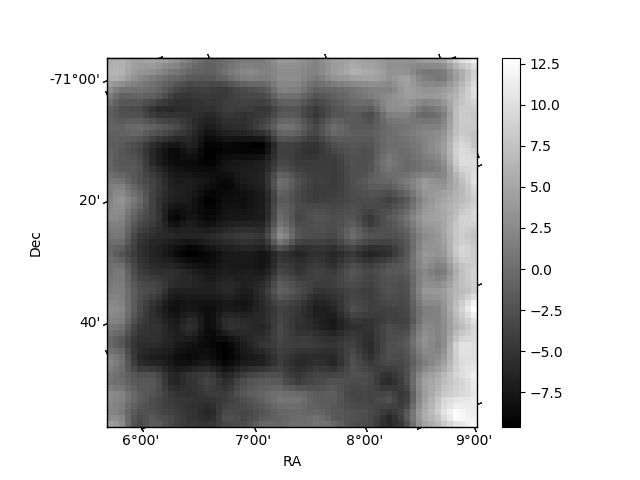
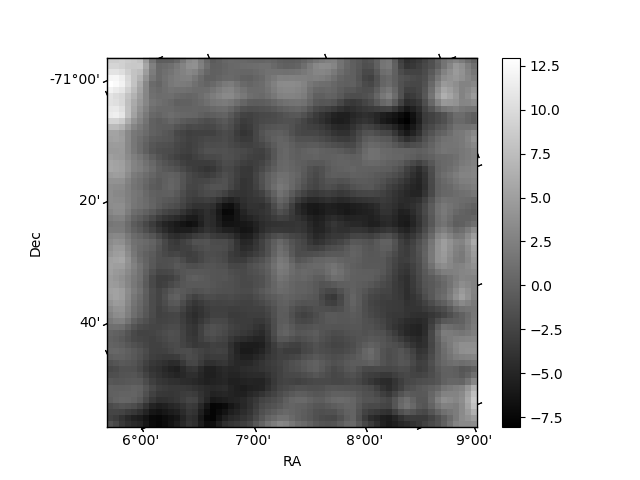
Histogram calculated using DETX and DETY for each event in the final _common_clean file
| Quadrant A | 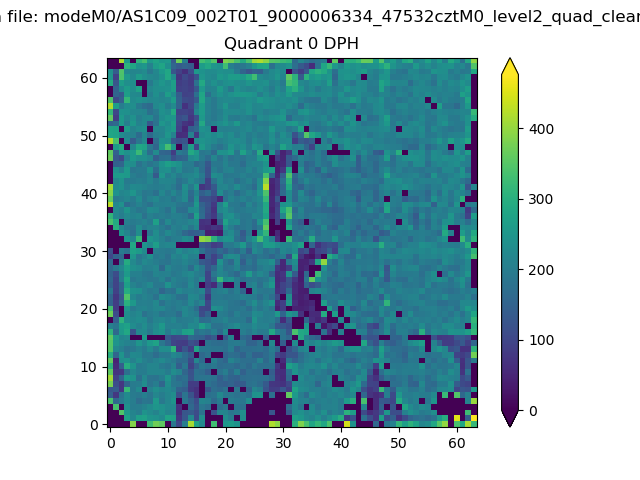 |
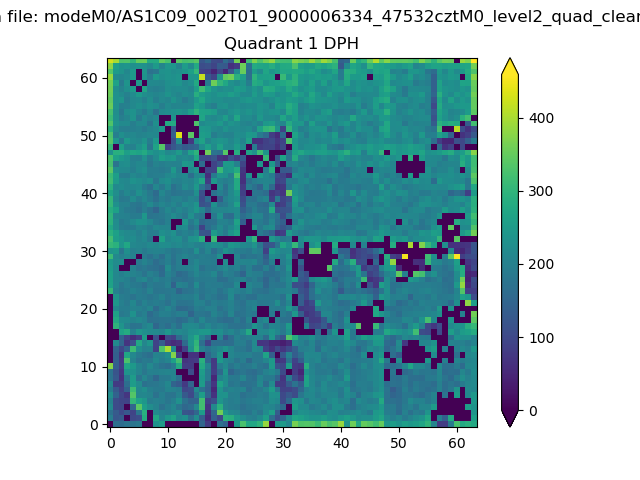 |
Quadrant B |
|---|---|---|---|
| Quadrant D | 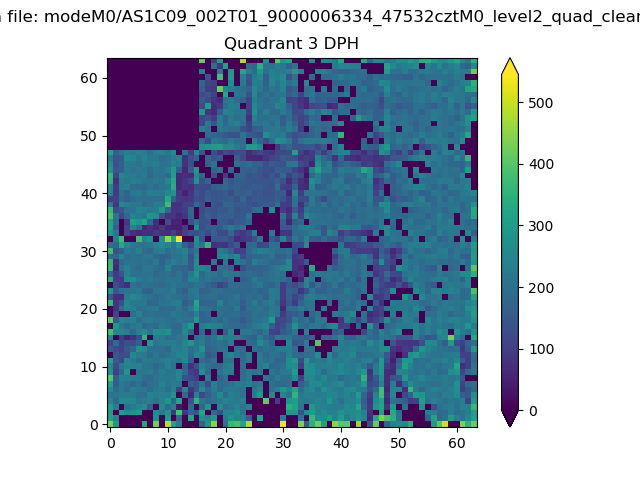 |
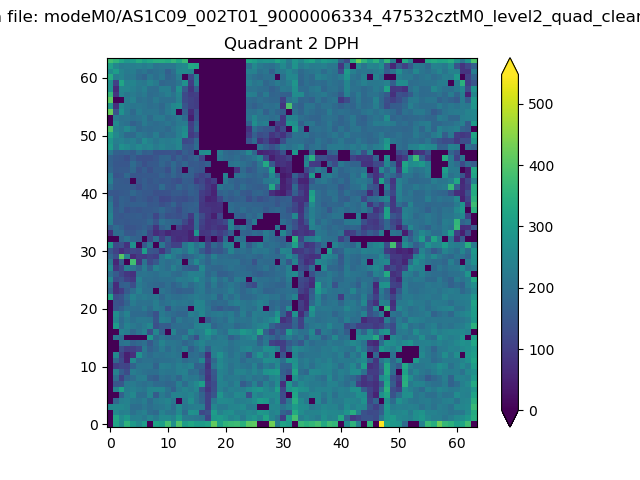 |
Quadrant C |
| Plot type | Count rate plots | Images |
|---|---|---|
| Comparison with Poisson distribution Blue bars denote a histogram of data divided into 1 sec bins. Red curve is a Poisson curve with rate = median count rate of data. |
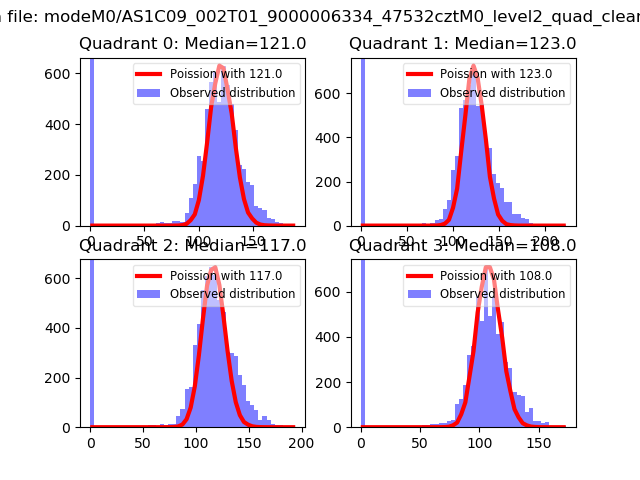 |
 |
| Quadrant-wise count rates Data is divided into 100 sec bins |
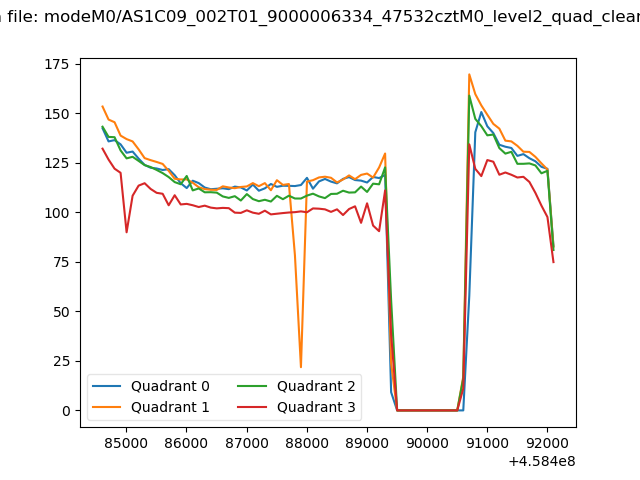 |
|
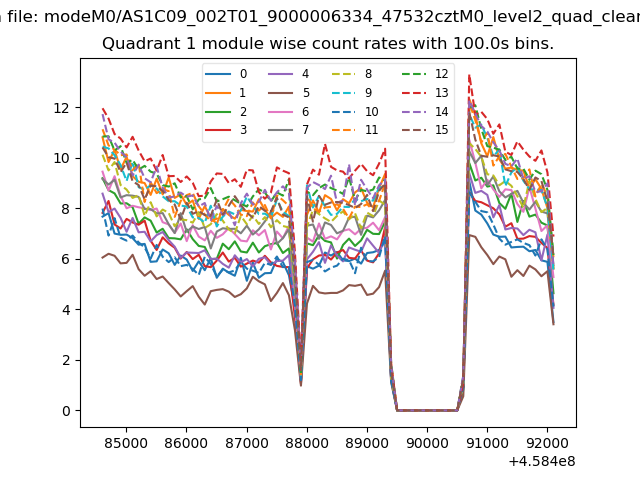
| Module-wise count rates for Quadrant A Data is divided into 100 sec bins |
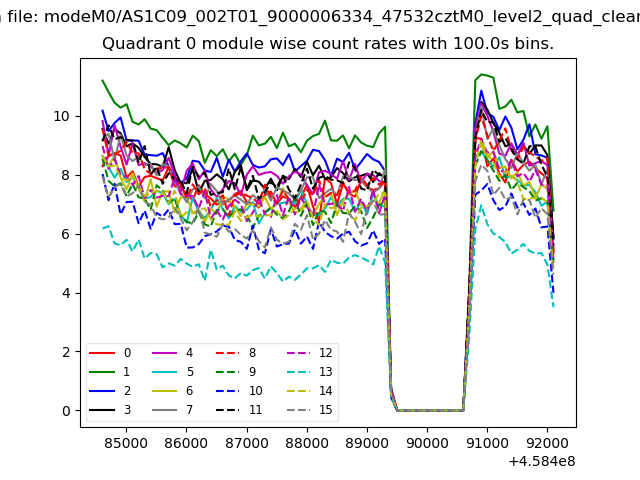 |
 |
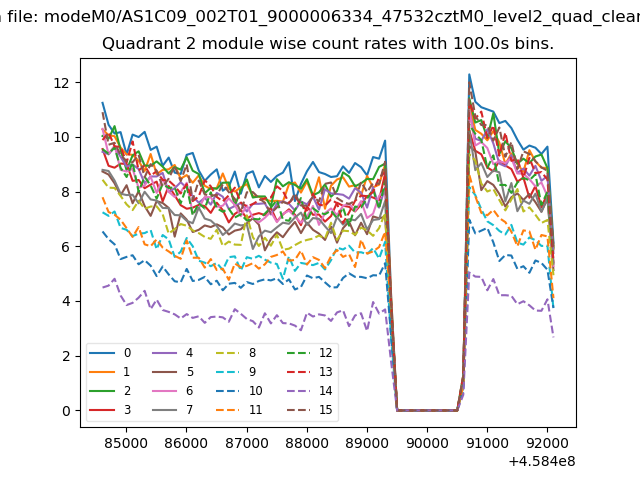
| Module-wise count rates for Quadrant B Data is divided into 100 sec bins |
 |
 |
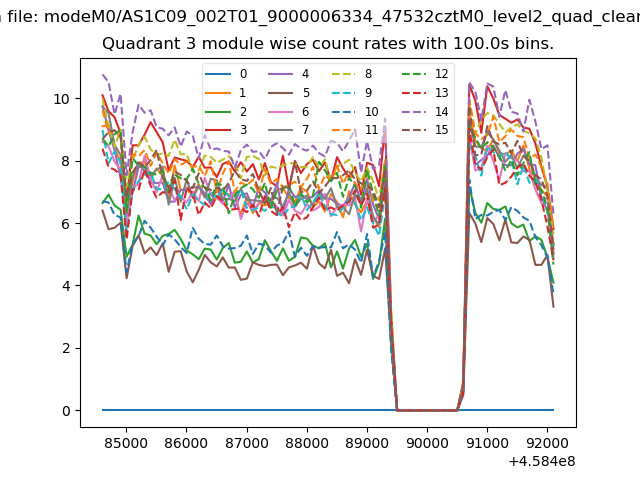
| Module-wise count rates for Quadrant C Data is divided into 100 sec bins |
 |
 |
| Module-wise count rates for Quadrant D Data is divided into 100 sec bins |
 |
 |
| Parameter | Plot |
|---|---|
| CZT HV Monitor | 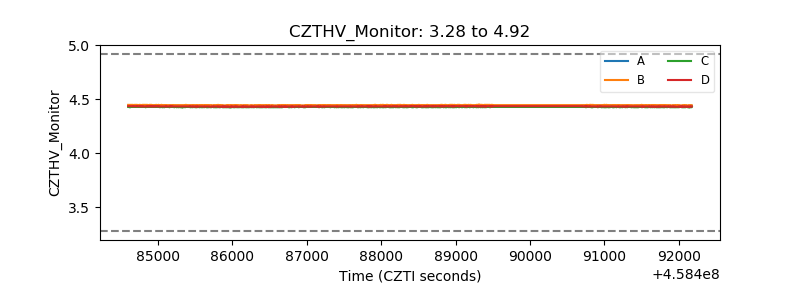 |
| D_VDD | 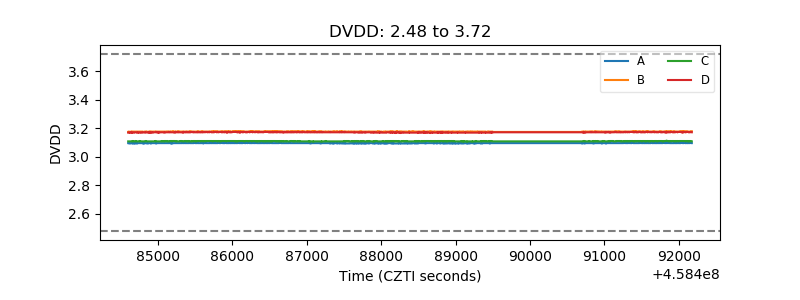 |
| Temperature 1 | 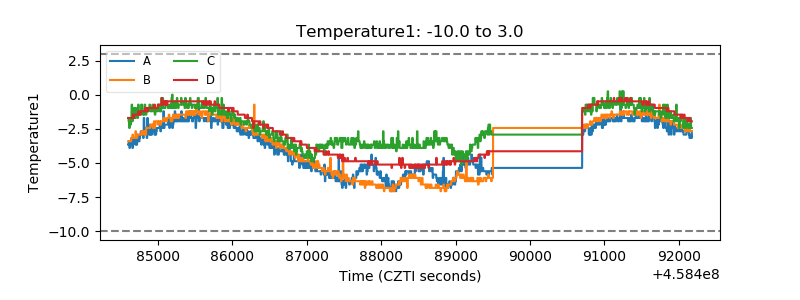 |
| Veto HV Monitor |  |
| Veto LLD | 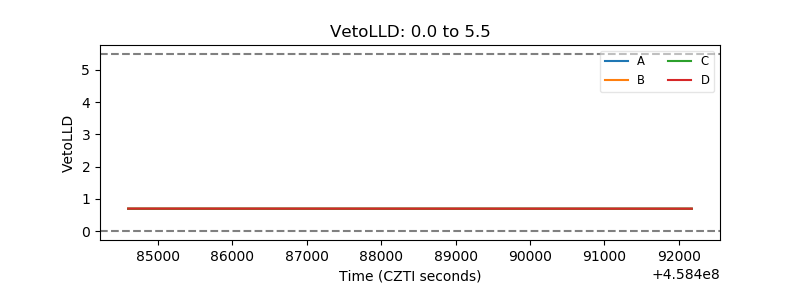 |
| Alpha Counter | 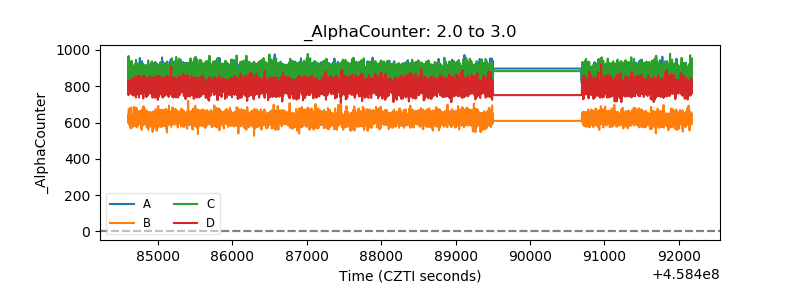 |
| _CPM_Rate | 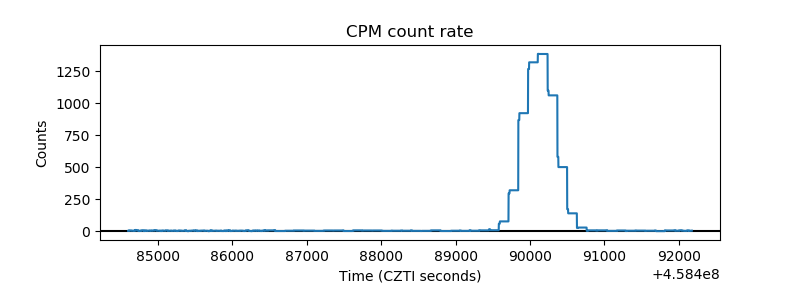 |
| CZT Counter | 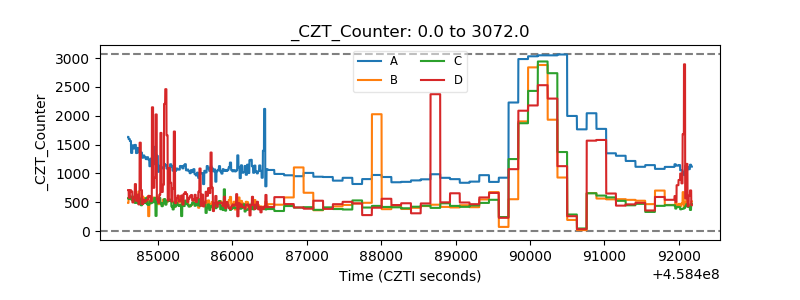 |
| +2.5 Volts monitor | 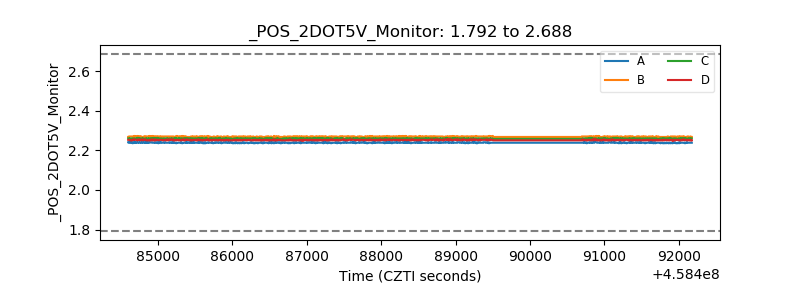 |
| +5 Volts monitor | 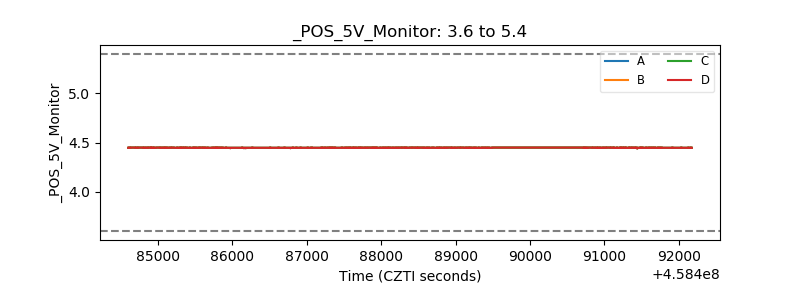 |
| _ROLL_ROT | 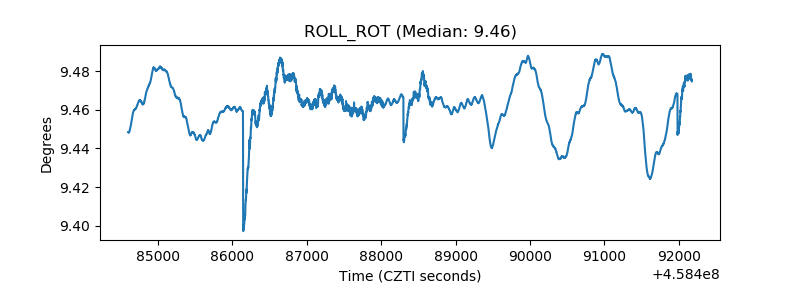 |
| _Roll_DEC | 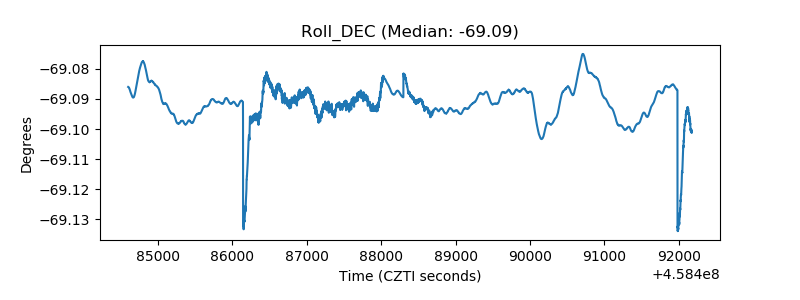 |
| _Roll_RA | 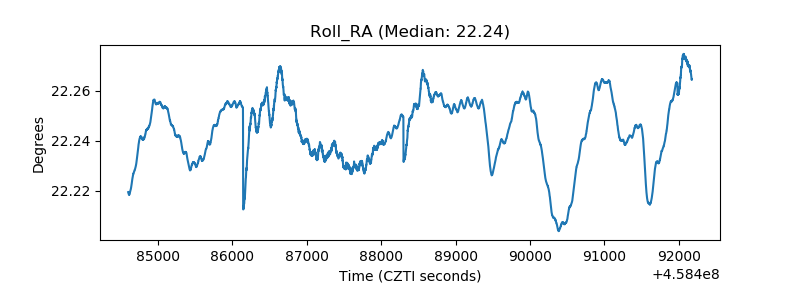 |
| Veto Counter | 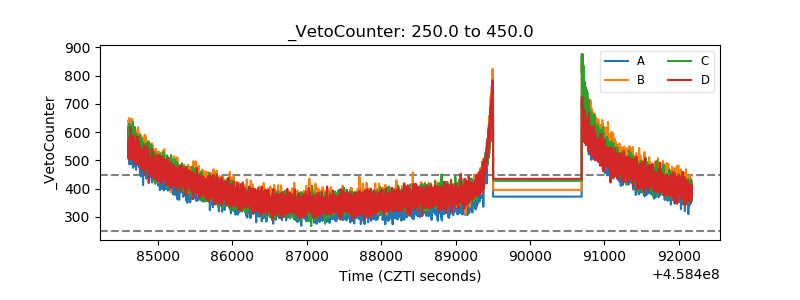 |