| Param | Original file | Final file |
|---|---|---|
| Filename | modeM0/AS1A13_082T01_9000006342_47691cztM0_level2.fits | modeM0/AS1A13_082T01_9000006342_47691cztM0_level2_quad_clean.evt |
| Size (bytes) | 509,123,520 | 117,754,560 |
| Size | 485.5 MB | 112.3 MB |
| Events in quadrant A | 7,359,787 | 770,352 |
| Events in quadrant B | 3,668,157 | 810,651 |
| Events in quadrant C | 3,173,037 | 784,247 |
| Events in quadrant D | 4,105,789 | 715,839 |
| Mode M0 | |||
|---|---|---|---|
| Quadrant | BADHDUFLAG | Total packets | Discarded packets |
| A | 0 | 26894 | 2 |
| B | 0 | 15512 | 2 |
| C | 0 | 14306 | 2 |
| D | 0 | 16844 | 2 |
| Mode SS | |||
|---|---|---|---|
| Quadrant | BADHDUFLAG | Total packets | Discarded packets |
| A | 0 | 142 | 0 |
| B | 0 | 142 | 0 |
| C | 0 | 142 | 0 |
| D | 0 | 142 | 0 |
| Mode M9 | |||
|---|---|---|---|
| Quadrant | BADHDUFLAG | Total packets | Discarded packets |
| A | 0 | 11 | 0 |
| B | 0 | 11 | 0 |
| C | 0 | 11 | 0 |
| D | 0 | 11 | 0 |
| Quadrant | Total seconds | Saturated seconds | Saturation percentage |
|---|---|---|---|
| A | 6955 | 303 | 4.356578% |
| B | 6955 | 132 | 1.897915% |
| C | 6955 | 65 | 0.934579% |
| D | 6955 | 149 | 2.142344% |
Noise dominated data is calculated using 1-second bins in cleaned event files. If a bin has >2000 counts, and if more than 50% of those come from <1% of pixels, then it is considered to be noise-dominated and hence unusable.
| Quadrant | # 1 sec bins | Bins with >0 counts | Bins with >2000 counts | High rate bins dominated by noise | Noise dominated (total time) | Noise dominated (detector-on time) | Marked lightcurve |
|---|---|---|---|---|---|---|---|
| A | 8055 | 6955 | 95 | 95 | 1.18% | 1.37% | 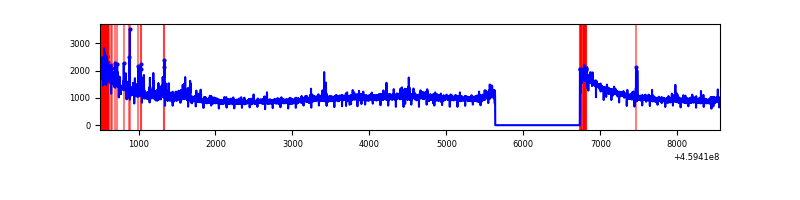 |
| B | 8055 | 6955 | 33 | 33 | 0.41% | 0.47% | 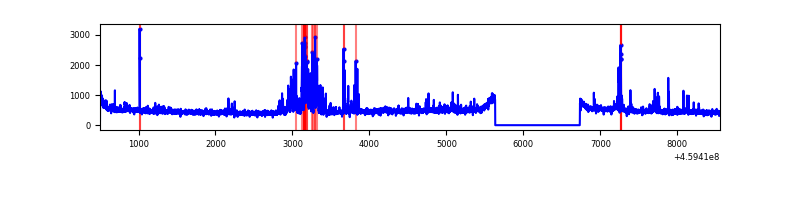 |
| C | 8055 | 6955 | 1 | 1 | 0.01% | 0.01% | 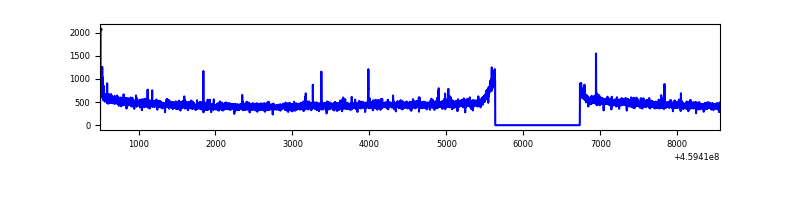 |
| D | 8055 | 6955 | 71 | 71 | 0.88% | 1.02% | 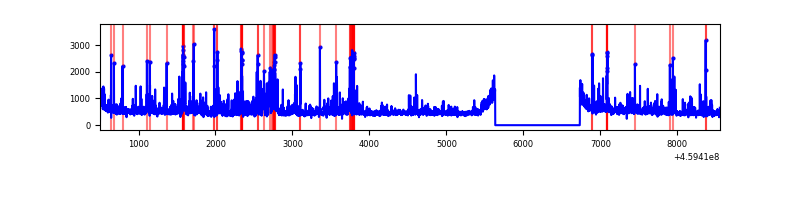 |
Top three noisy pixels from each quadrant. If the there are fewer than three noisy pixels in the level2.evt file, extra rows are filled as -1
| Pixel properties | Quadrant properties | ||||||
|---|---|---|---|---|---|---|---|
| Quadrant | DetID | PixID | Counts | Sigma | Mean | Median | Sigma |
| A | 10 | 83 | 3928037 | 23480.46 | 802 | 784 | 167.3 |
| A | 9 | 191 | 325430 | 1941.01 | 802 | 784 | 167.3 |
| A | 13 | 6 | 13174 | 74.08 | 802 | 784 | 167.3 |
| B | 0 | 200 | 444554 | 2799.37 | 805 | 781 | 158.5 |
| B | 0 | 190 | 23409 | 142.74 | 805 | 781 | 158.5 |
| B | 12 | 111 | 20146 | 122.16 | 805 | 781 | 158.5 |
| C | 14 | 254 | 19991 | 100.94 | 806 | 813 | 190.0 |
| C | 3 | 233 | 7254 | 33.9 | 806 | 813 | 190.0 |
| C | 13 | 61 | 5409 | 24.19 | 806 | 813 | 190.0 |
| D | 10 | 181 | 453352 | 2271.63 | 804 | 781 | 199.2 |
| D | 2 | 165 | 169102 | 844.87 | 804 | 781 | 199.2 |
| D | 12 | 218 | 121377 | 605.32 | 804 | 781 | 199.2 |
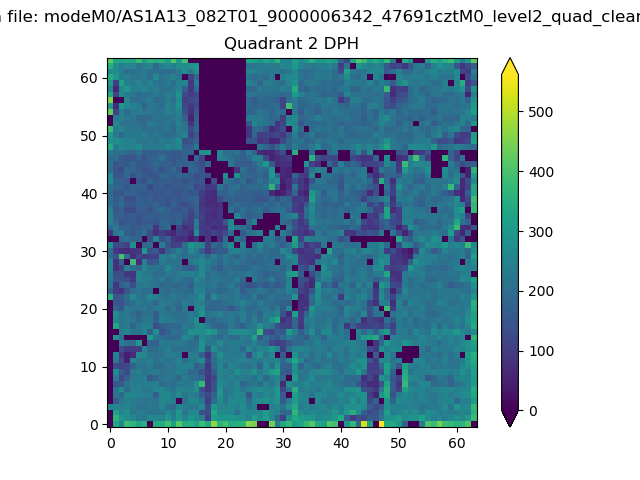
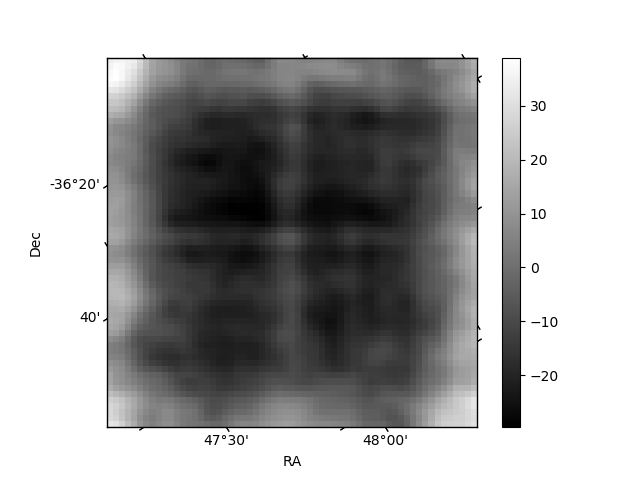
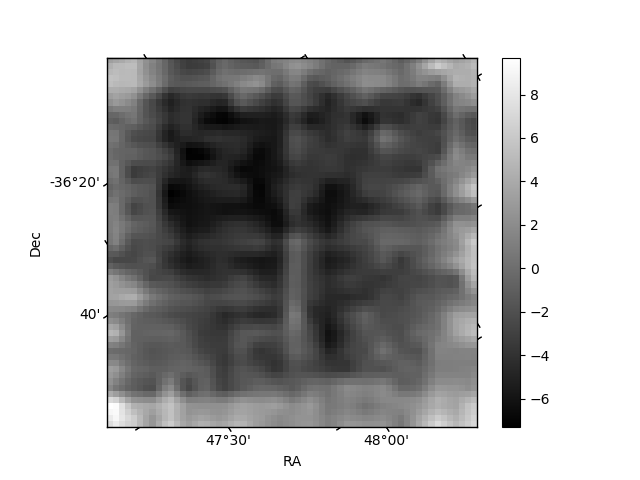
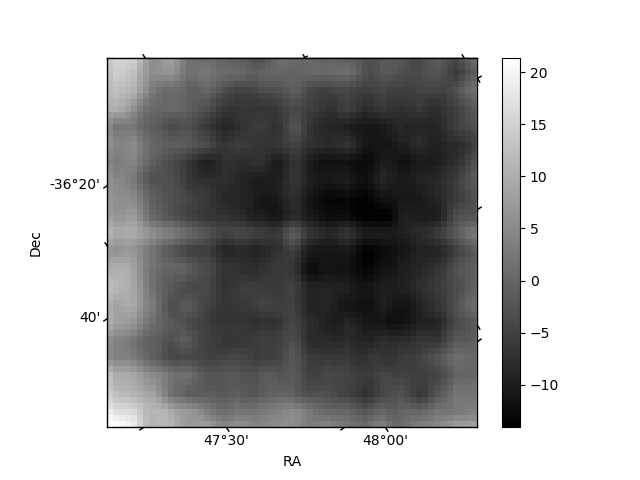
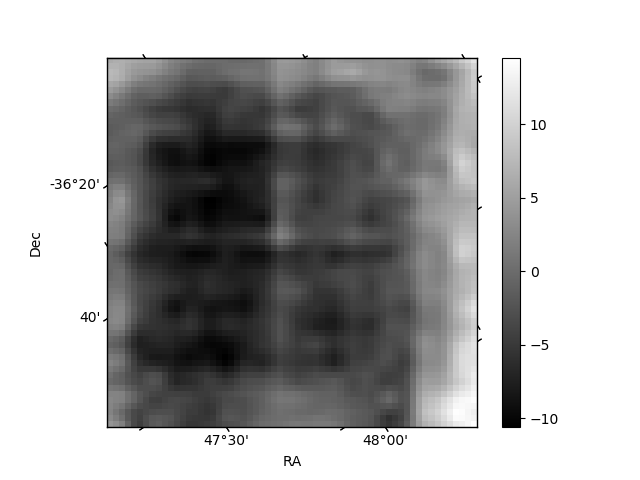
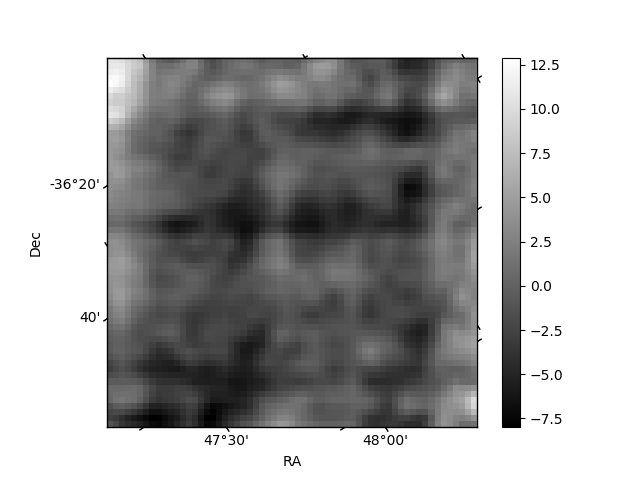
Histogram calculated using DETX and DETY for each event in the final _common_clean file
| Quadrant A | 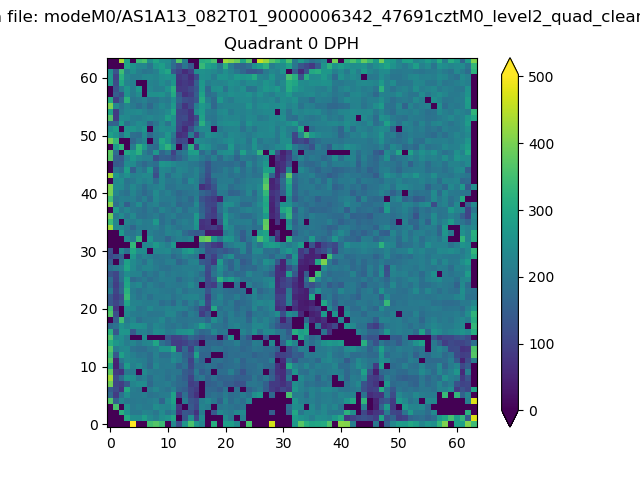 |
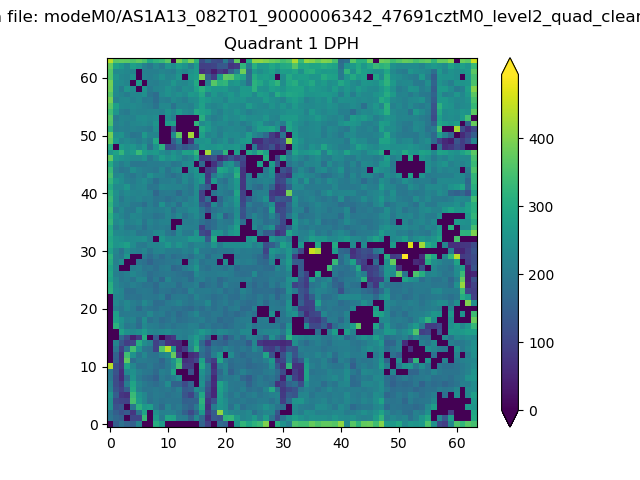 |
Quadrant B |
|---|---|---|---|
| Quadrant D | 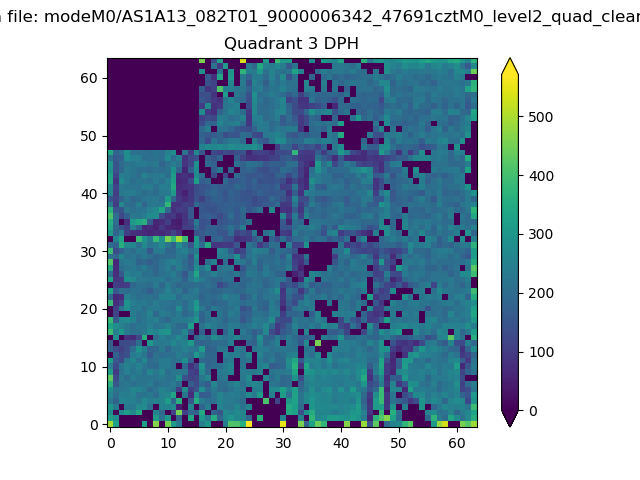 |
 |
Quadrant C |
| Plot type | Count rate plots | Images |
|---|---|---|
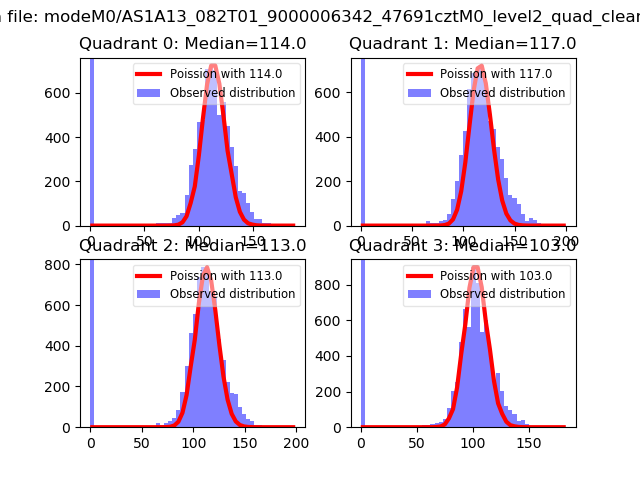
| Comparison with Poisson distribution Blue bars denote a histogram of data divided into 1 sec bins. Red curve is a Poisson curve with rate = median count rate of data. |
 |
 |
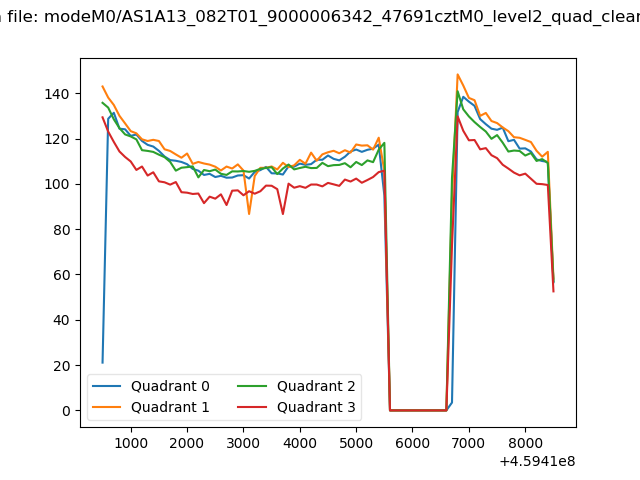
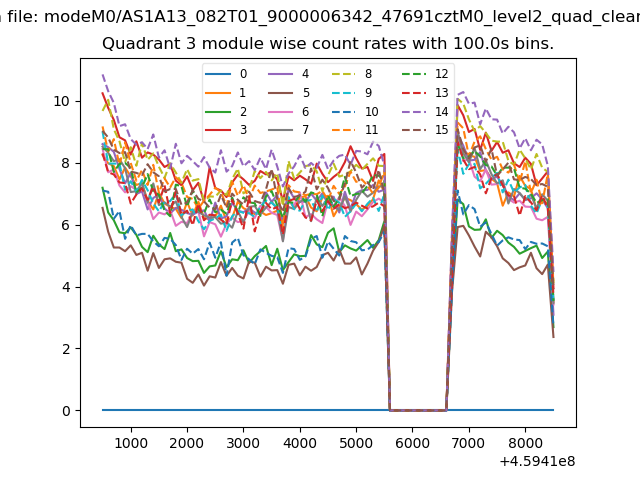
| Quadrant-wise count rates Data is divided into 100 sec bins |
 |
|
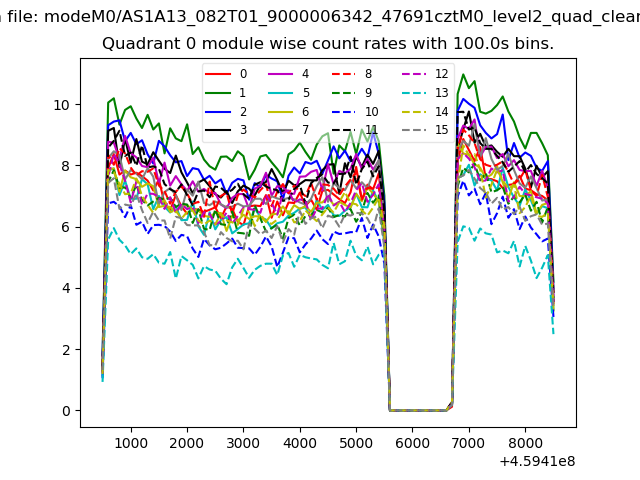
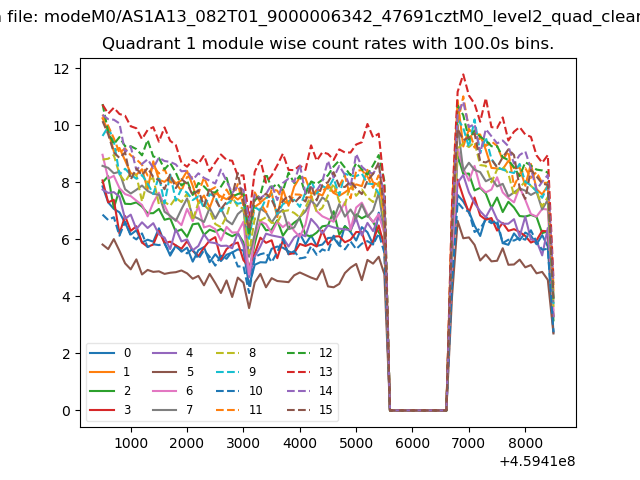
| Module-wise count rates for Quadrant A Data is divided into 100 sec bins |
 |
 |
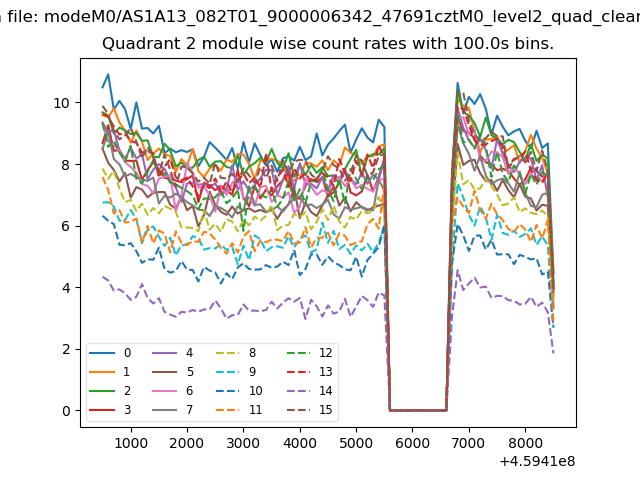
| Module-wise count rates for Quadrant B Data is divided into 100 sec bins |
 |
 |
| Module-wise count rates for Quadrant C Data is divided into 100 sec bins |
 |
 |
| Module-wise count rates for Quadrant D Data is divided into 100 sec bins |
 |
 |
| Parameter | Plot |
|---|---|
| CZT HV Monitor | 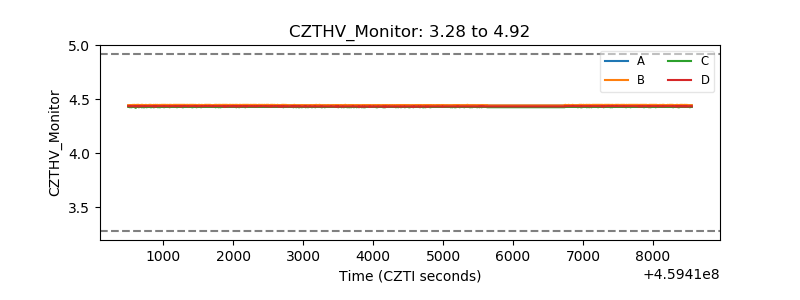 |
| D_VDD | 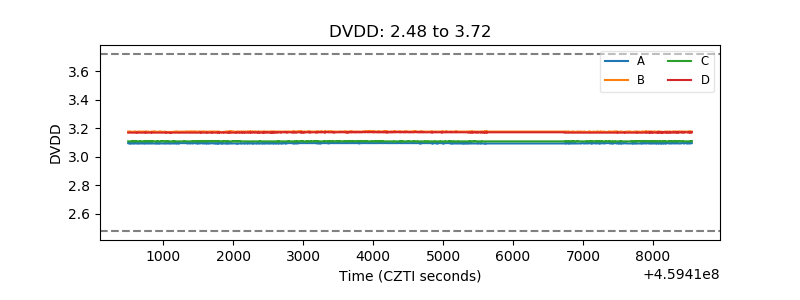 |
| Temperature 1 | 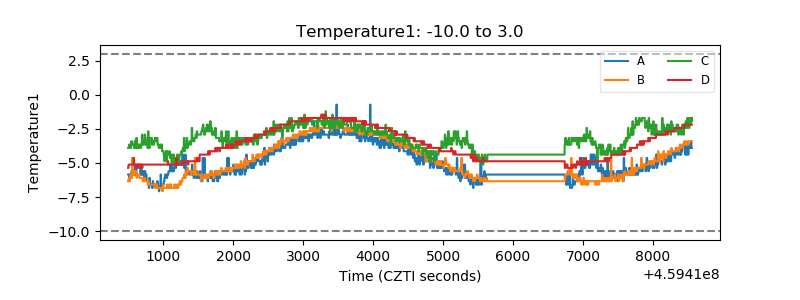 |
| Veto HV Monitor |  |
| Veto LLD | 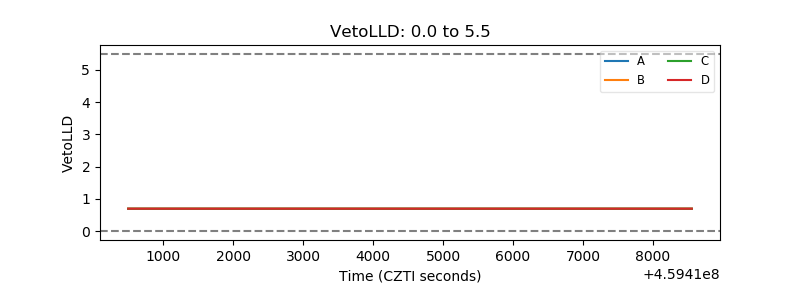 |
| Alpha Counter | 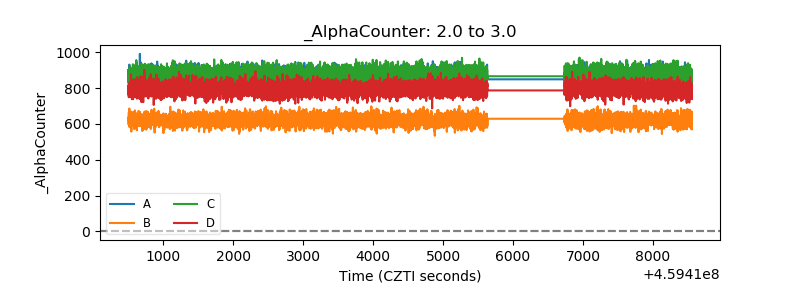 |
| _CPM_Rate | 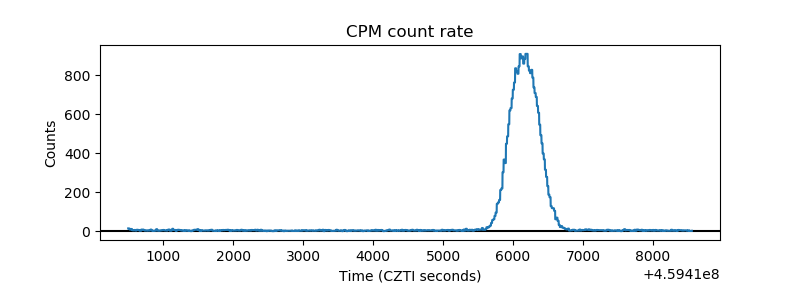 |
| CZT Counter | 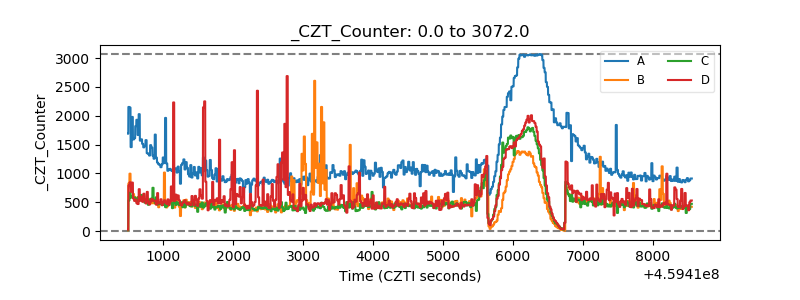 |
| +2.5 Volts monitor | 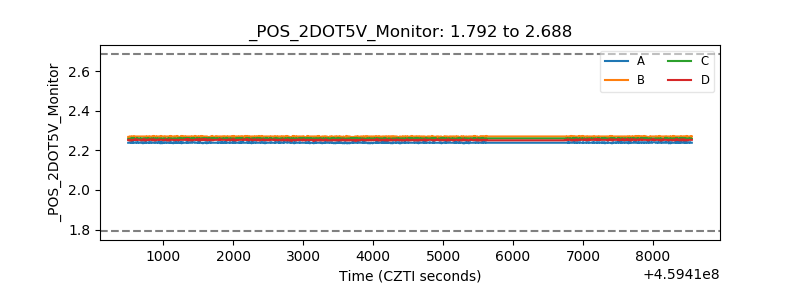 |
| +5 Volts monitor | 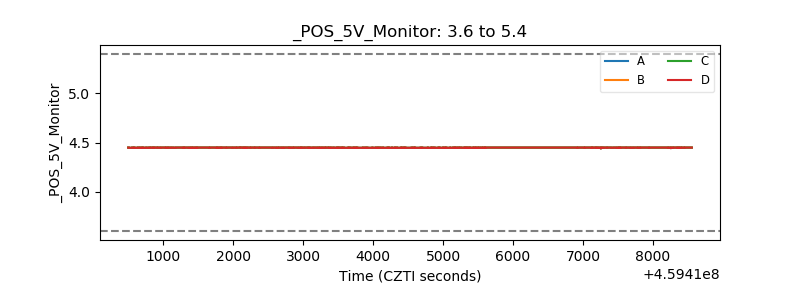 |
| _ROLL_ROT | 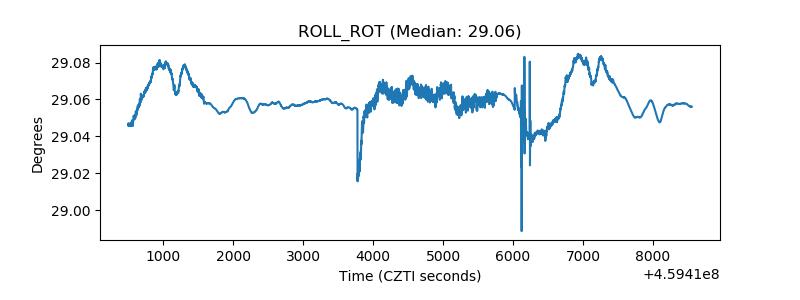 |
| _Roll_DEC | 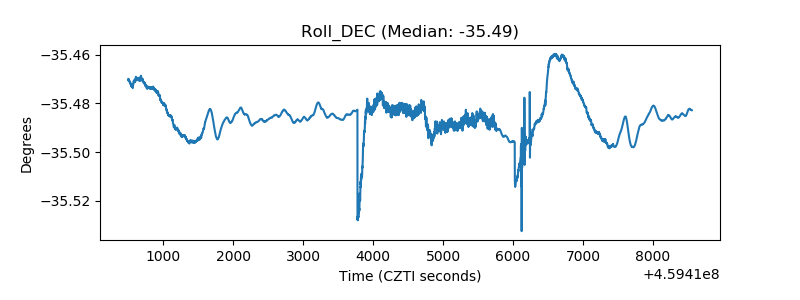 |
| _Roll_RA | 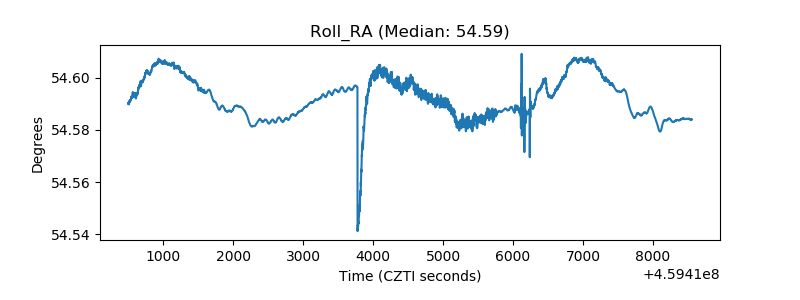 |
| Veto Counter | 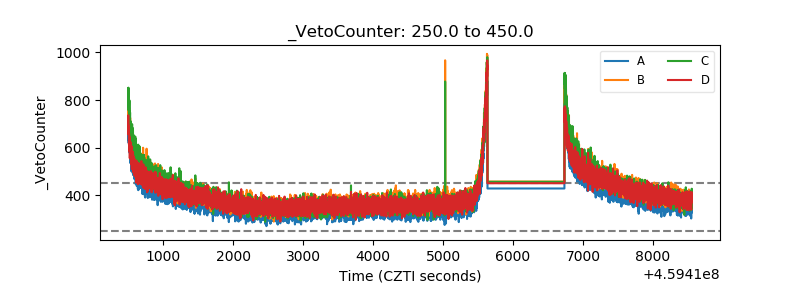 |