Observation information
- date-obs: 2024-07-26
- time-obs: 01:52:32.868900000
- date-end: 2024-07-26
- time-end: 03:56:42.857000000
- obs_id: T05_213T01_9000006344
- exposure: 5625.37914008
- sourceid: EXO 0748-676
- observer: unnati
- ra_pnt: 117.1405
- dec_pnt: -67.75214
Basic statistics of files
| Param |
Original file |
Final file |
|---|
| Filename | modeM0/AS1T05_213T01_9000006344_47733cztM0_level2.fits
| modeM0/AS1T05_213T01_9000006344_47733cztM0_level2_quad_clean.evt
|
| Size (bytes) | 489,862,080 | 101,805,120 |
| Size | 467.2 MB
| 97.1 MB
|
| Events in quadrant A | 6,431,065 | 684,010 |
| Events in quadrant B | 2,993,875 | 711,195 |
| Events in quadrant C | 3,007,062 | 684,644 |
| Events in quadrant D | 5,200,259 | 552,853 |
Level1 data integrity
| Mode M9 |
|---|
| Quadrant | BADHDUFLAG | Total packets | Discarded packets |
|---|
| A | 0 | 10 | 0 |
| B | 0 | 10 | 0 |
| C | 0 | 10 | 0 |
| D | 0 | 10 | 0 |
| Mode SS |
|---|
| Quadrant | BADHDUFLAG | Total packets | Discarded packets |
|---|
| A | 0 | 130 | 0 |
| B | 0 | 130 | 0 |
| C | 0 | 130 | 0 |
| D | 0 | 130 | 0 |
| Mode M0 |
|---|
| Quadrant | BADHDUFLAG | Total packets | Discarded packets |
|---|
| A | 0 | 23742 | 1 |
| B | 0 | 13533 | 1 |
| C | 0 | 13680 | 1 |
| D | 0 | 20042 | 2 |
Data saturation
| Quadrant | Total seconds | Saturated seconds | Saturation percentage |
|---|
| A | 6450 | 144 | 2.232558% |
| B | 6450 | 46 | 0.713178% |
| C | 6451 | 46 | 0.713068% |
| D | 6450 | 847 | 13.131783% |
Noise dominated fraction
Noise dominated data is calculated using 1-second bins in cleaned event files. If a bin has >2000 counts, and if more than 50% of those come from <1% of pixels, then it is considered to be noise-dominated and hence unusable.
| Quadrant |
# 1 sec bins |
Bins with >0 counts |
Bins with >2000 counts |
High rate bins dominated by noise |
Noise dominated (total time) |
Noise dominated (detector-on time) |
Marked lightcurve |
|---|
| A | 7450 | 6451 | 24 | 24 | 0.32% | 0.37% |  |
|---|
| B | 7450 | 6451 | 10 | 10 | 0.13% | 0.16% |  |
|---|
| C | 7451 | 6452 | 26 | 26 | 0.35% | 0.40% |  |
|---|
| D | 7450 | 6451 | 481 | 481 | 6.46% | 7.46% |  |
|---|
Top noisy pixels
Top three noisy pixels from each quadrant. If the there are fewer than three noisy pixels in the level2.evt file, extra rows are filled as -1
| Pixel properties |
Quadrant properties |
|---|
| Quadrant |
DetID |
PixID |
Counts |
Sigma |
Mean |
Median |
Sigma |
|---|
| A | 10 | 83 | 3626910 | 24922.63 | 699 | 684 | 145.5 |
|---|
| A | 9 | 191 | 58662 | 398.48 | 699 | 684 | 145.5 |
|---|
| A | 7 | 3 | 21417 | 142.5 | 699 | 684 | 145.5 |
|---|
| B | 0 | 200 | 131656 | 954.05 | 702 | 680 | 137.3 |
|---|
| B | 5 | 255 | 30284 | 215.64 | 702 | 680 | 137.3 |
|---|
| B | 0 | 198 | 23889 | 169.06 | 702 | 680 | 137.3 |
|---|
| C | 14 | 254 | 272879 | 1650.62 | 699 | 702 | 164.9 |
|---|
| C | 0 | 207 | 8620 | 48.02 | 699 | 702 | 164.9 |
|---|
| C | 13 | 61 | 4527 | 23.2 | 699 | 702 | 164.9 |
|---|
| D | 2 | 165 | 2318335 | 13864.11 | 657 | 635 | 167.2 |
|---|
| D | 2 | 249 | 88437 | 525.22 | 657 | 635 | 167.2 |
|---|
| D | 7 | 204 | 86716 | 514.92 | 657 | 635 | 167.2 |
|---|
Detector plane histogram (DPH)
Histogram calculated using DETX and DETY for each event in the final _common_clean file
| Quadrant A |
 |
 |
Quadrant B |
|---|
| Quadrant D |
 |
 |
Quadrant C |
|---|
Count rate plots and images
| Plot type |
Count rate plots |
Images |
Comparison with Poisson distribution
Blue bars denote a histogram of data divided into 1 sec bins.
Red curve is a Poisson curve with rate = median count rate of data. |
 |
 |
Quadrant-wise count rates
Data is divided into 100 sec bins |
 |
 |
Module-wise count rates for Quadrant A
Data is divided into 100 sec bins |
 |
 |
Module-wise count rates for Quadrant B
Data is divided into 100 sec bins |
 |
 |
Module-wise count rates for Quadrant C
Data is divided into 100 sec bins |
 |
 |
Module-wise count rates for Quadrant D
Data is divided into 100 sec bins |
 |
 |
Housekeeping plots
| Parameter |
Plot |
| CZT HV Monitor |  |
|---|
| D_VDD |  |
|---|
| Temperature 1 |  |
|---|
| Veto HV Monitor |  |
|---|
| Veto LLD |  |
|---|
| Alpha Counter |  |
|---|
| _CPM_Rate |  |
|---|
| CZT Counter |  |
|---|
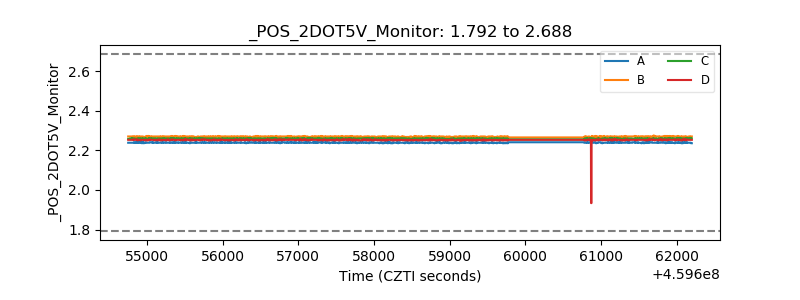
| +2.5 Volts monitor |  |
|---|
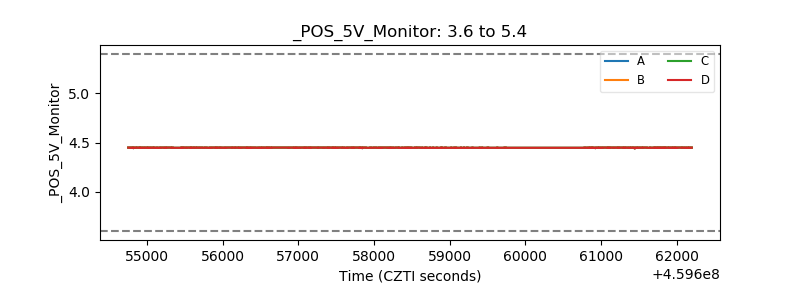
| +5 Volts monitor |  |
|---|
| _ROLL_ROT |  |
|---|
| _Roll_DEC |  |
|---|
| _Roll_RA |  |
|---|
| Veto Counter |  |
|---|


