| Param | Original file | Final file |
|---|---|---|
| Filename | modeM0/AS1C09_004T02_9000006348_47774cztM0_level2.fits | modeM0/AS1C09_004T02_9000006348_47774cztM0_level2_quad_clean.evt |
| Size (bytes) | 1,297,935,360 | 281,543,040 |
| Size | 1.2 GB | 268.5 MB |
| Events in quadrant A | 18,765,482 | 1,857,831 |
| Events in quadrant B | 8,862,244 | 1,899,243 |
| Events in quadrant C | 8,520,495 | 1,830,698 |
| Events in quadrant D | 10,497,358 | 1,686,480 |
| Mode M0 | |||
|---|---|---|---|
| Quadrant | BADHDUFLAG | Total packets | Discarded packets |
| A | 0 | 67426 | 3 |
| B | 0 | 39433 | 3 |
| C | 0 | 39060 | 3 |
| D | 0 | 44431 | 3 |
| Mode SS | |||
|---|---|---|---|
| Quadrant | BADHDUFLAG | Total packets | Discarded packets |
| A | 0 | 370 | 0 |
| B | 0 | 370 | 0 |
| C | 0 | 370 | 0 |
| D | 0 | 370 | 0 |
| Mode M9 | |||
|---|---|---|---|
| Quadrant | BADHDUFLAG | Total packets | Discarded packets |
| A | 0 | 18 | 0 |
| B | 0 | 18 | 0 |
| C | 0 | 18 | 0 |
| D | 0 | 18 | 0 |
| Quadrant | Total seconds | Saturated seconds | Saturation percentage |
|---|---|---|---|
| A | 18121 | 603 | 3.327631% |
| B | 18122 | 198 | 1.092595% |
| C | 18122 | 180 | 0.993268% |
| D | 18122 | 421 | 2.323143% |
Noise dominated data is calculated using 1-second bins in cleaned event files. If a bin has >2000 counts, and if more than 50% of those come from <1% of pixels, then it is considered to be noise-dominated and hence unusable.
| Quadrant | # 1 sec bins | Bins with >0 counts | Bins with >2000 counts | High rate bins dominated by noise | Noise dominated (total time) | Noise dominated (detector-on time) | Marked lightcurve |
|---|---|---|---|---|---|---|---|
| A | 19916 | 18124 | 145 | 145 | 0.73% | 0.80% | 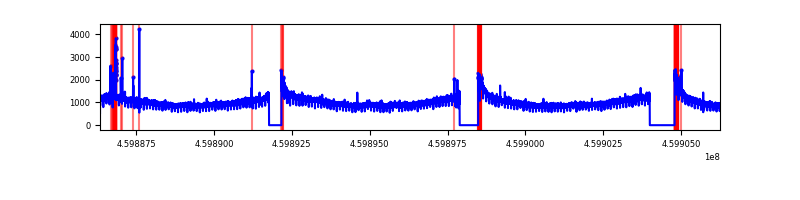 |
| B | 19917 | 18125 | 63 | 63 | 0.32% | 0.35% | 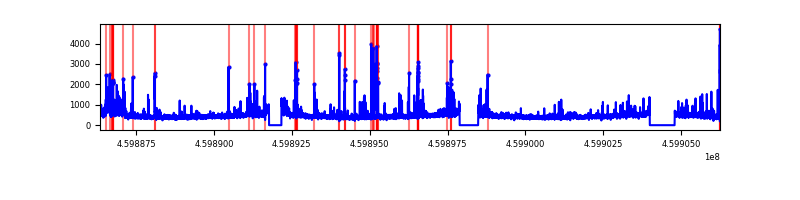 |
| C | 19917 | 18125 | 105 | 105 | 0.53% | 0.58% | 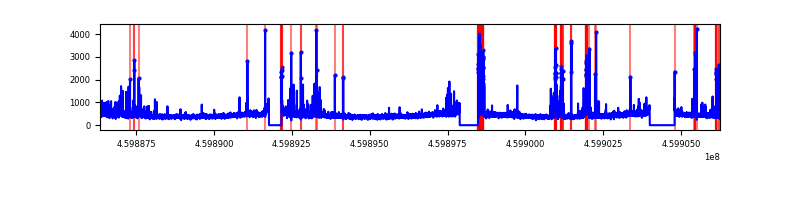 |
| D | 19917 | 18125 | 264 | 264 | 1.33% | 1.46% | 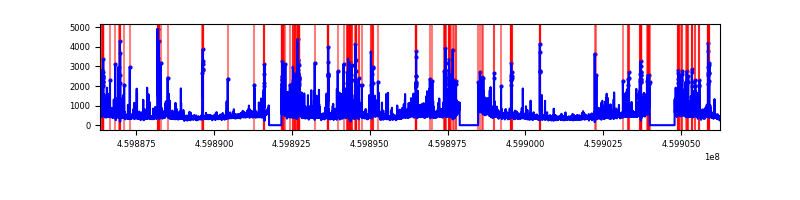 |
Top three noisy pixels from each quadrant. If the there are fewer than three noisy pixels in the level2.evt file, extra rows are filled as -1
| Pixel properties | Quadrant properties | ||||||
|---|---|---|---|---|---|---|---|
| Quadrant | DetID | PixID | Counts | Sigma | Mean | Median | Sigma |
| A | 10 | 83 | 10991269 | 27106.28 | 1946 | 1906 | 405.4 |
| A | 15 | 174 | 118807 | 288.35 | 1946 | 1906 | 405.4 |
| A | 13 | 6 | 70763 | 169.84 | 1946 | 1906 | 405.4 |
| B | 0 | 186 | 288492 | 753.65 | 1955 | 1893 | 380.3 |
| B | 5 | 32 | 220905 | 575.92 | 1955 | 1893 | 380.3 |
| B | 5 | 255 | 120322 | 311.43 | 1955 | 1893 | 380.3 |
| C | 12 | 2 | 496299 | 1094.23 | 1926 | 1930 | 451.8 |
| C | 14 | 254 | 369889 | 814.44 | 1926 | 1930 | 451.8 |
| C | 1 | 3 | 93633 | 202.97 | 1926 | 1930 | 451.8 |
| D | 2 | 165 | 1180448 | 2472.19 | 1916 | 1855 | 476.7 |
| D | 2 | 249 | 485237 | 1013.93 | 1916 | 1855 | 476.7 |
| D | 7 | 67 | 238291 | 495.94 | 1916 | 1855 | 476.7 |
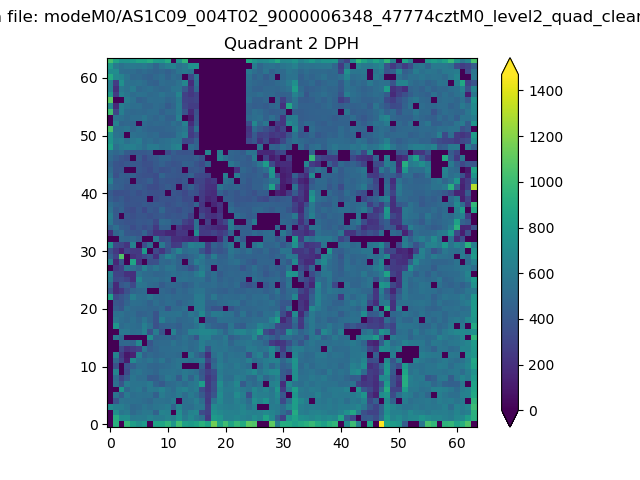
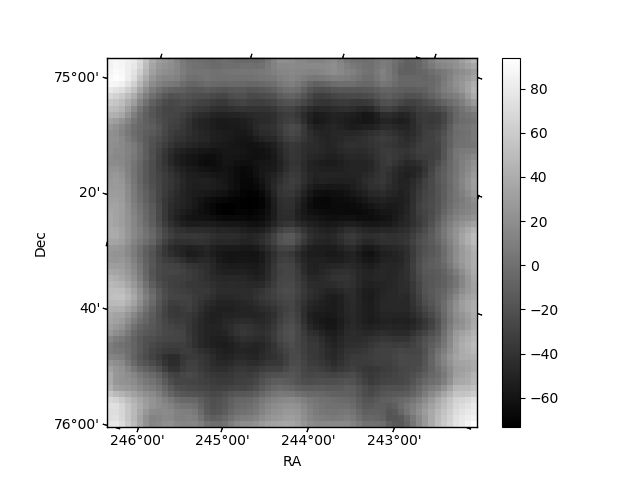
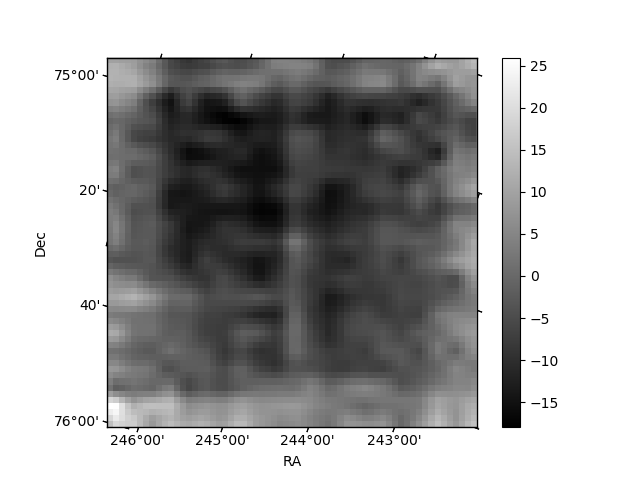
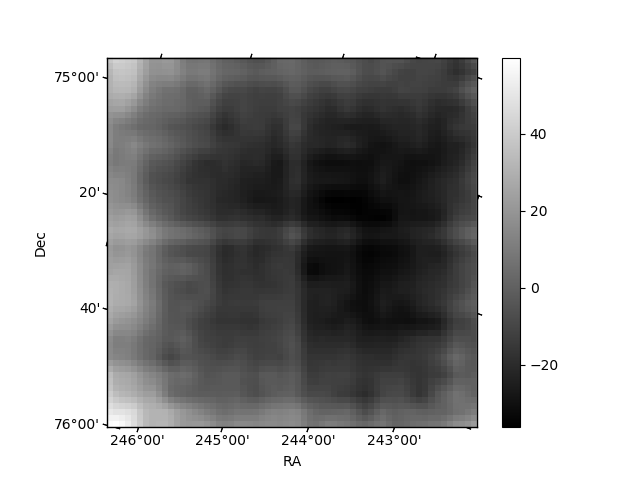
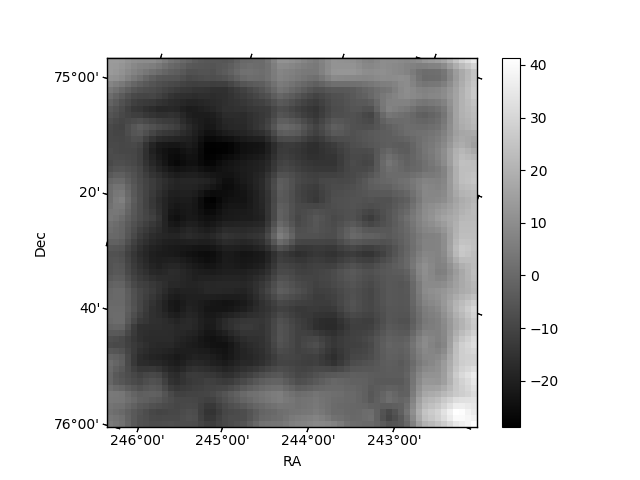
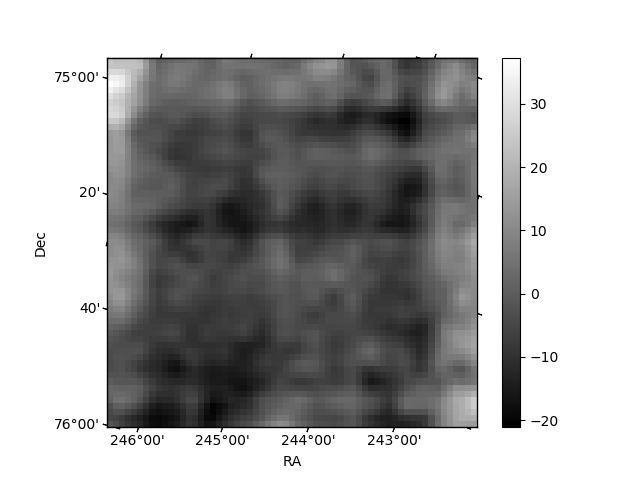
Histogram calculated using DETX and DETY for each event in the final _common_clean file
| Quadrant A | 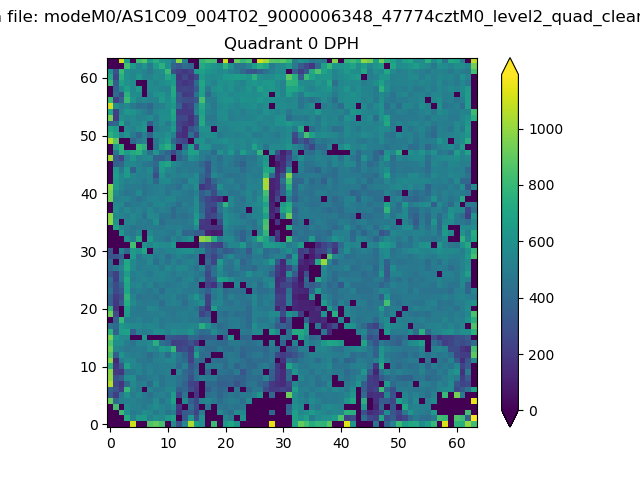 |
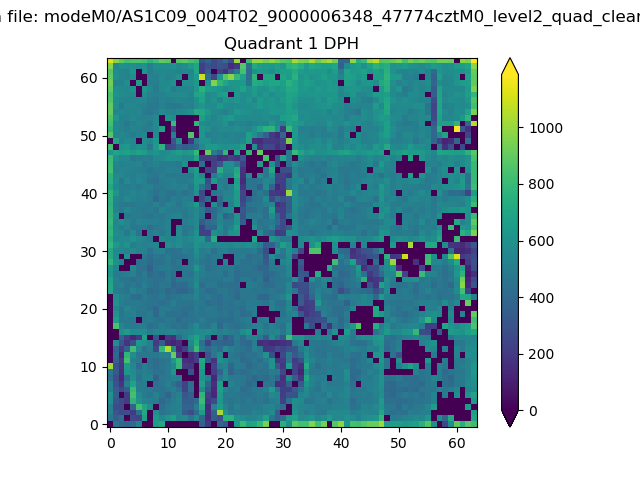 |
Quadrant B |
|---|---|---|---|
| Quadrant D | 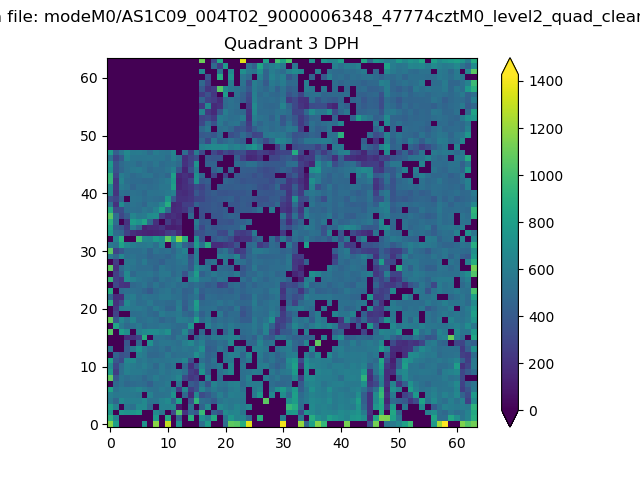 |
 |
Quadrant C |
| Plot type | Count rate plots | Images |
|---|---|---|
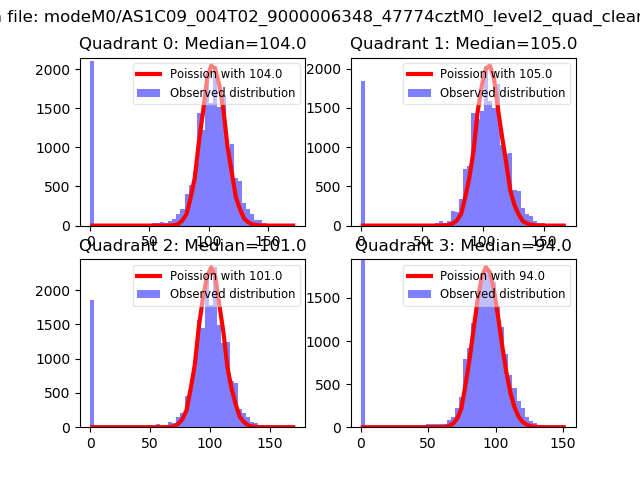
| Comparison with Poisson distribution Blue bars denote a histogram of data divided into 1 sec bins. Red curve is a Poisson curve with rate = median count rate of data. |
 |
 |
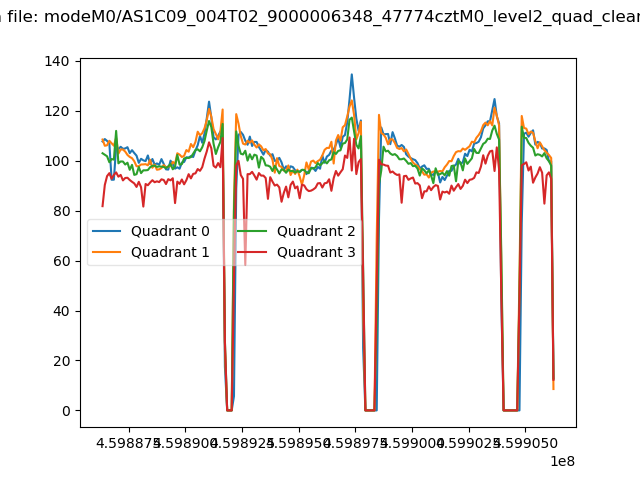
| Quadrant-wise count rates Data is divided into 100 sec bins |
 |
|
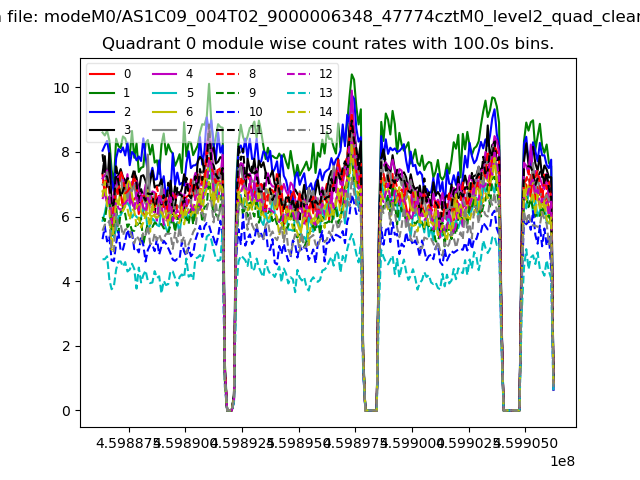
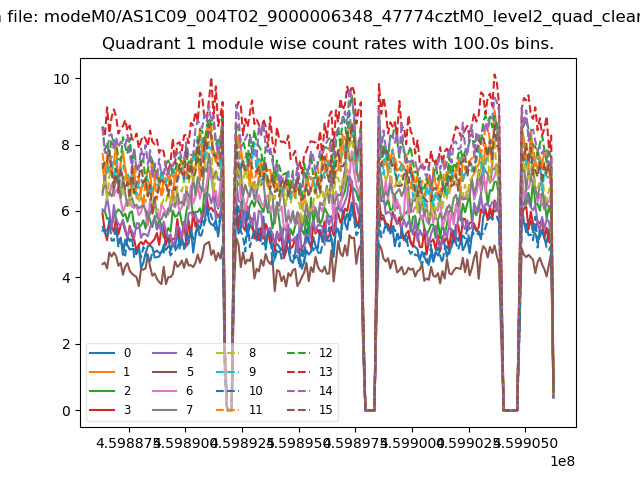
| Module-wise count rates for Quadrant A Data is divided into 100 sec bins |
 |
 |
| Module-wise count rates for Quadrant B Data is divided into 100 sec bins |
 |
 |
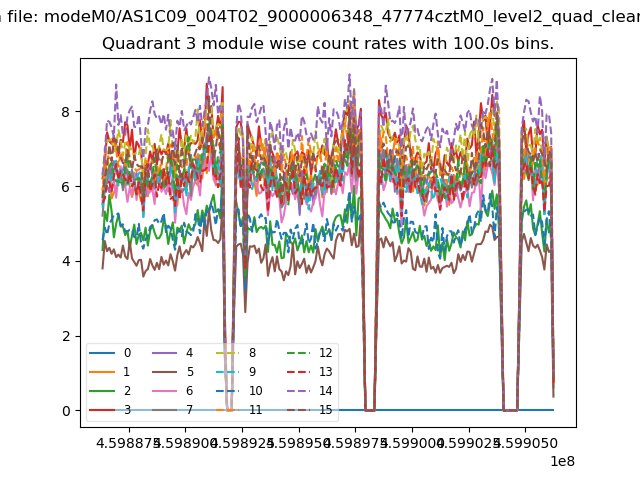
| Module-wise count rates for Quadrant C Data is divided into 100 sec bins |
 |
 |
| Module-wise count rates for Quadrant D Data is divided into 100 sec bins |
 |
 |
| Parameter | Plot |
|---|---|
| CZT HV Monitor |  |
| D_VDD | 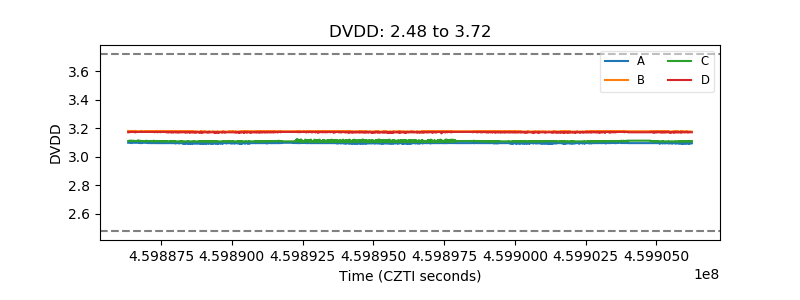 |
| Temperature 1 | 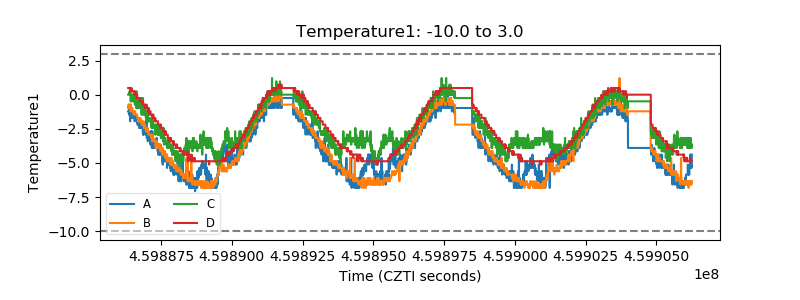 |
| Veto HV Monitor | 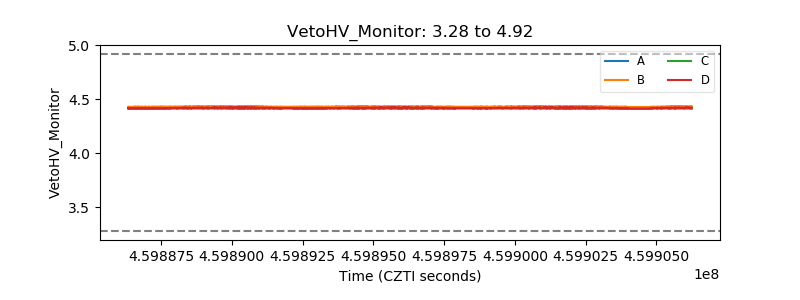 |
| Veto LLD | 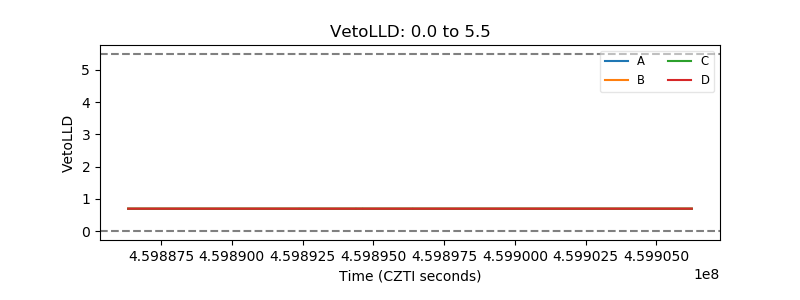 |
| Alpha Counter | 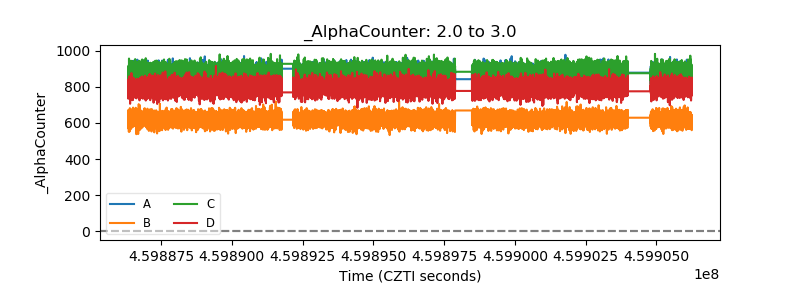 |
| _CPM_Rate | 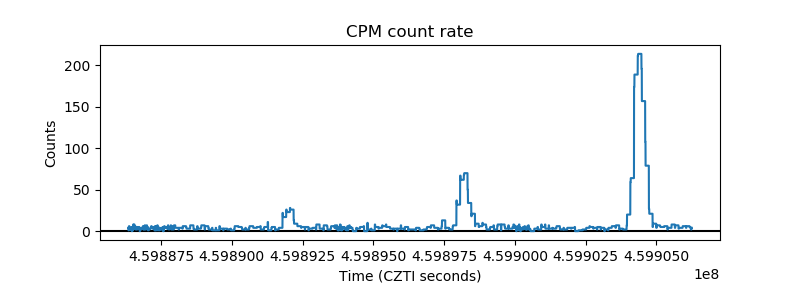 |
| CZT Counter | 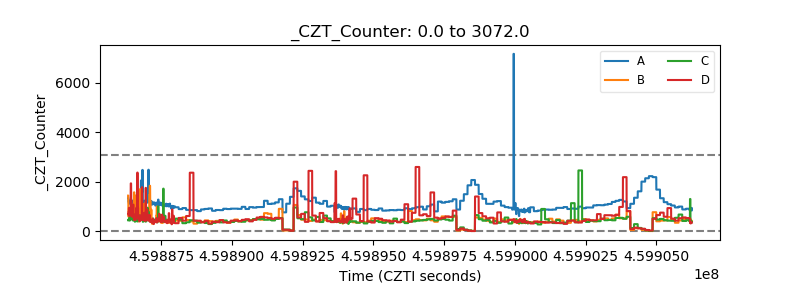 |
| +2.5 Volts monitor | 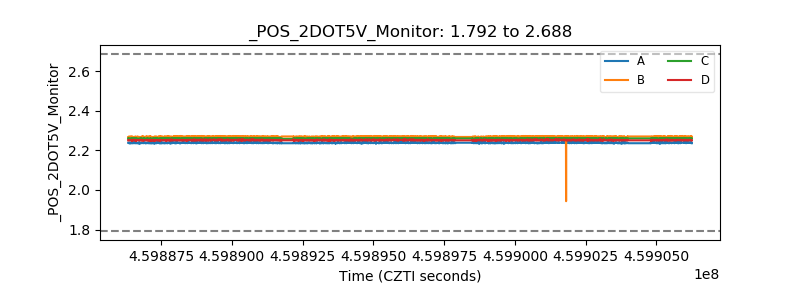 |
| +5 Volts monitor |  |
| _ROLL_ROT | 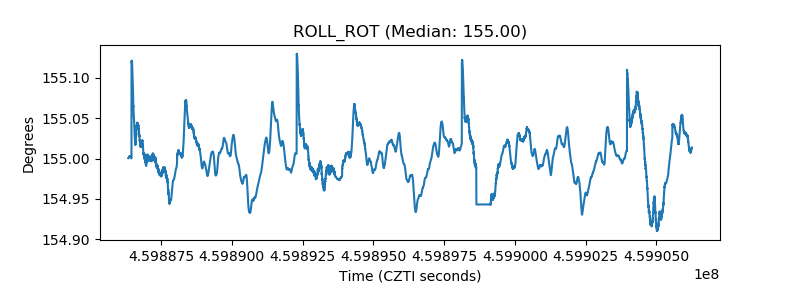 |
| _Roll_DEC | 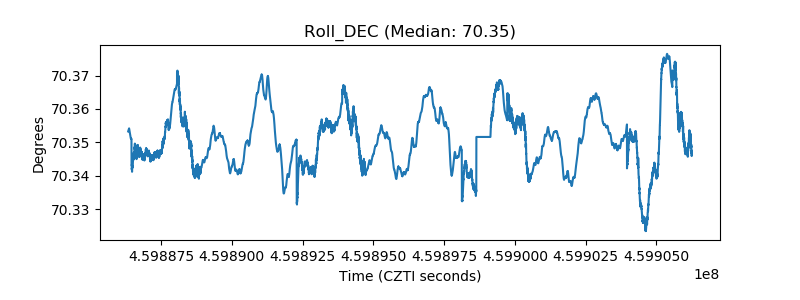 |
| _Roll_RA | 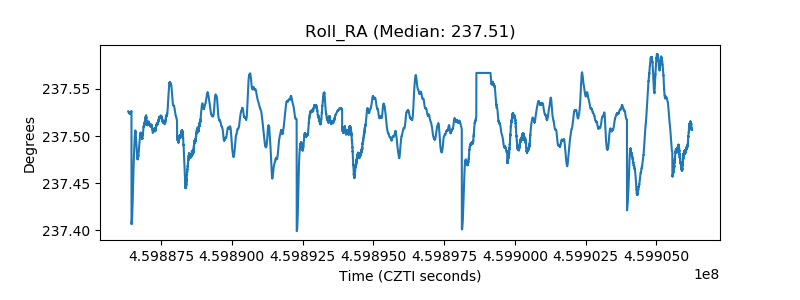 |
| Veto Counter | 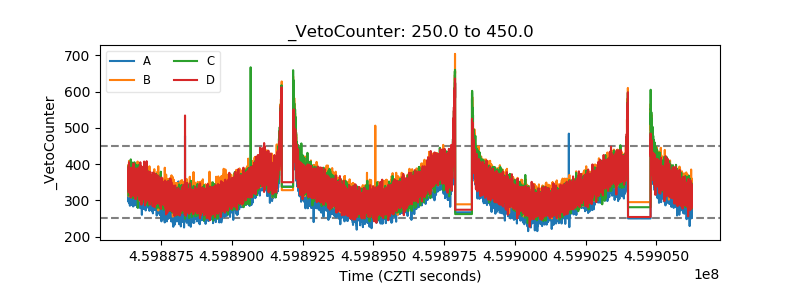 |