| Param | Original file | Final file |
|---|---|---|
| Filename | modeM0/AS1A13_073T04_9000006358cztM0_level2.fits | modeM0/AS1A13_073T04_9000006358cztM0_level2_quad_clean.evt |
| Size (bytes) | 229,826,880 | 214,845,120 |
| Size | 219.2 MB | 204.9 MB |
| Events in quadrant A | 1,355,654 | 1,213,191 |
| Events in quadrant B | 1,345,928 | 1,275,255 |
| Events in quadrant C | 1,368,274 | 1,204,003 |
| Events in quadrant D | 1,115,064 | 1,039,210 |
| Mode M0 | |||
|---|---|---|---|
| Quadrant | BADHDUFLAG | Total packets | Discarded packets |
| A | 0 | 92486 | 0 |
| B | 0 | 53343 | 0 |
| C | 0 | 53278 | 0 |
| D | 0 | 80903 | 0 |
| Mode M9 | |||
|---|---|---|---|
| Quadrant | BADHDUFLAG | Total packets | Discarded packets |
| A | 0 | 57 | 0 |
| B | 0 | 57 | 0 |
| C | 0 | 57 | 0 |
| D | 0 | 57 | 0 |
| Mode SS | |||
|---|---|---|---|
| Quadrant | BADHDUFLAG | Total packets | Discarded packets |
| A | 0 | 526 | 0 |
| B | 0 | 526 | 0 |
| C | 0 | 526 | 0 |
| D | 0 | 526 | 0 |
| Quadrant | Total seconds | Saturated seconds | Saturation percentage |
|---|---|---|---|
| A | 25791 | 734 | 2.845954% |
| B | 25791 | 257 | 0.996472% |
| C | 25791 | 118 | 0.457524% |
| D | 25790 | 2787 | 10.806514% |
Noise dominated data is calculated using 1-second bins in cleaned event files. If a bin has >2000 counts, and if more than 50% of those come from <1% of pixels, then it is considered to be noise-dominated and hence unusable.
| Quadrant | # 1 sec bins | Bins with >0 counts | Bins with >2000 counts | High rate bins dominated by noise | Noise dominated (total time) | Noise dominated (detector-on time) | Marked lightcurve |
|---|---|---|---|---|---|---|---|
| A | 31440 | 25786 | 0 | 0 | 0.00% | 0.00% | 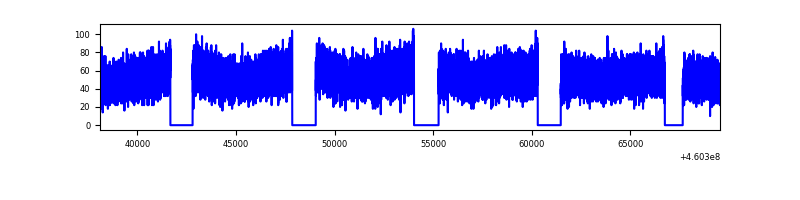 |
| B | 31440 | 25786 | 0 | 0 | 0.00% | 0.00% | 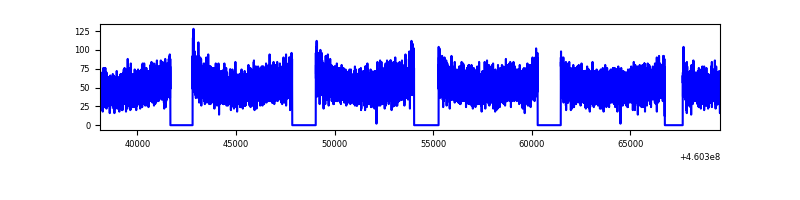 |
| C | 31440 | 25788 | 0 | 0 | 0.00% | 0.00% | 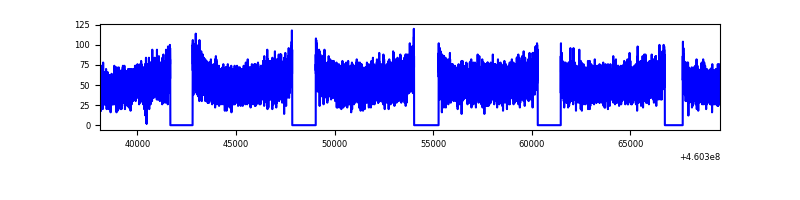 |
| D | 31439 | 25775 | 0 | 0 | 0.00% | 0.00% | 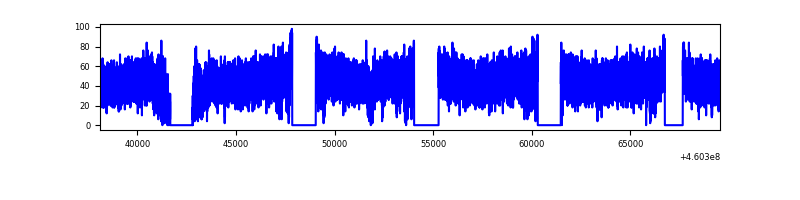 |
Top three noisy pixels from each quadrant. If the there are fewer than three noisy pixels in the level2.evt file, extra rows are filled as -1
| Pixel properties | Quadrant properties | ||||||
|---|---|---|---|---|---|---|---|
| Quadrant | DetID | PixID | Counts | Sigma | Mean | Median | Sigma |
| A | 7 | 110 | 1087 | 8.12 | 353 | 331 | 93.1 |
| A | 0 | 29 | 1056 | 7.79 | 353 | 331 | 93.1 |
| A | 7 | 109 | 1043 | 7.65 | 353 | 331 | 93.1 |
| B | 2 | 9 | 1221 | 12.01 | 356 | 340 | 73.4 |
| B | 2 | 8 | 989 | 8.85 | 356 | 340 | 73.4 |
| B | 3 | 17 | 950 | 8.32 | 356 | 340 | 73.4 |
| C | 3 | 202 | 1085 | 7.85 | 361 | 336 | 95.4 |
| C | 3 | 203 | 1076 | 7.76 | 361 | 336 | 95.4 |
| C | 1 | 81 | 1041 | 7.39 | 361 | 336 | 95.4 |
| D | 7 | 3 | 856 | 6.31 | 319 | 290 | 89.7 |
| D | 10 | 189 | 821 | 5.92 | 319 | 290 | 89.7 |
| D | 6 | 38 | 819 | 5.9 | 319 | 290 | 89.7 |
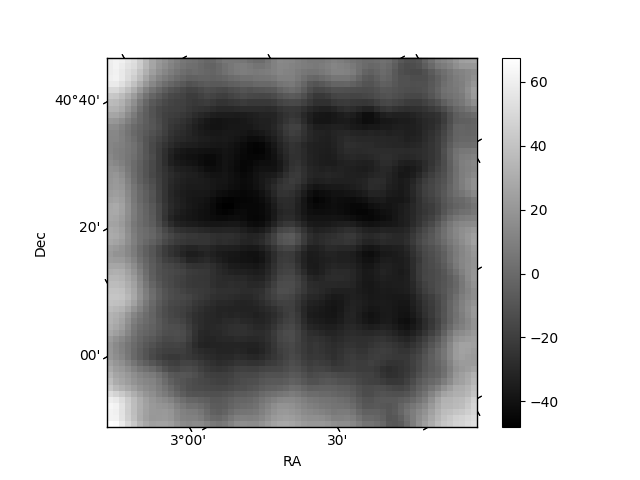
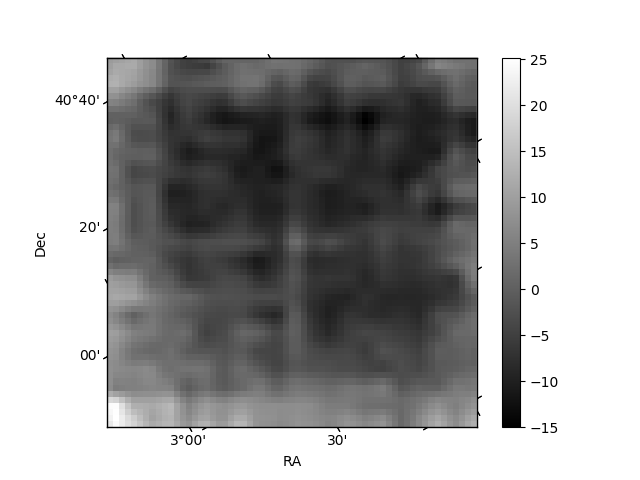
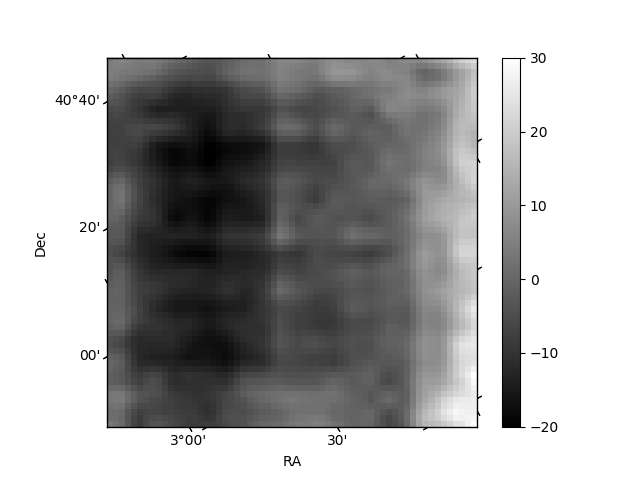
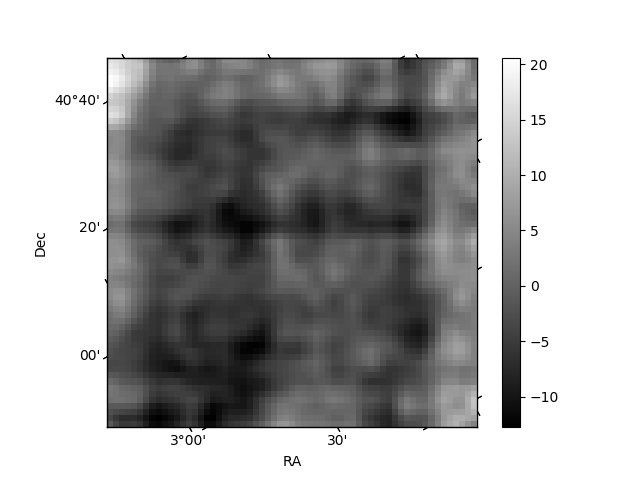
Histogram calculated using DETX and DETY for each event in the final _common_clean file
| Quadrant A | 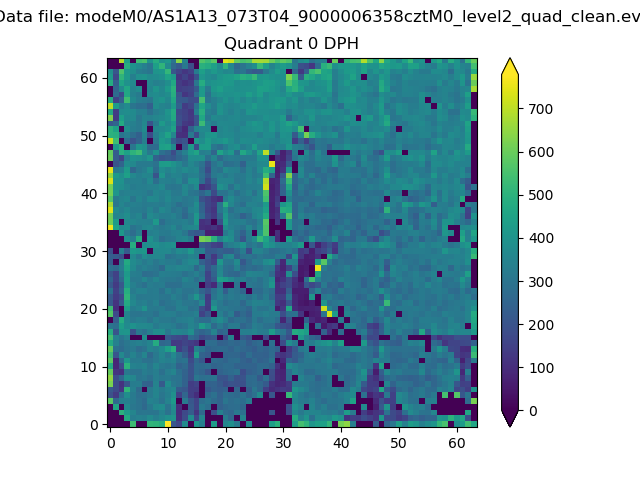 |
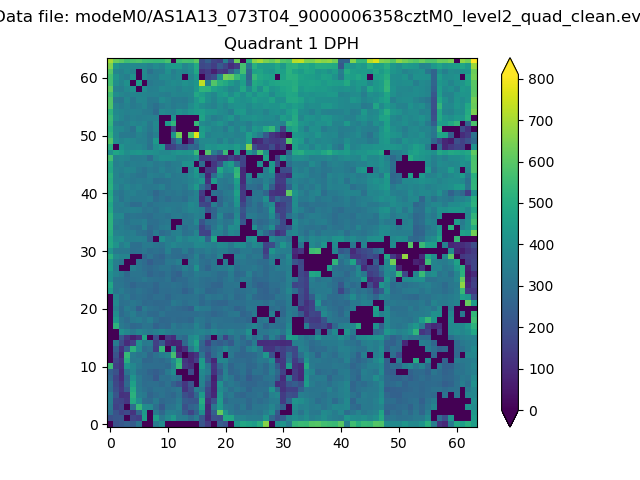 |
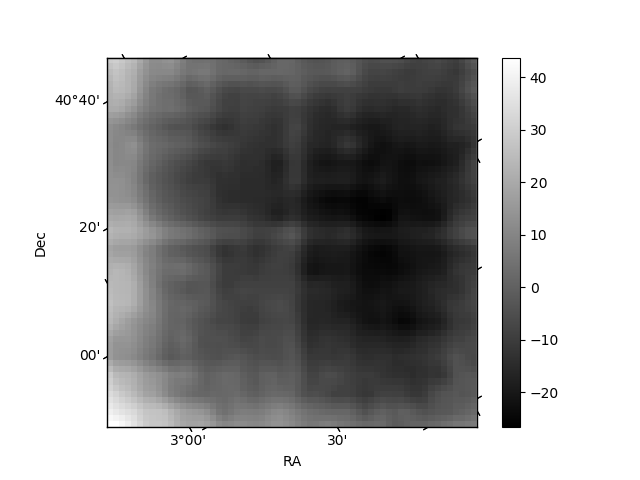
Quadrant B |
|---|---|---|---|
| Quadrant D | 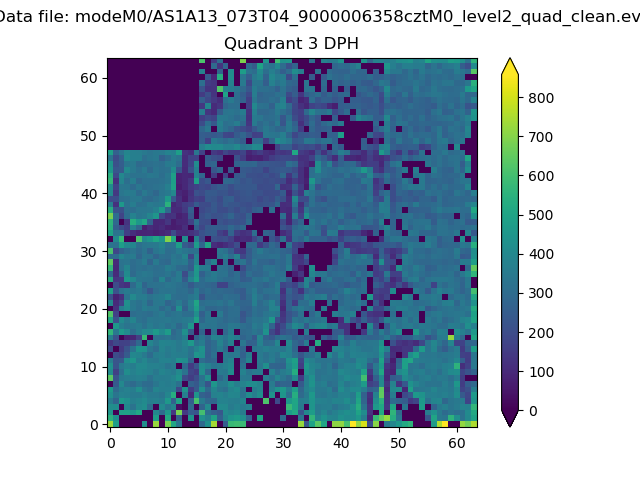 |
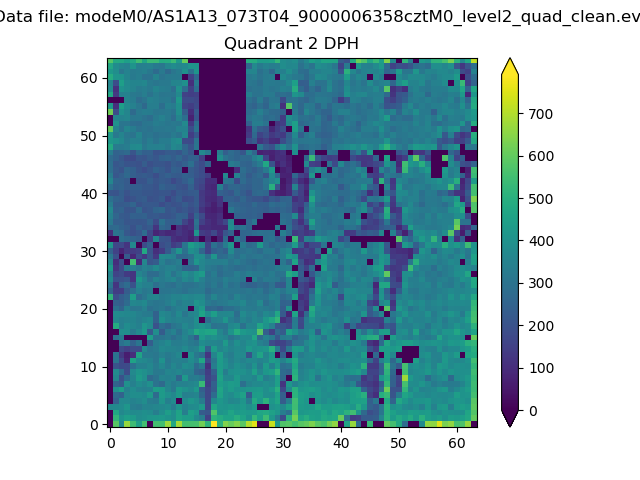 |
Quadrant C |
| Plot type | Count rate plots | Images |
|---|---|---|
| Comparison with Poisson distribution Blue bars denote a histogram of data divided into 1 sec bins. Red curve is a Poisson curve with rate = median count rate of data. |
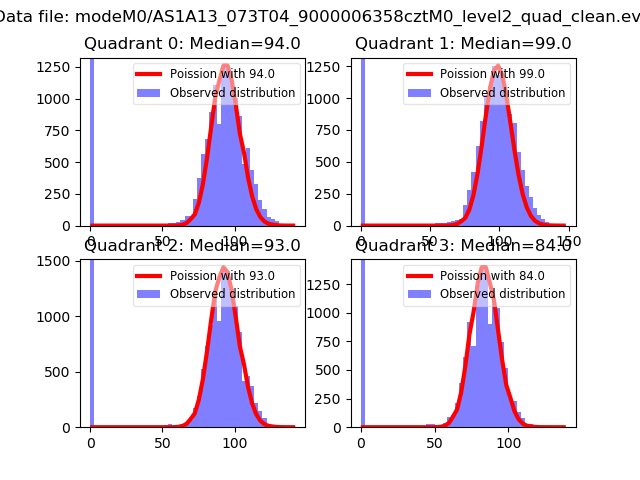 |
 |
| Quadrant-wise count rates Data is divided into 100 sec bins |
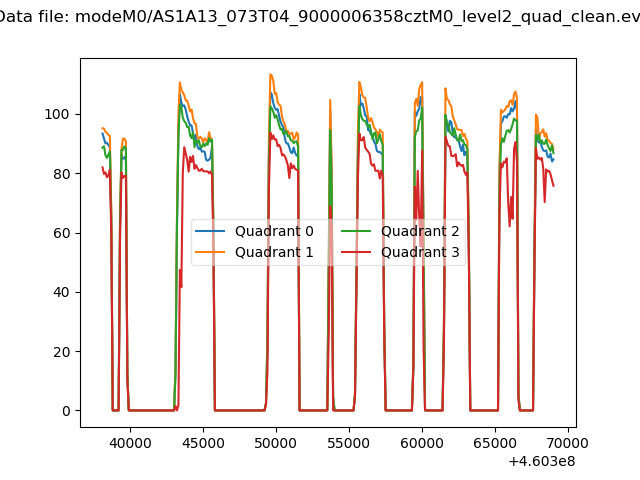 |
|
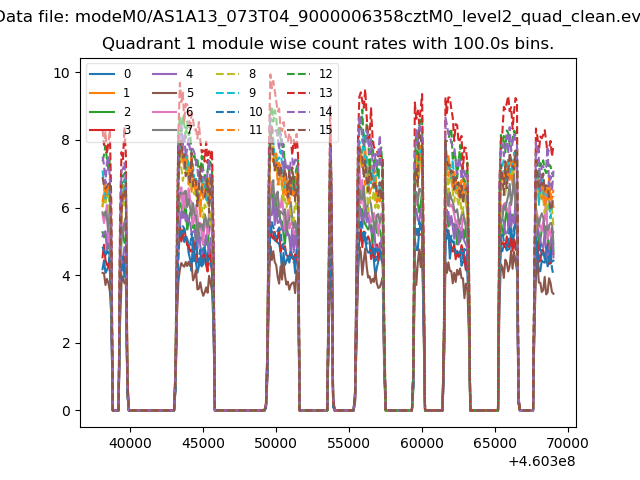
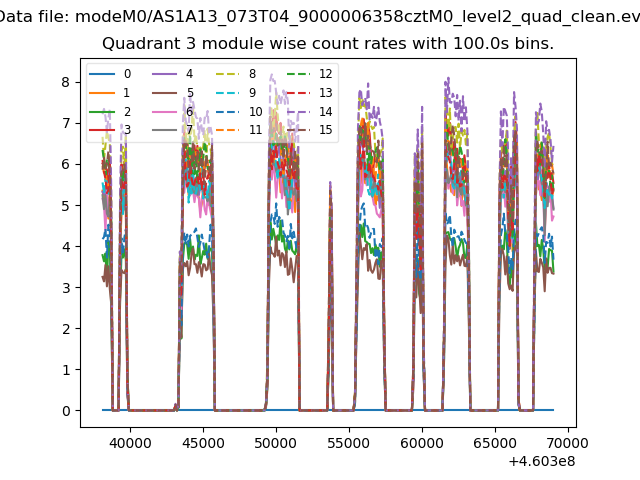
| Module-wise count rates for Quadrant A Data is divided into 100 sec bins |
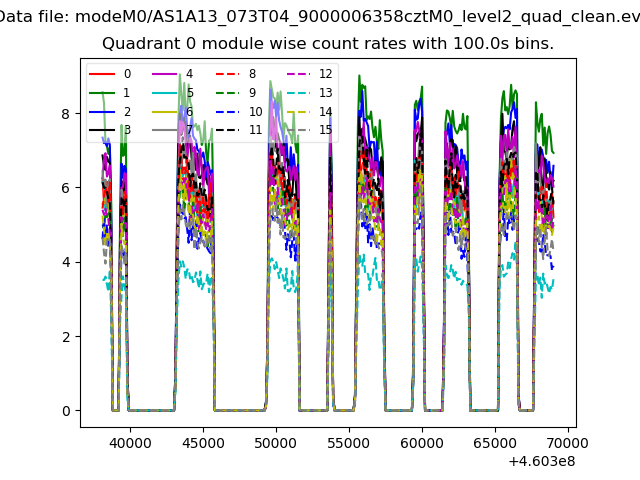 |
 |
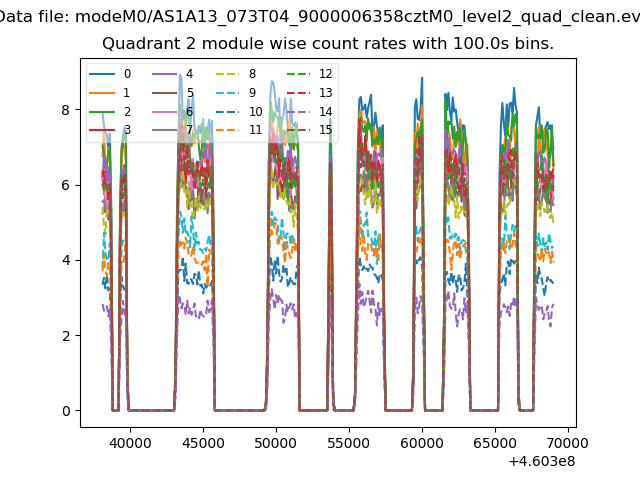
| Module-wise count rates for Quadrant B Data is divided into 100 sec bins |
 |
 |
| Module-wise count rates for Quadrant C Data is divided into 100 sec bins |
 |
 |
| Module-wise count rates for Quadrant D Data is divided into 100 sec bins |
 |
 |
| Parameter | Plot |
|---|---|
| CZT HV Monitor | 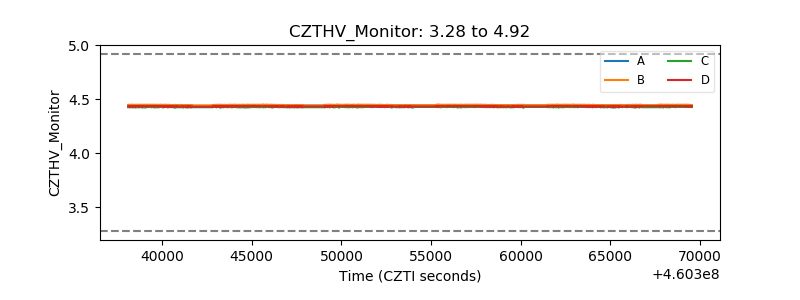 |
| D_VDD | 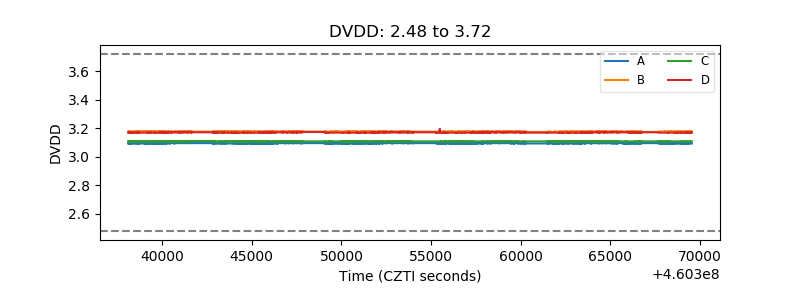 |
| Temperature 1 | 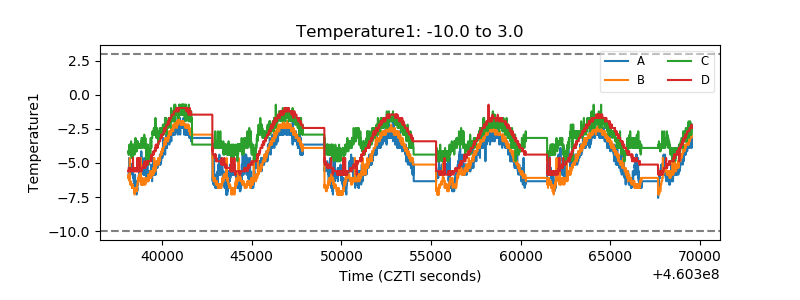 |
| Veto HV Monitor | 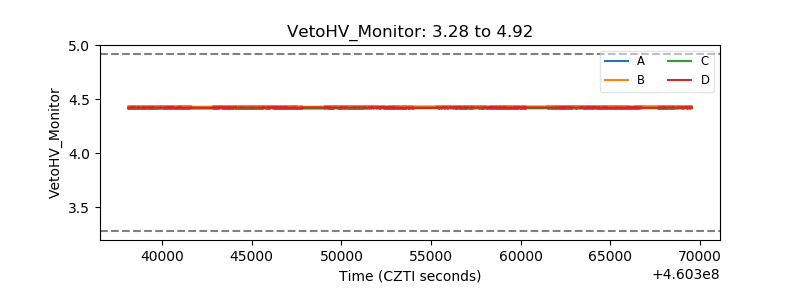 |
| Veto LLD | 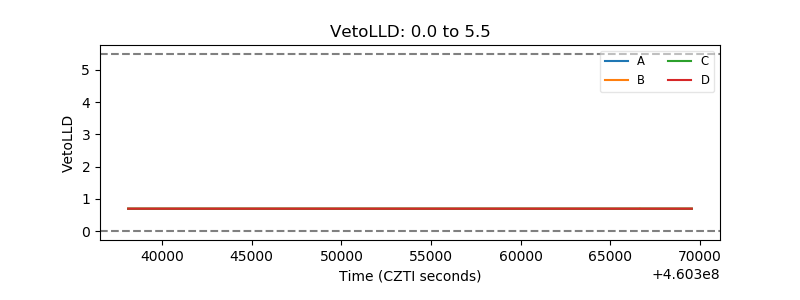 |
| Alpha Counter | 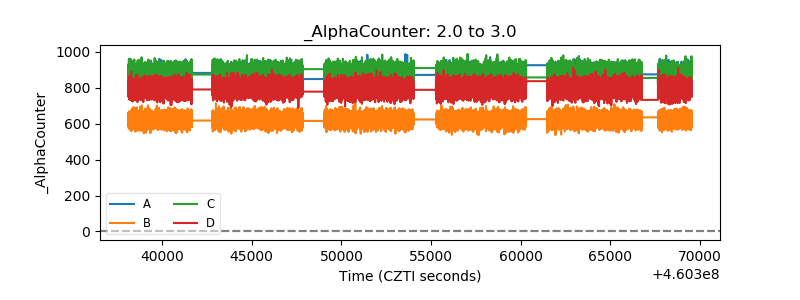 |
| _CPM_Rate | 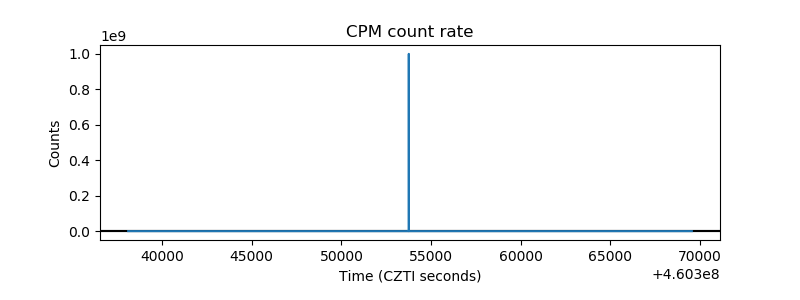 |
| CZT Counter | 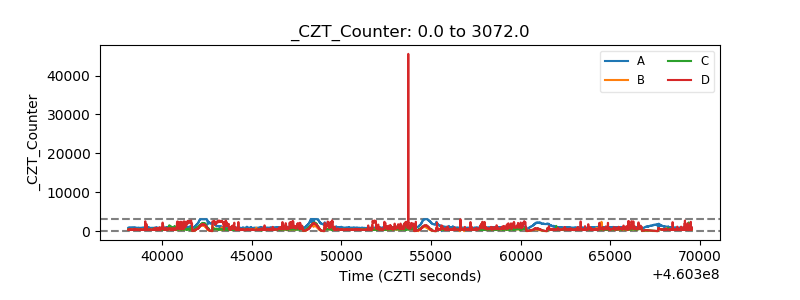 |
| +2.5 Volts monitor | 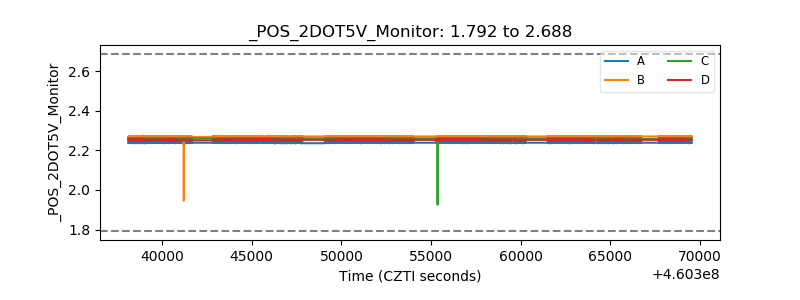 |
| +5 Volts monitor | 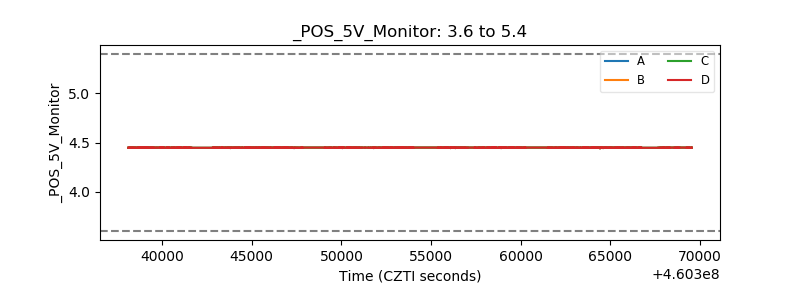 |
| _ROLL_ROT | 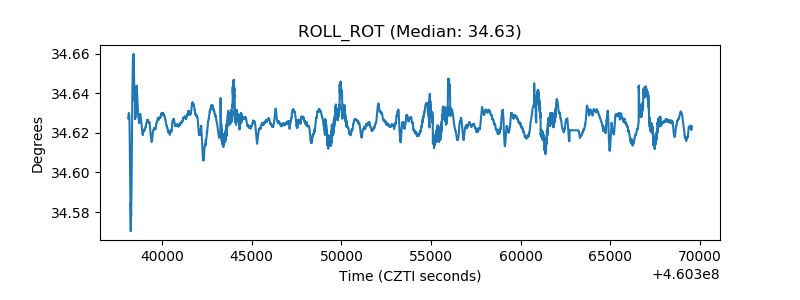 |
| _Roll_DEC | 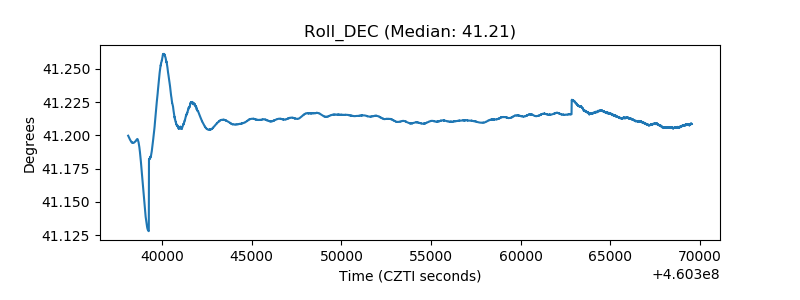 |
| _Roll_RA | 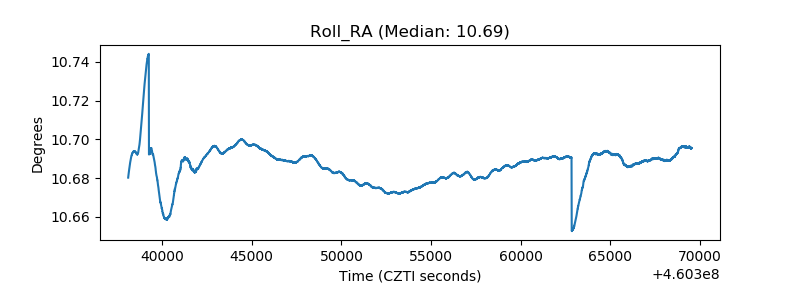 |
| Veto Counter | 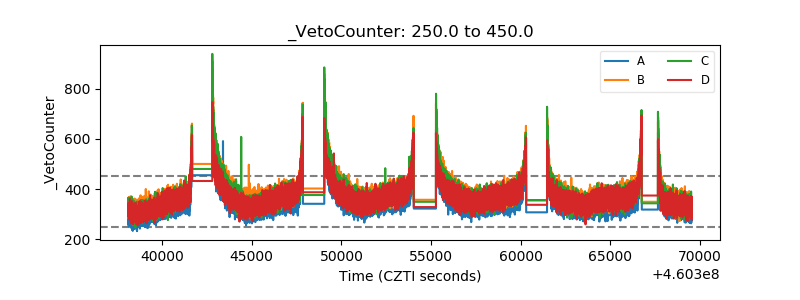 |