| Param | Original file | Final file |
|---|---|---|
| Filename | modeM0/AS1A13_071T07_9000006398_48085cztM0_level2.fits | modeM0/AS1A13_071T07_9000006398_48085cztM0_level2_quad_clean.evt |
| Size (bytes) | 412,591,680 | 81,757,440 |
| Size | 393.5 MB | 78.0 MB |
| Events in quadrant A | 6,943,935 | 686,644 |
| Events in quadrant B | 1,121,486 | 102 |
| Events in quadrant C | 2,756,317 | 705,841 |
| Events in quadrant D | 3,940,387 | 631,171 |
| Mode SS | |||
|---|---|---|---|
| Quadrant | BADHDUFLAG | Total packets | Discarded packets |
| A | 0 | 132 | 0 |
| B | 0 | 132 | 0 |
| C | 0 | 132 | 0 |
| D | 0 | 132 | 0 |
| Mode M0 | |||
|---|---|---|---|
| Quadrant | BADHDUFLAG | Total packets | Discarded packets |
| A | 0 | 25040 | 2 |
| B | 0 | 6949 | 2 |
| C | 0 | 13238 | 2 |
| D | 0 | 16512 | 2 |
| Mode M9 | |||
|---|---|---|---|
| Quadrant | BADHDUFLAG | Total packets | Discarded packets |
| A | 0 | 14 | 0 |
| B | 0 | 15 | 0 |
| C | 0 | 15 | 0 |
| D | 0 | 15 | 0 |
| Quadrant | Total seconds | Saturated seconds | Saturation percentage |
|---|---|---|---|
| A | 6472 | 347 | 5.361557% |
| B | 6472 | 6471 | 99.984549% |
| C | 6472 | 12 | 0.185414% |
| D | 6472 | 160 | 2.472188% |
Noise dominated data is calculated using 1-second bins in cleaned event files. If a bin has >2000 counts, and if more than 50% of those come from <1% of pixels, then it is considered to be noise-dominated and hence unusable.
| Quadrant | # 1 sec bins | Bins with >0 counts | Bins with >2000 counts | High rate bins dominated by noise | Noise dominated (total time) | Noise dominated (detector-on time) | Marked lightcurve |
|---|---|---|---|---|---|---|---|
| A | 7617 | 6473 | 165 | 165 | 2.17% | 2.55% | 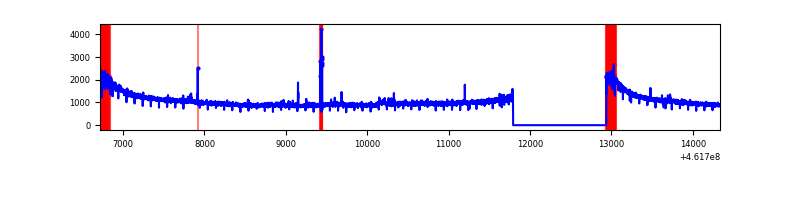 |
| B | 7616 | 6471 | 0 | 0 | 0.00% | 0.00% | 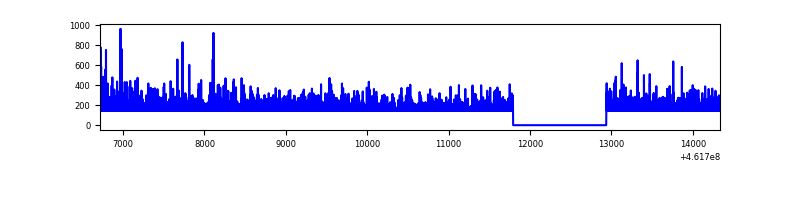 |
| C | 7617 | 6473 | 3 | 3 | 0.04% | 0.05% | 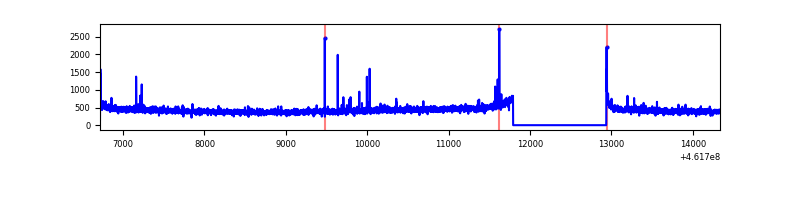 |
| D | 7617 | 6473 | 153 | 153 | 2.01% | 2.36% | 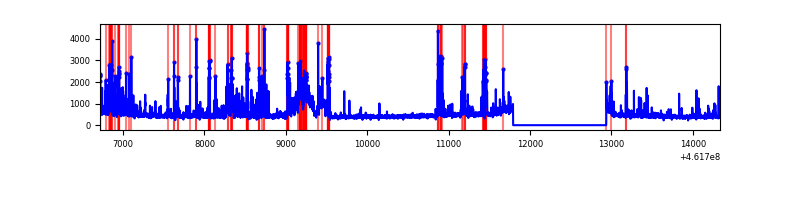 |
Top three noisy pixels from each quadrant. If the there are fewer than three noisy pixels in the level2.evt file, extra rows are filled as -1
| Pixel properties | Quadrant properties | ||||||
|---|---|---|---|---|---|---|---|
| Quadrant | DetID | PixID | Counts | Sigma | Mean | Median | Sigma |
| A | 10 | 83 | 4174251 | 28932.96 | 695 | 682 | 144.2 |
| A | 7 | 3 | 40377 | 275.18 | 695 | 682 | 144.2 |
| A | 14 | 248 | 22046 | 148.1 | 695 | 682 | 144.2 |
| B | 2 | 177 | 894155 | 80861.02 | 44 | 43 | 11.1 |
| B | 4 | 21 | 38928 | 3516.65 | 44 | 43 | 11.1 |
| B | 0 | 197 | 4328 | 387.52 | 44 | 43 | 11.1 |
| C | 14 | 254 | 28757 | 174.82 | 689 | 693 | 160.5 |
| C | 12 | 2 | 12396 | 72.9 | 689 | 693 | 160.5 |
| C | 12 | 250 | 11486 | 67.23 | 689 | 693 | 160.5 |
| D | 2 | 249 | 947475 | 5542.59 | 679 | 654 | 170.8 |
| D | 14 | 34 | 147516 | 859.72 | 679 | 654 | 170.8 |
| D | 11 | 224 | 100590 | 585.02 | 679 | 654 | 170.8 |
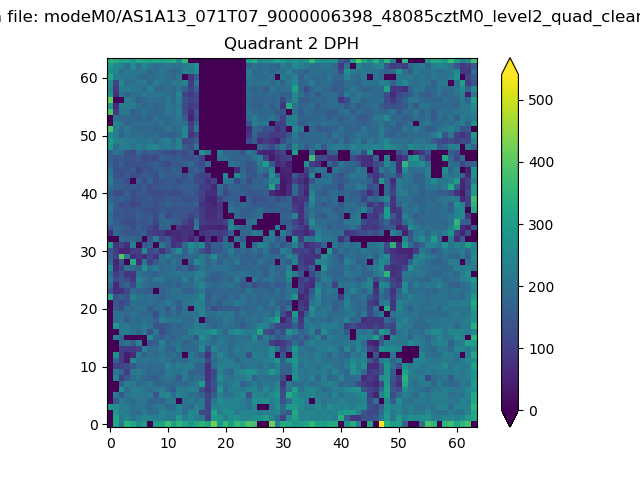
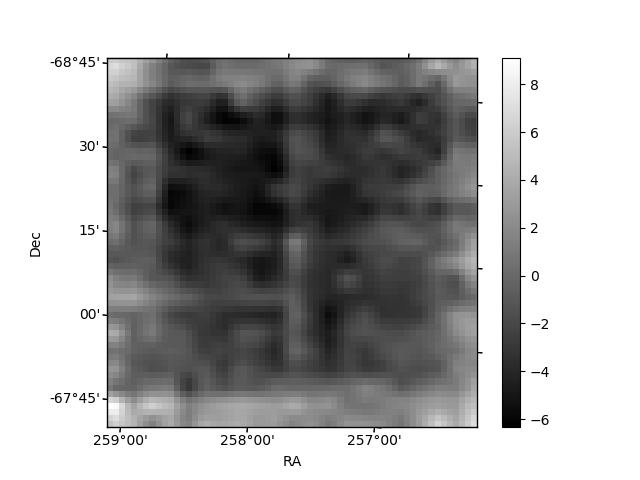
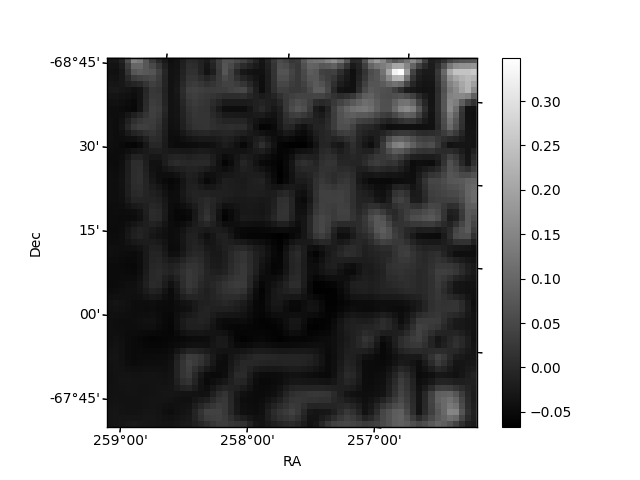
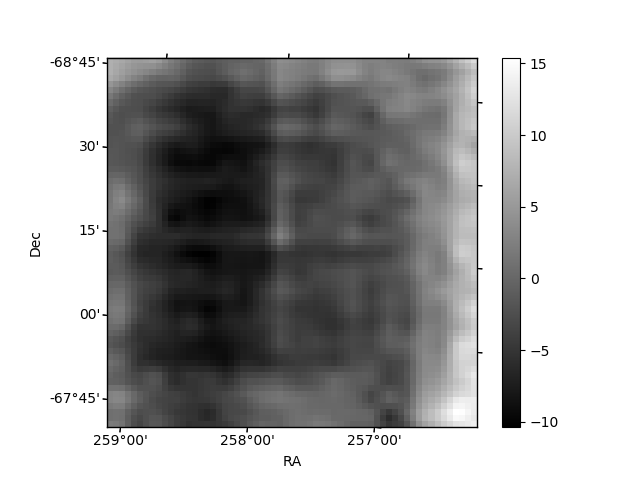
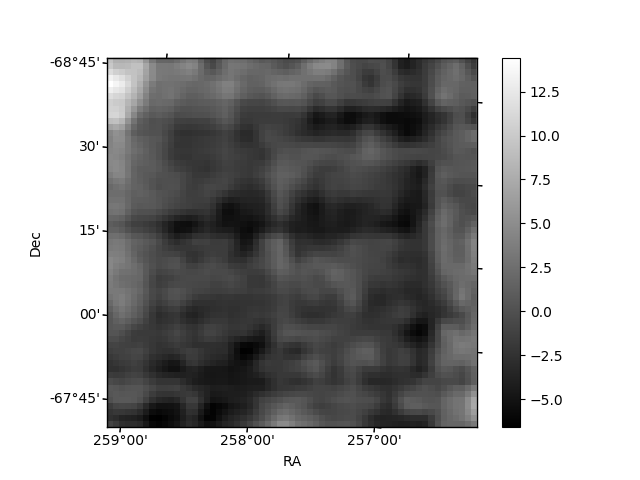
Histogram calculated using DETX and DETY for each event in the final _common_clean file
| Quadrant A | 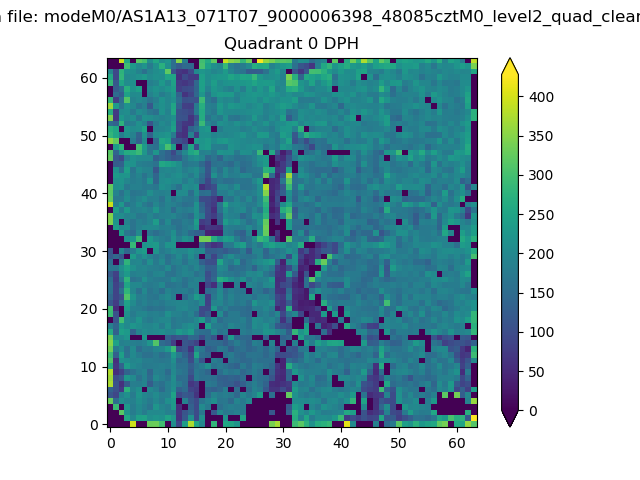 |
 |
Quadrant B |
|---|---|---|---|
| Quadrant D | 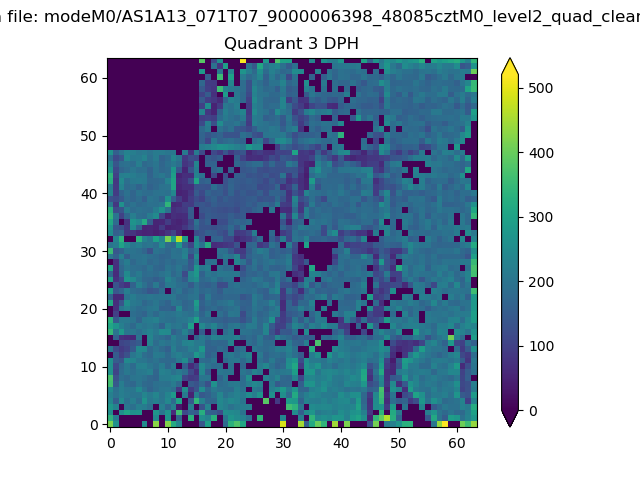 |
 |
Quadrant C |
| Plot type | Count rate plots | Images |
|---|---|---|
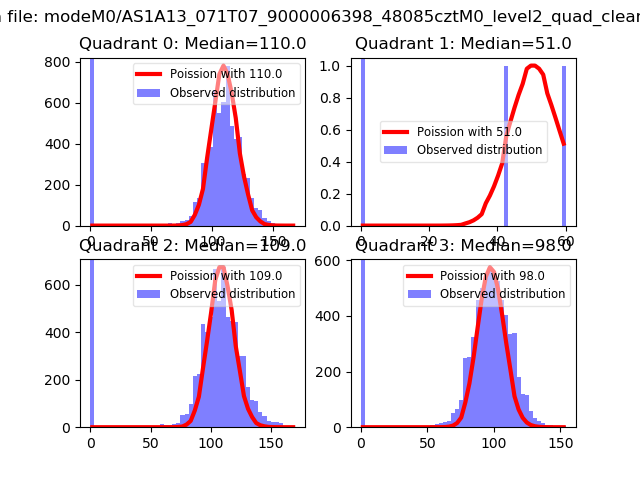
| Comparison with Poisson distribution Blue bars denote a histogram of data divided into 1 sec bins. Red curve is a Poisson curve with rate = median count rate of data. |
 |
 |
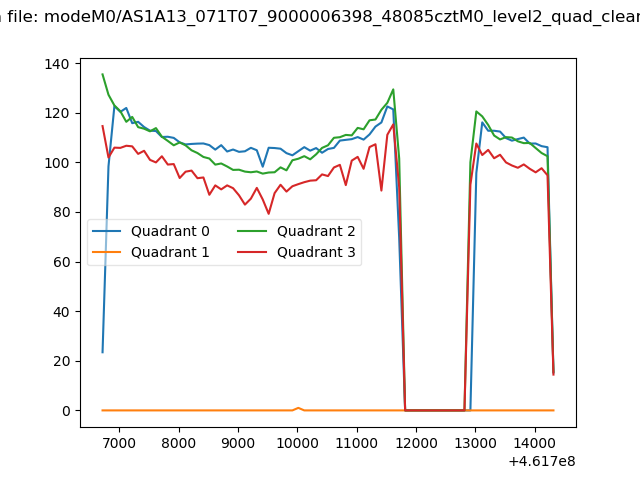
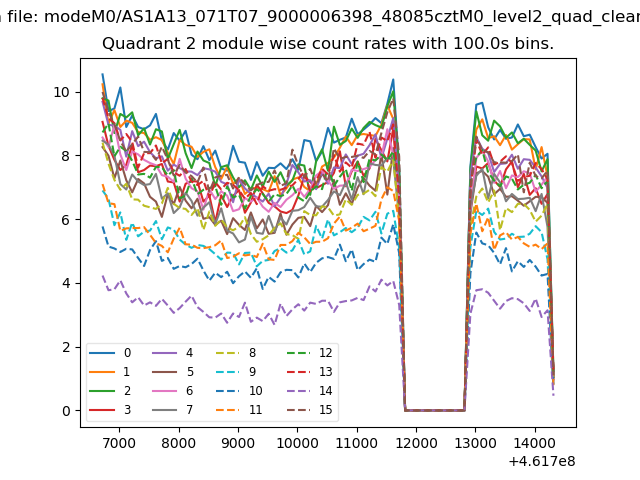
| Quadrant-wise count rates Data is divided into 100 sec bins |
 |
|
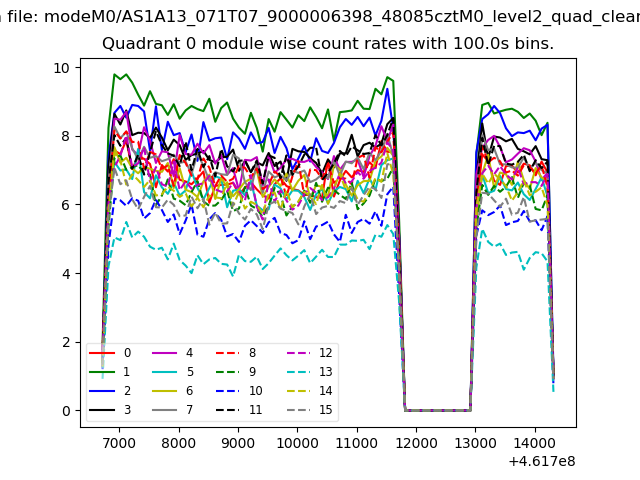
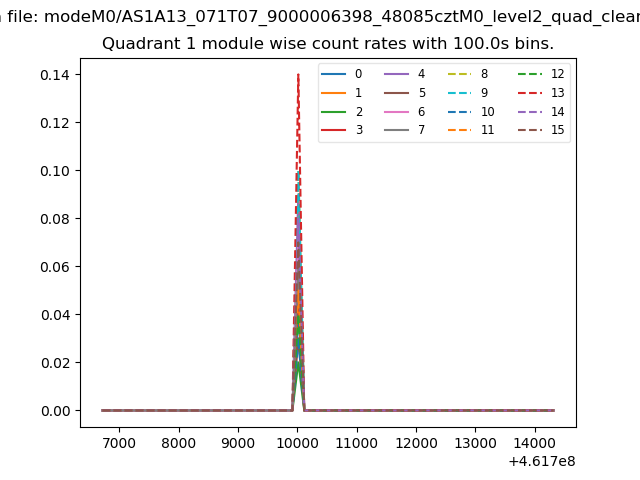
| Module-wise count rates for Quadrant A Data is divided into 100 sec bins |
 |
 |
| Module-wise count rates for Quadrant B Data is divided into 100 sec bins |
 |
 |
| Module-wise count rates for Quadrant C Data is divided into 100 sec bins |
 |
 |
| Module-wise count rates for Quadrant D Data is divided into 100 sec bins |
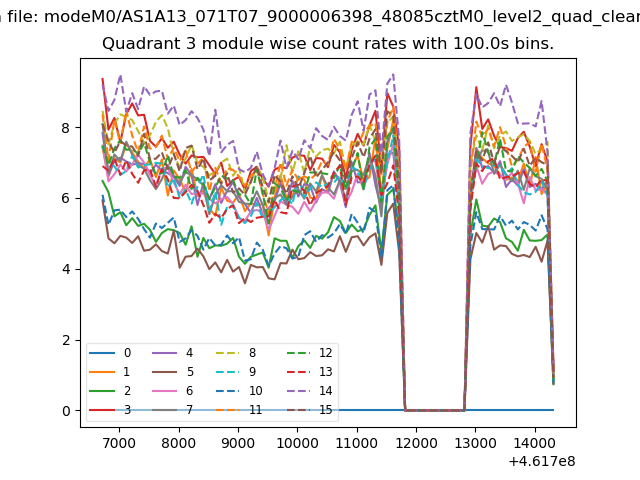 |
 |
| Parameter | Plot |
|---|---|
| CZT HV Monitor | 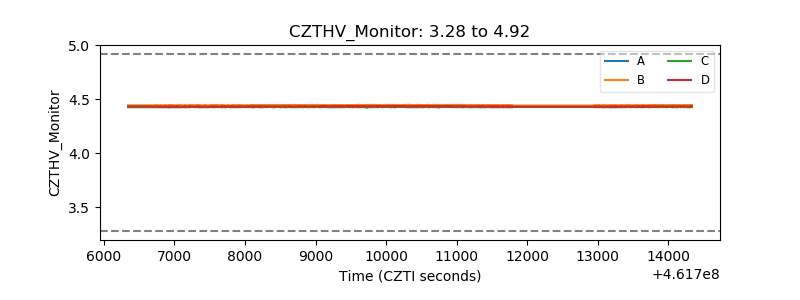 |
| D_VDD | 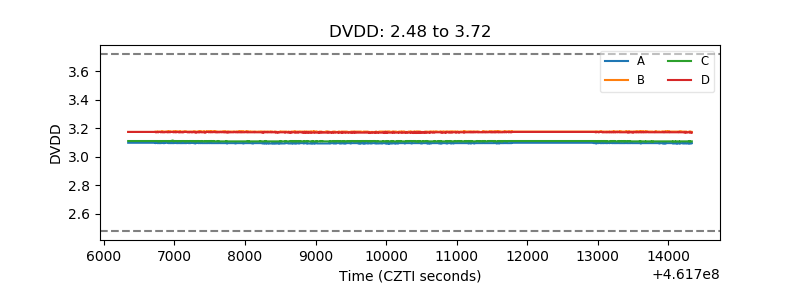 |
| Temperature 1 | 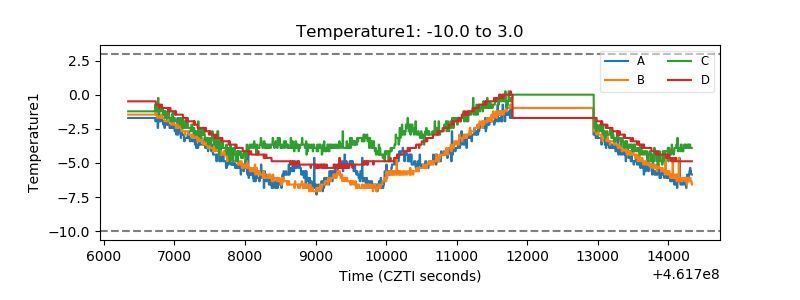 |
| Veto HV Monitor | 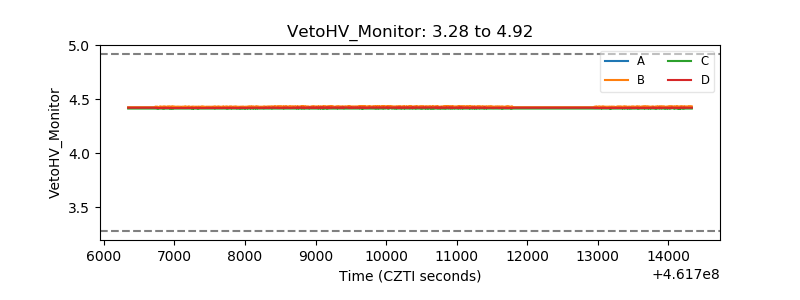 |
| Veto LLD | 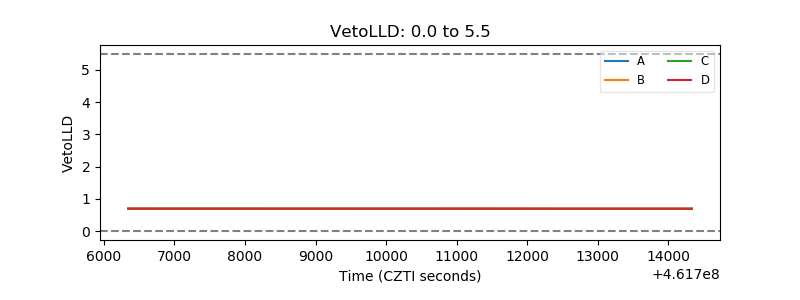 |
| Alpha Counter | 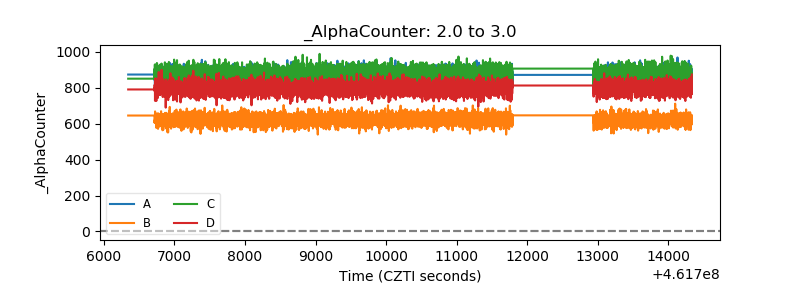 |
| _CPM_Rate | 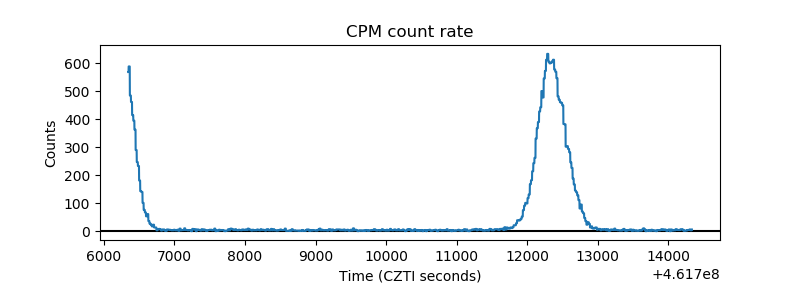 |
| CZT Counter | 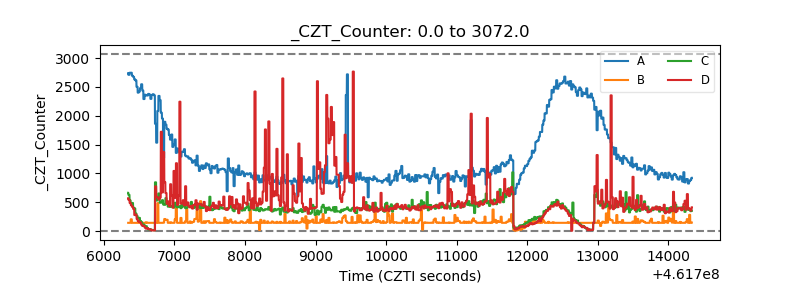 |
| +2.5 Volts monitor |  |
| +5 Volts monitor | 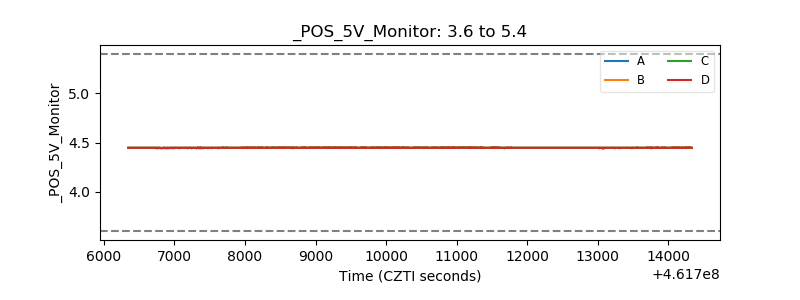 |
| _ROLL_ROT | 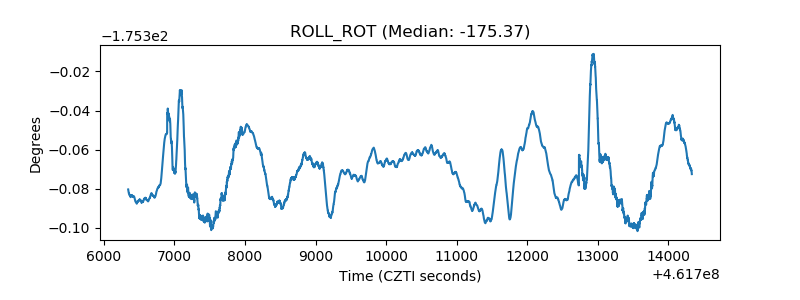 |
| _Roll_DEC | 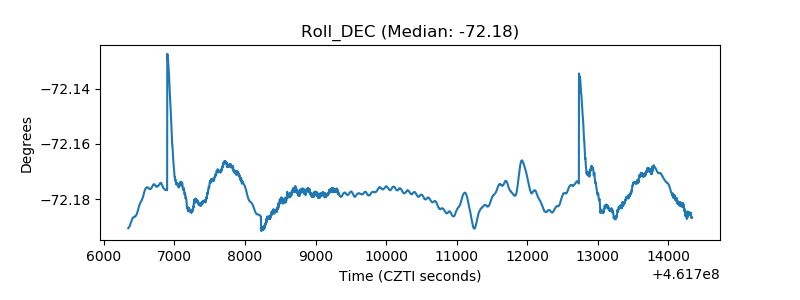 |
| _Roll_RA | 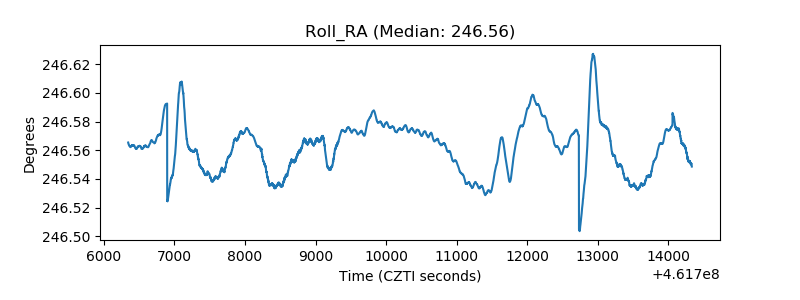 |
| Veto Counter | 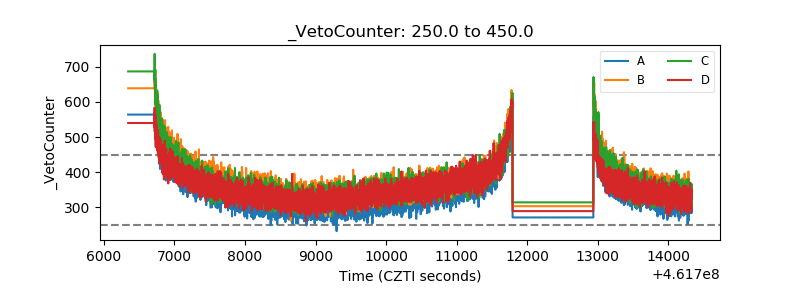 |