| Param | Original file | Final file |
|---|---|---|
| Filename | modeM0/AS1C09_009T01_9000006406_48156cztM0_level2.fits | modeM0/AS1C09_009T01_9000006406_48156cztM0_level2_quad_clean.evt |
| Size (bytes) | 428,443,200 | 90,550,080 |
| Size | 408.6 MB | 86.4 MB |
| Events in quadrant A | 7,353,207 | 785,315 |
| Events in quadrant B | 1,156,735 | 46,850 |
| Events in quadrant C | 3,195,248 | 765,988 |
| Events in quadrant D | 3,654,378 | 698,159 |
| Mode SS | |||
|---|---|---|---|
| Quadrant | BADHDUFLAG | Total packets | Discarded packets |
| A | 0 | 128 | 0 |
| B | 0 | 128 | 0 |
| C | 0 | 128 | 0 |
| D | 0 | 128 | 0 |
| Mode M0 | |||
|---|---|---|---|
| Quadrant | BADHDUFLAG | Total packets | Discarded packets |
| A | 0 | 26134 | 1 |
| B | 0 | 6979 | 1 |
| C | 0 | 13583 | 2 |
| D | 0 | 14974 | 1 |
| Mode M9 | |||
|---|---|---|---|
| Quadrant | BADHDUFLAG | Total packets | Discarded packets |
| A | 0 | 12 | 0 |
| B | 0 | 12 | 0 |
| C | 0 | 12 | 0 |
| D | 0 | 12 | 0 |
| Quadrant | Total seconds | Saturated seconds | Saturation percentage |
|---|---|---|---|
| A | 6344 | 306 | 4.823455% |
| B | 6344 | 6344 | 100.000000% |
| C | 6343 | 98 | 1.545010% |
| D | 6344 | 143 | 2.254098% |
Noise dominated data is calculated using 1-second bins in cleaned event files. If a bin has >2000 counts, and if more than 50% of those come from <1% of pixels, then it is considered to be noise-dominated and hence unusable.
| Quadrant | # 1 sec bins | Bins with >0 counts | Bins with >2000 counts | High rate bins dominated by noise | Noise dominated (total time) | Noise dominated (detector-on time) | Marked lightcurve |
|---|---|---|---|---|---|---|---|
| A | 7514 | 6345 | 53 | 53 | 0.71% | 0.84% | 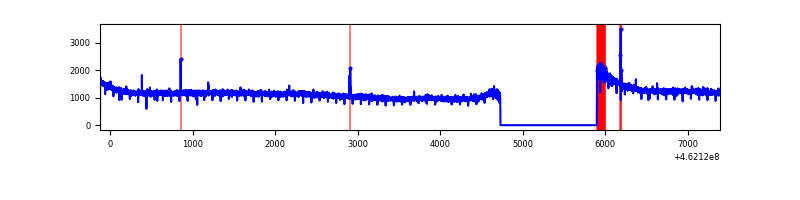 |
| B | 7513 | 6324 | 6 | 6 | 0.08% | 0.09% | 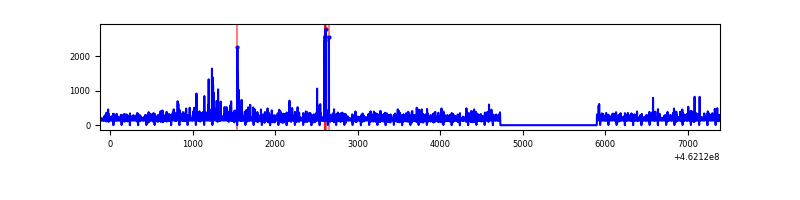 |
| C | 7513 | 6344 | 28 | 28 | 0.37% | 0.44% | 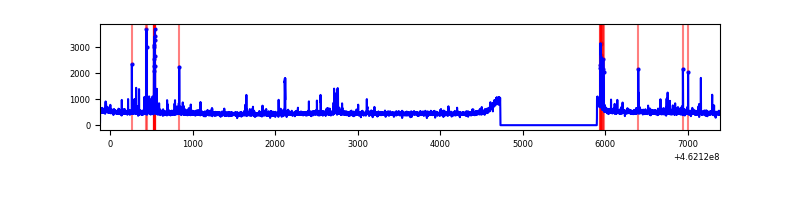 |
| D | 7514 | 6345 | 69 | 69 | 0.92% | 1.09% | 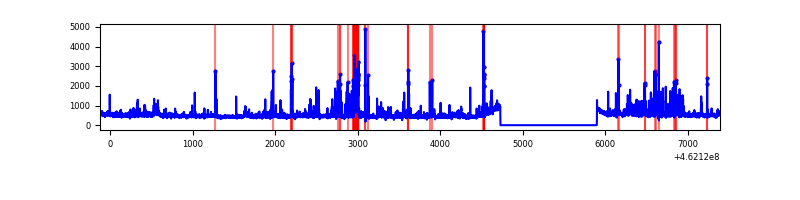 |
Top three noisy pixels from each quadrant. If the there are fewer than three noisy pixels in the level2.evt file, extra rows are filled as -1
| Pixel properties | Quadrant properties | ||||||
|---|---|---|---|---|---|---|---|
| Quadrant | DetID | PixID | Counts | Sigma | Mean | Median | Sigma |
| A | 10 | 83 | 4323009 | 27107.87 | 771 | 757 | 159.4 |
| A | 13 | 248 | 18074 | 108.61 | 771 | 757 | 159.4 |
| A | 0 | 243 | 17333 | 103.96 | 771 | 757 | 159.4 |
| B | 2 | 177 | 872281 | 75818.66 | 48 | 47 | 11.5 |
| B | 5 | 32 | 44029 | 3823.12 | 48 | 47 | 11.5 |
| B | 0 | 200 | 10771 | 932.18 | 48 | 47 | 11.5 |
| C | 14 | 254 | 125520 | 695.85 | 761 | 768 | 179.3 |
| C | 12 | 2 | 64614 | 356.12 | 761 | 768 | 179.3 |
| C | 1 | 3 | 13192 | 69.3 | 761 | 768 | 179.3 |
| D | 7 | 67 | 319260 | 1651.45 | 761 | 737 | 192.9 |
| D | 12 | 2 | 68390 | 350.76 | 761 | 737 | 192.9 |
| D | 12 | 233 | 56826 | 290.8 | 761 | 737 | 192.9 |
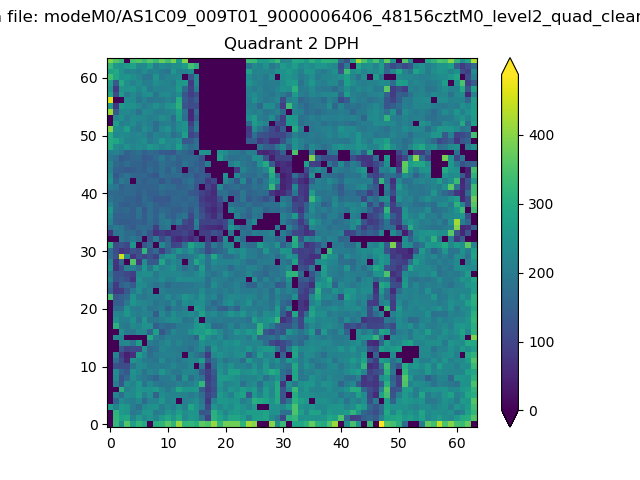
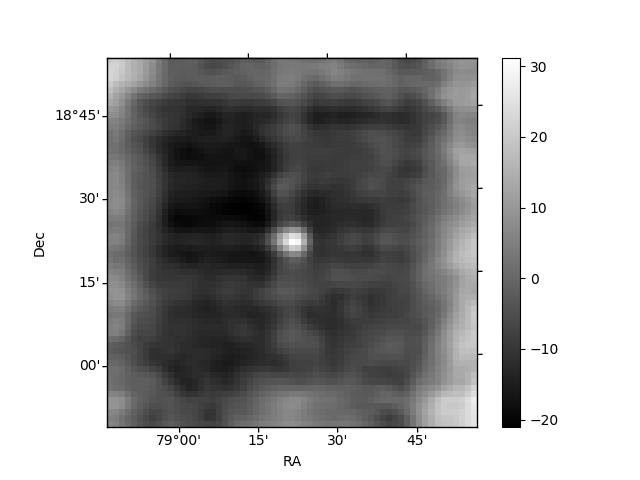
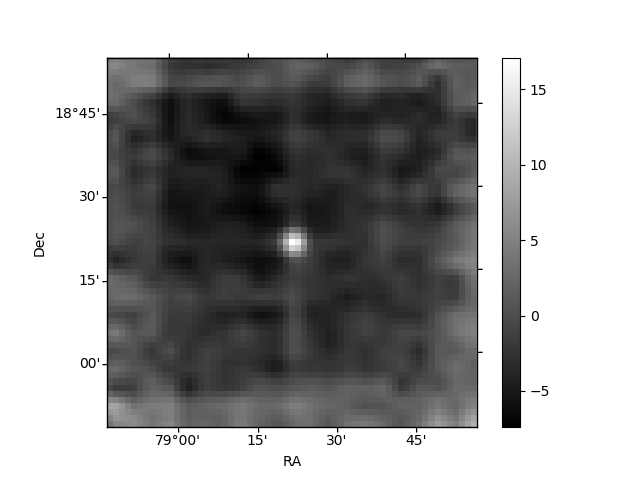
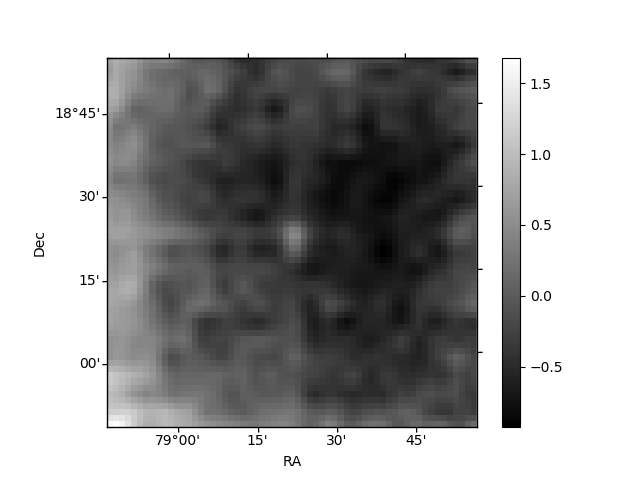
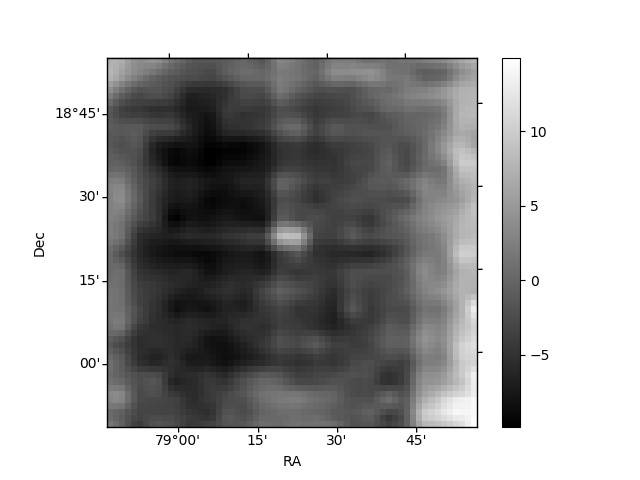
Histogram calculated using DETX and DETY for each event in the final _common_clean file
| Quadrant A | 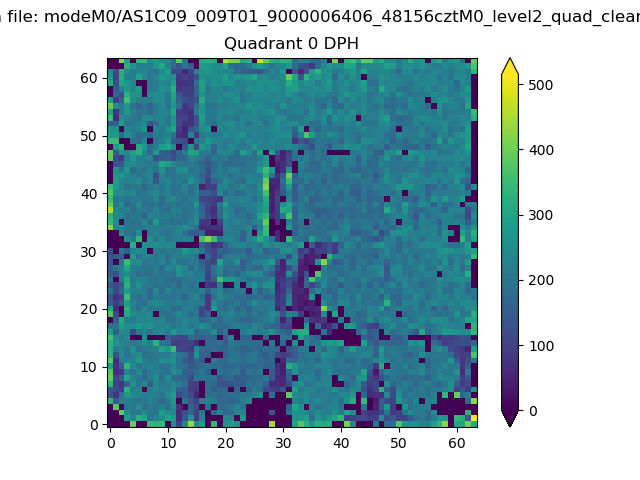 |
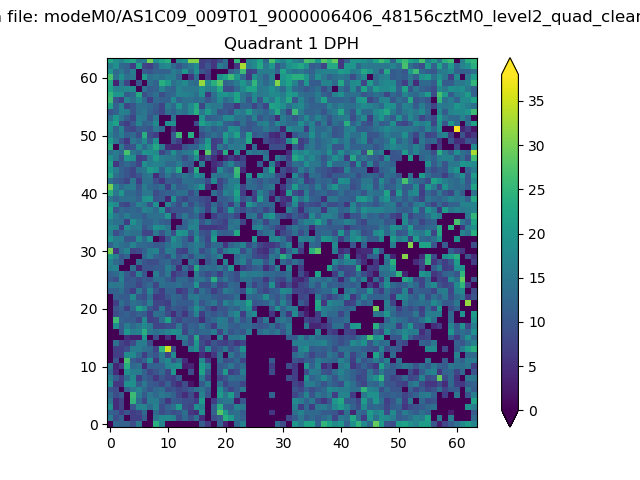 |
Quadrant B |
|---|---|---|---|
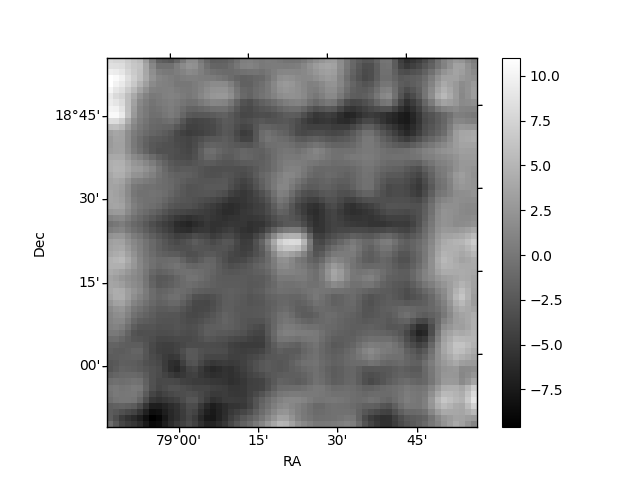
| Quadrant D | 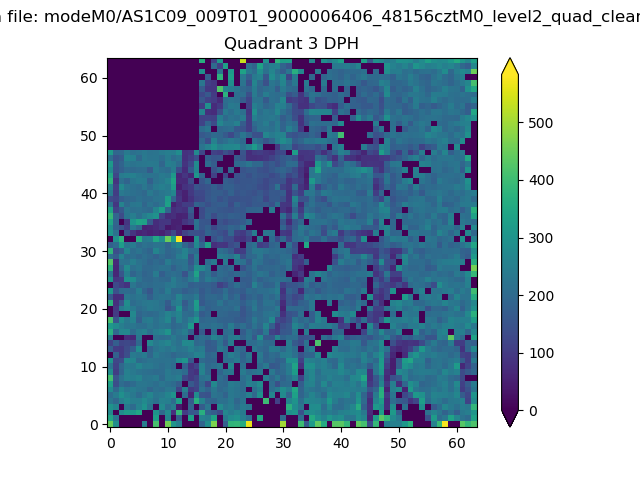 |
 |
Quadrant C |
| Plot type | Count rate plots | Images |
|---|---|---|
| Comparison with Poisson distribution Blue bars denote a histogram of data divided into 1 sec bins. Red curve is a Poisson curve with rate = median count rate of data. |
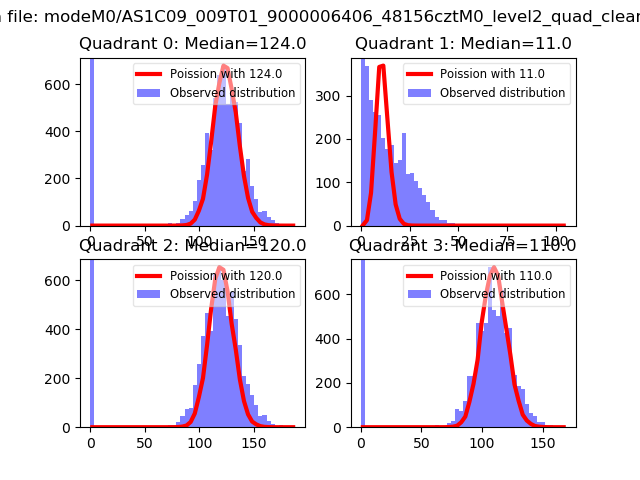 |
 |
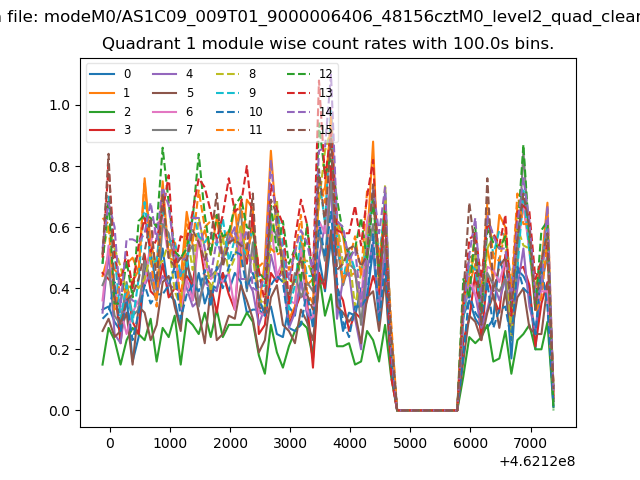
| Quadrant-wise count rates Data is divided into 100 sec bins |
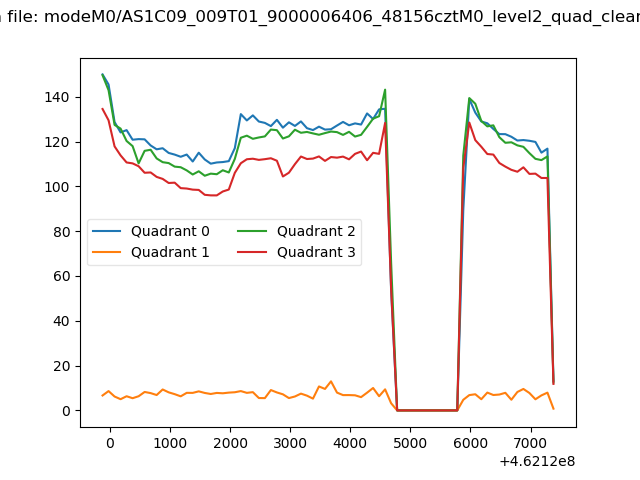 |
|
| Module-wise count rates for Quadrant A Data is divided into 100 sec bins |
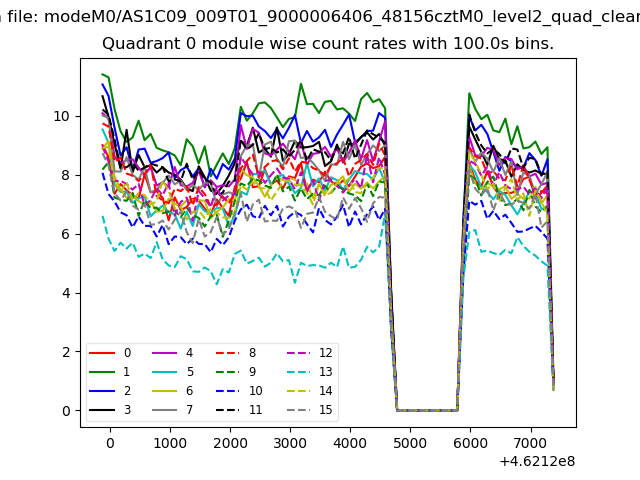 |
 |
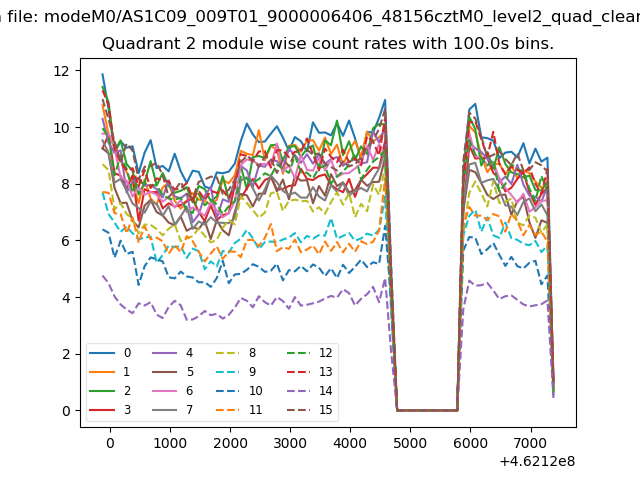
| Module-wise count rates for Quadrant B Data is divided into 100 sec bins |
 |
 |
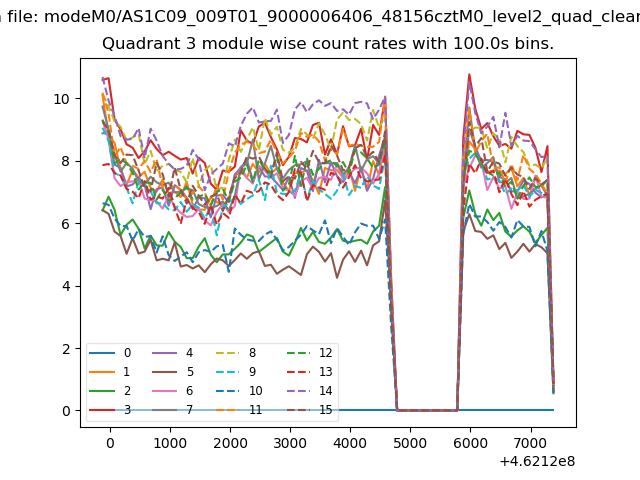
| Module-wise count rates for Quadrant C Data is divided into 100 sec bins |
 |
 |
| Module-wise count rates for Quadrant D Data is divided into 100 sec bins |
 |
 |
| Parameter | Plot |
|---|---|
| CZT HV Monitor | 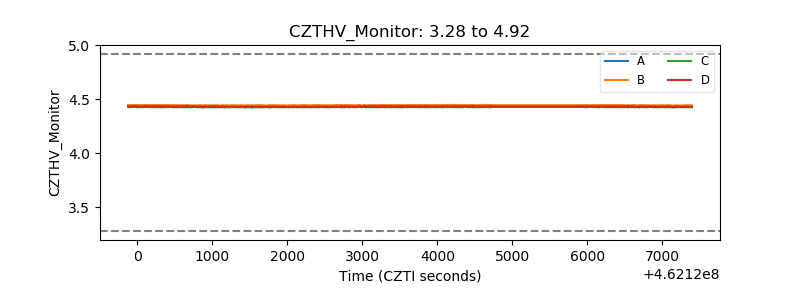 |
| D_VDD | 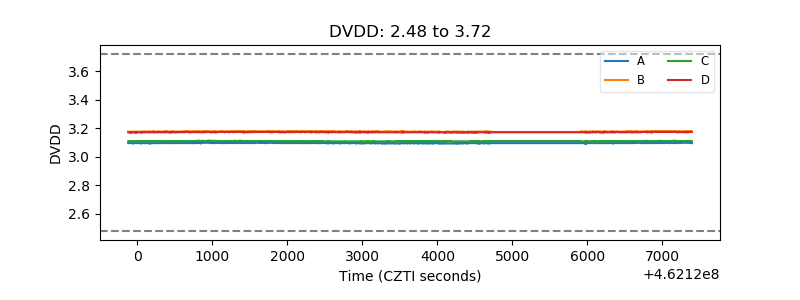 |
| Temperature 1 | 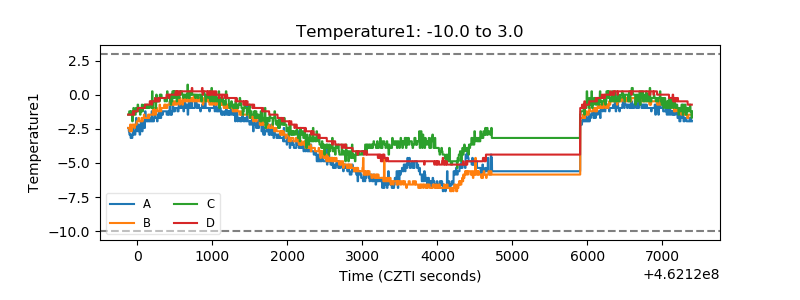 |
| Veto HV Monitor | 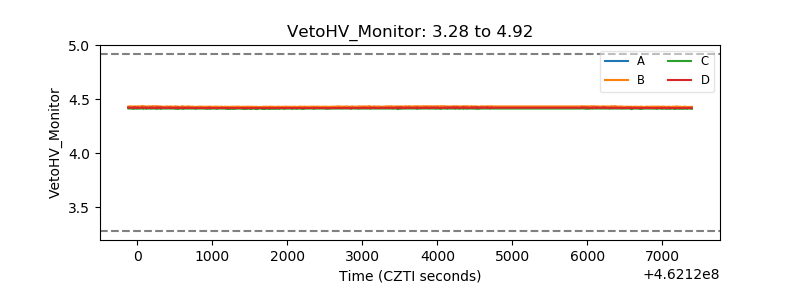 |
| Veto LLD | 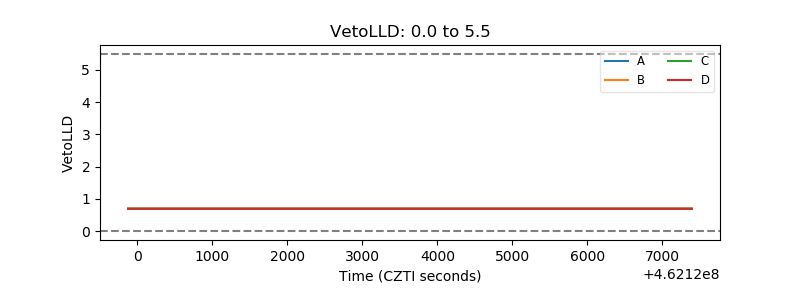 |
| Alpha Counter | 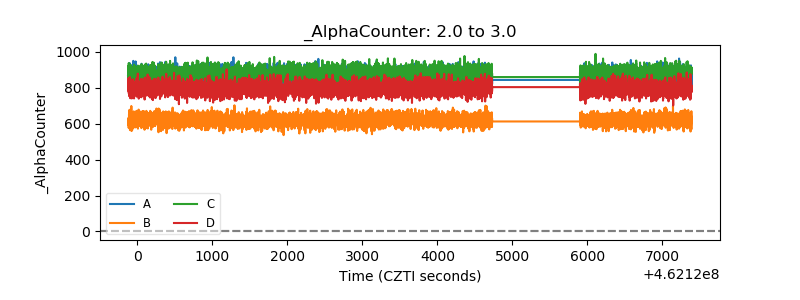 |
| _CPM_Rate | 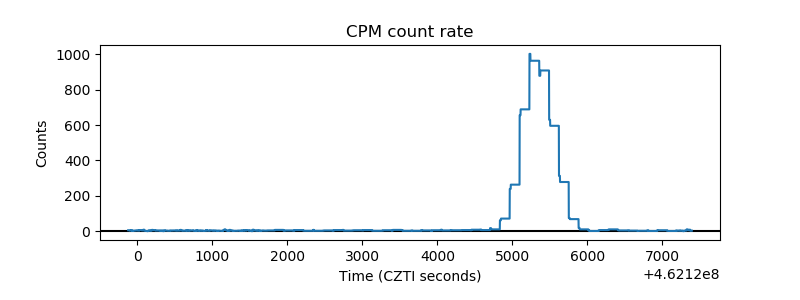 |
| CZT Counter | 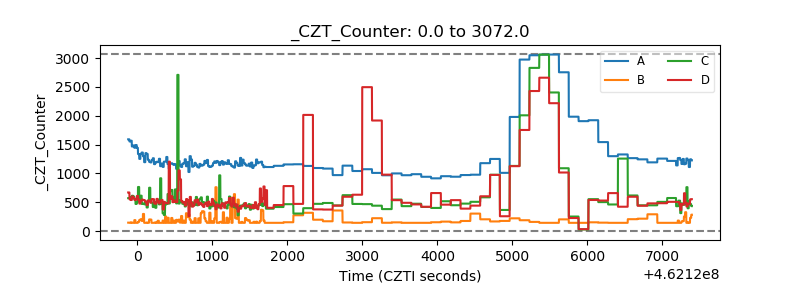 |
| +2.5 Volts monitor | 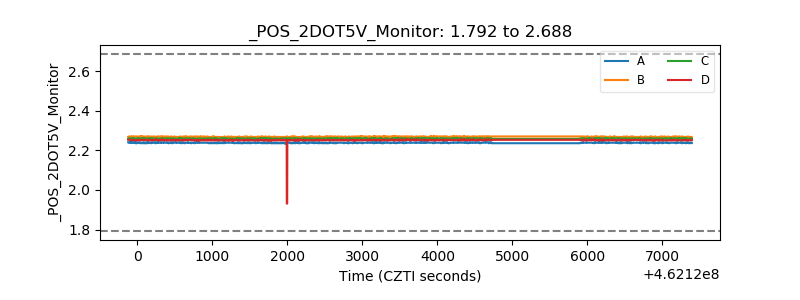 |
| +5 Volts monitor | 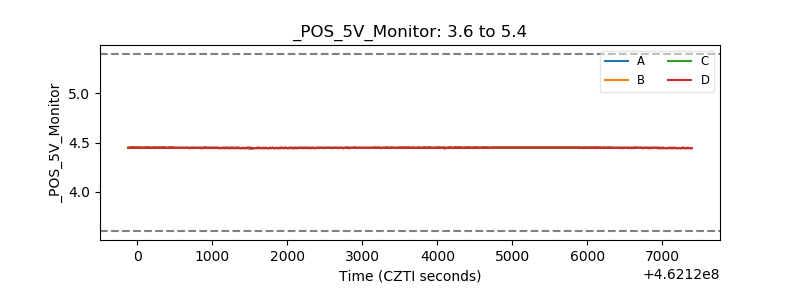 |
| _ROLL_ROT | 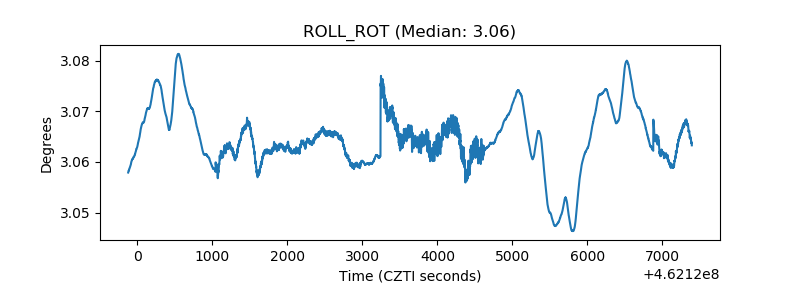 |
| _Roll_DEC | 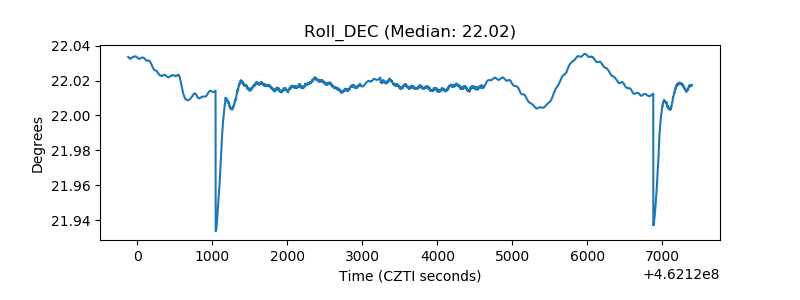 |
| _Roll_RA | 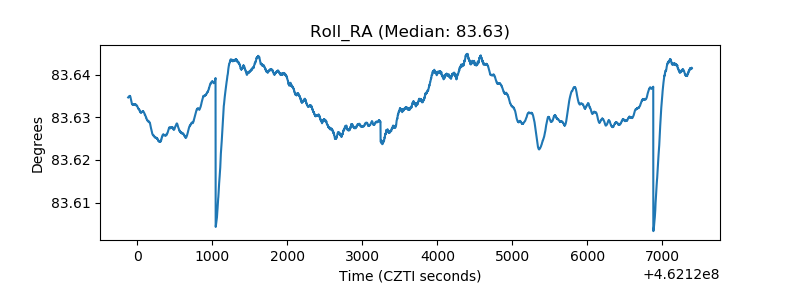 |
| Veto Counter | 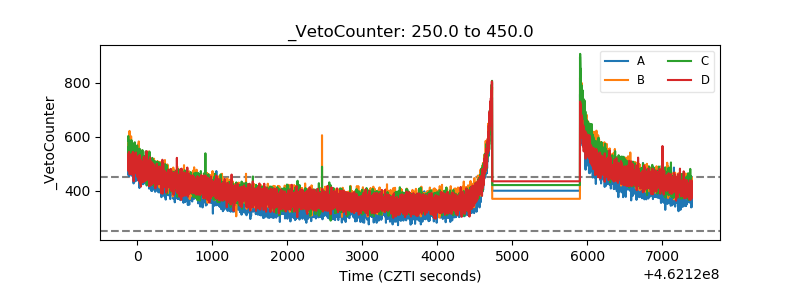 |