| Param | Original file | Final file |
|---|---|---|
| Filename | modeM0/AS1A13_029T01_9000006422_48261cztM0_level2.fits | modeM0/AS1A13_029T01_9000006422_48261cztM0_level2_quad_clean.evt |
| Size (bytes) | 532,656,000 | 114,177,600 |
| Size | 508.0 MB | 108.9 MB |
| Events in quadrant A | 7,717,255 | 735,146 |
| Events in quadrant B | 3,671,576 | 784,671 |
| Events in quadrant C | 3,771,112 | 746,485 |
| Events in quadrant D | 4,000,339 | 690,918 |
| Mode M0 | |||
|---|---|---|---|
| Quadrant | BADHDUFLAG | Total packets | Discarded packets |
| A | 0 | 27780 | 5 |
| B | 0 | 15847 | 2 |
| C | 0 | 16413 | 2 |
| D | 0 | 17047 | 2 |
| Mode SS | |||
|---|---|---|---|
| Quadrant | BADHDUFLAG | Total packets | Discarded packets |
| A | 0 | 146 | 0 |
| B | 0 | 146 | 0 |
| C | 0 | 146 | 0 |
| D | 0 | 146 | 0 |
| Mode M9 | |||
|---|---|---|---|
| Quadrant | BADHDUFLAG | Total packets | Discarded packets |
| A | 0 | 13 | 0 |
| B | 0 | 14 | 0 |
| C | 0 | 14 | 0 |
| D | 0 | 14 | 0 |
| Quadrant | Total seconds | Saturated seconds | Saturation percentage |
|---|---|---|---|
| A | 7178 | 553 | 7.704096% |
| B | 7178 | 247 | 3.441070% |
| C | 7178 | 229 | 3.190304% |
| D | 7178 | 209 | 2.911675% |
Noise dominated data is calculated using 1-second bins in cleaned event files. If a bin has >2000 counts, and if more than 50% of those come from <1% of pixels, then it is considered to be noise-dominated and hence unusable.
| Quadrant | # 1 sec bins | Bins with >0 counts | Bins with >2000 counts | High rate bins dominated by noise | Noise dominated (total time) | Noise dominated (detector-on time) | Marked lightcurve |
|---|---|---|---|---|---|---|---|
| A | 7723 | 7178 | 15 | 15 | 0.19% | 0.21% | 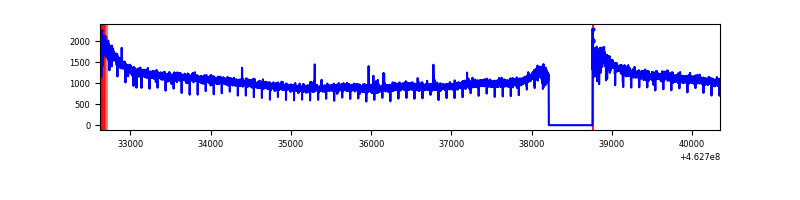 |
| B | 7723 | 7178 | 19 | 19 | 0.25% | 0.26% | 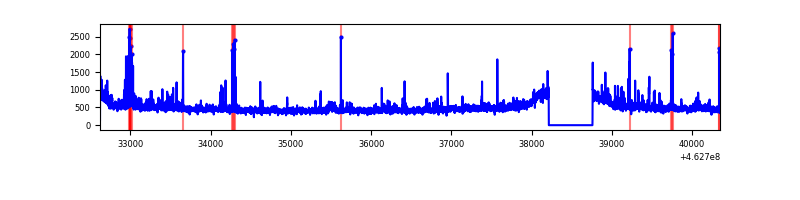 |
| C | 7723 | 7178 | 108 | 108 | 1.40% | 1.50% | 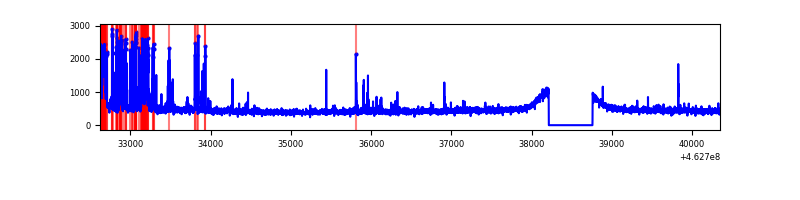 |
| D | 7723 | 7178 | 99 | 99 | 1.28% | 1.38% | 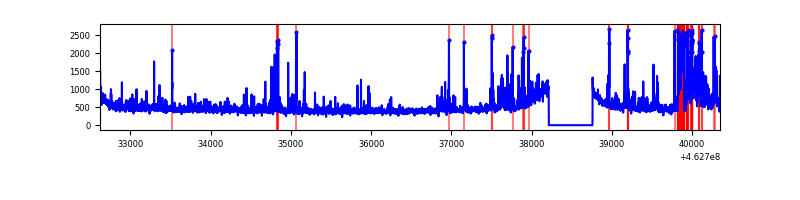 |
Top three noisy pixels from each quadrant. If the there are fewer than three noisy pixels in the level2.evt file, extra rows are filled as -1
| Pixel properties | Quadrant properties | ||||||
|---|---|---|---|---|---|---|---|
| Quadrant | DetID | PixID | Counts | Sigma | Mean | Median | Sigma |
| A | 10 | 83 | 4502400 | 25973.4 | 822 | 803 | 173.3 |
| A | 3 | 14 | 18045 | 99.48 | 822 | 803 | 173.3 |
| A | 13 | 254 | 14593 | 79.57 | 822 | 803 | 173.3 |
| B | 4 | 21 | 191383 | 1138.2 | 834 | 807 | 167.4 |
| B | 0 | 200 | 49386 | 290.13 | 834 | 807 | 167.4 |
| B | 0 | 186 | 28472 | 165.23 | 834 | 807 | 167.4 |
| C | 12 | 2 | 515906 | 2648.27 | 817 | 818 | 194.5 |
| C | 14 | 254 | 51152 | 258.79 | 817 | 818 | 194.5 |
| C | 0 | 207 | 13045 | 62.86 | 817 | 818 | 194.5 |
| D | 2 | 165 | 164025 | 780.26 | 824 | 796 | 209.2 |
| D | 2 | 249 | 156926 | 746.32 | 824 | 796 | 209.2 |
| D | 12 | 221 | 139539 | 663.21 | 824 | 796 | 209.2 |
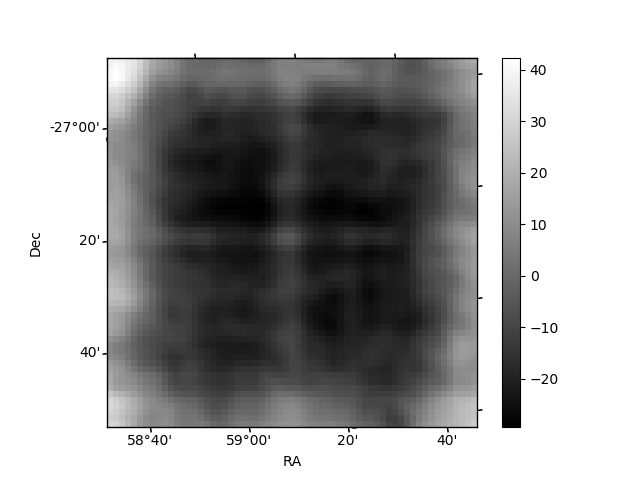
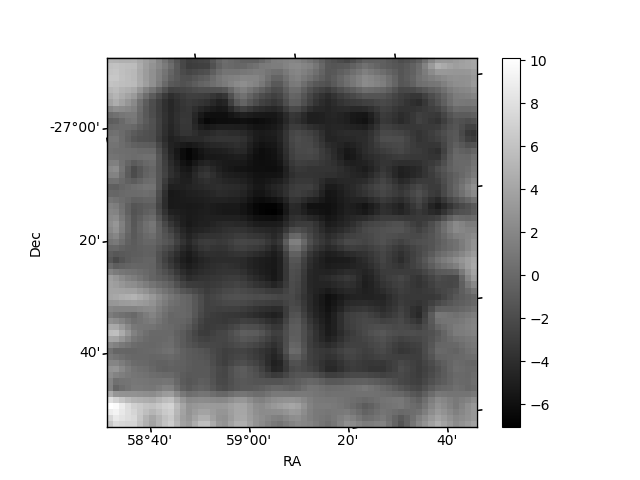
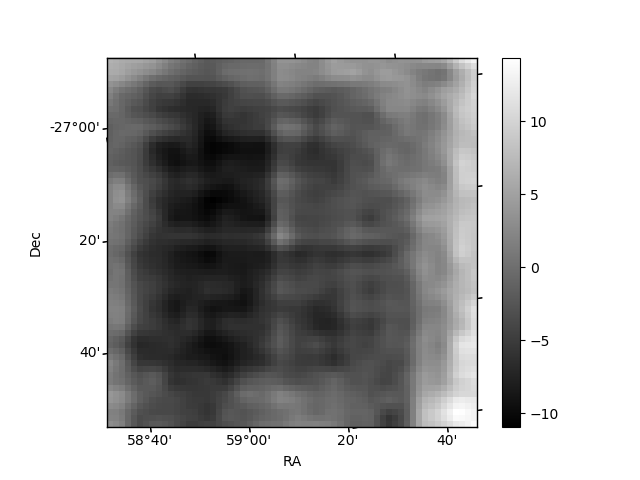
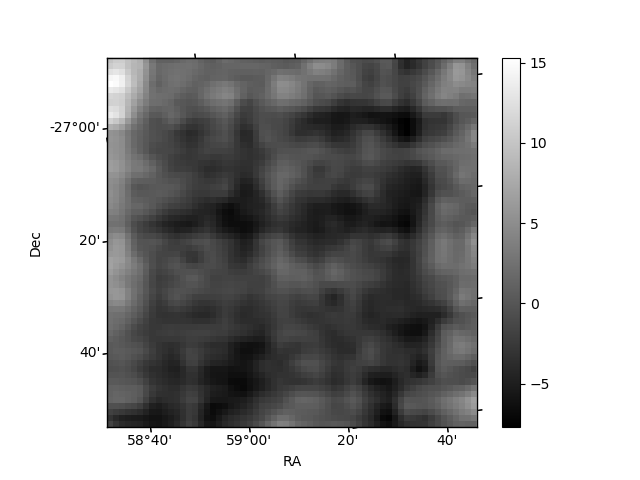
Histogram calculated using DETX and DETY for each event in the final _common_clean file
| Quadrant A | 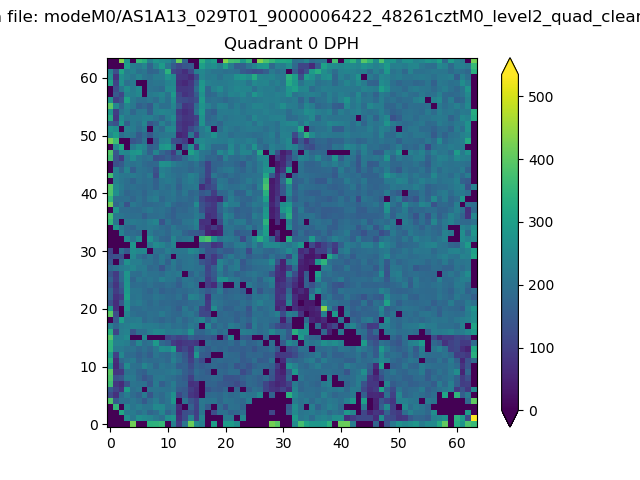 |
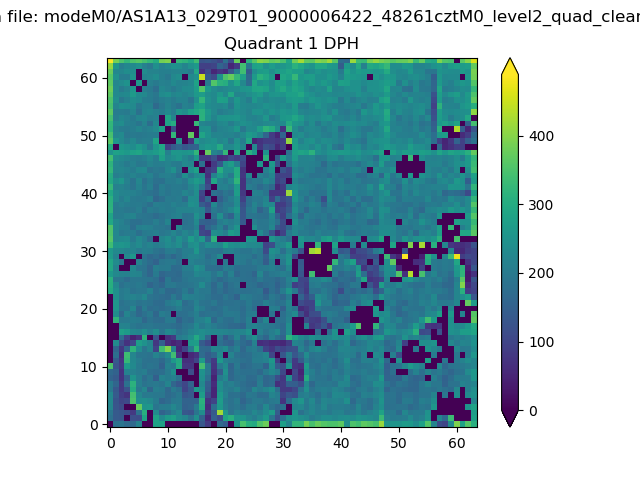 |
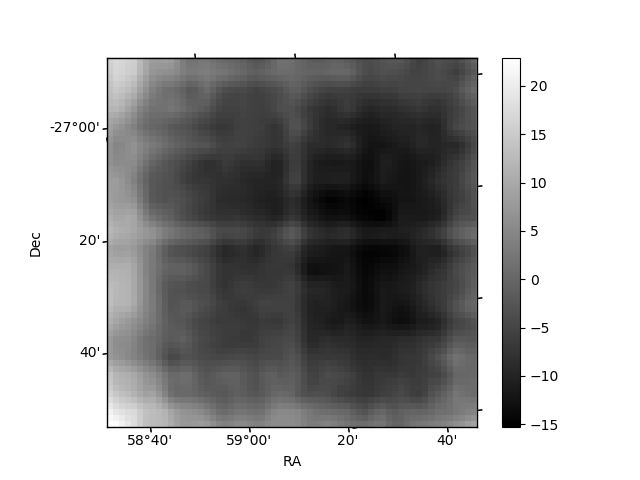
Quadrant B |
|---|---|---|---|
| Quadrant D | 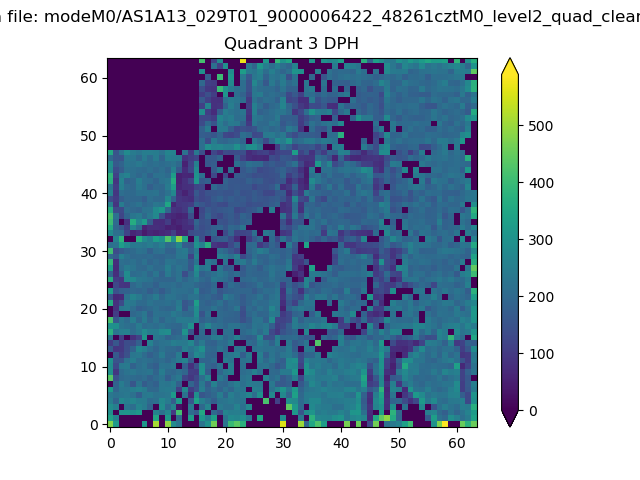 |
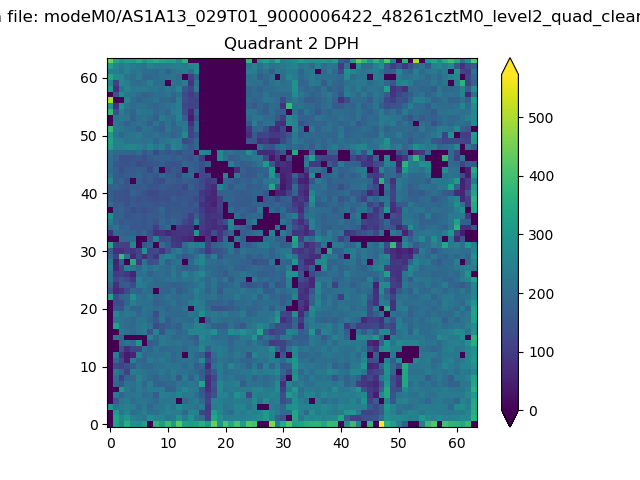 |
Quadrant C |
| Plot type | Count rate plots | Images |
|---|---|---|
| Comparison with Poisson distribution Blue bars denote a histogram of data divided into 1 sec bins. Red curve is a Poisson curve with rate = median count rate of data. |
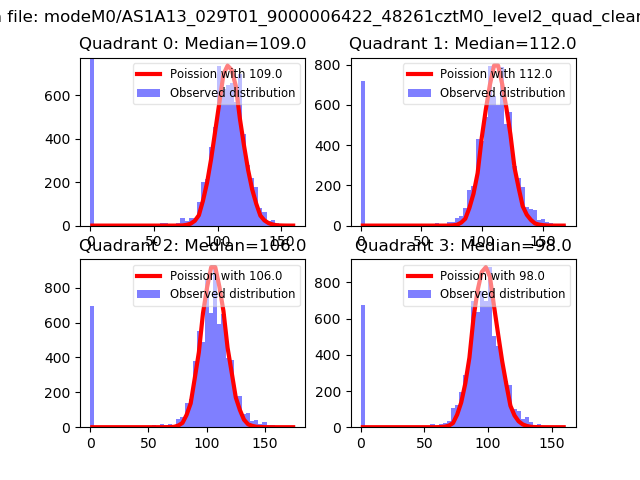 |
 |
| Quadrant-wise count rates Data is divided into 100 sec bins |
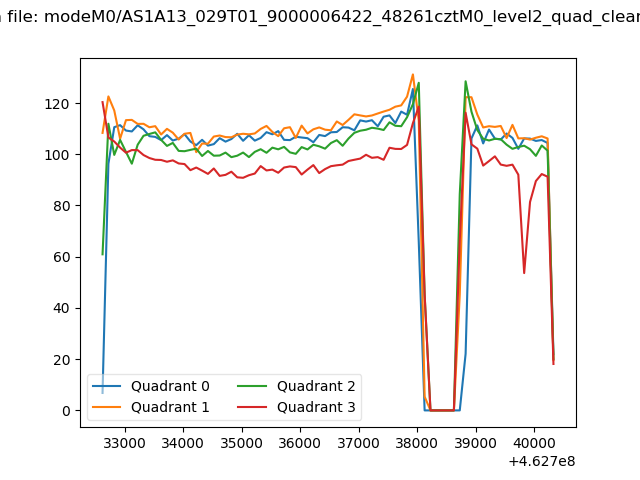 |
|
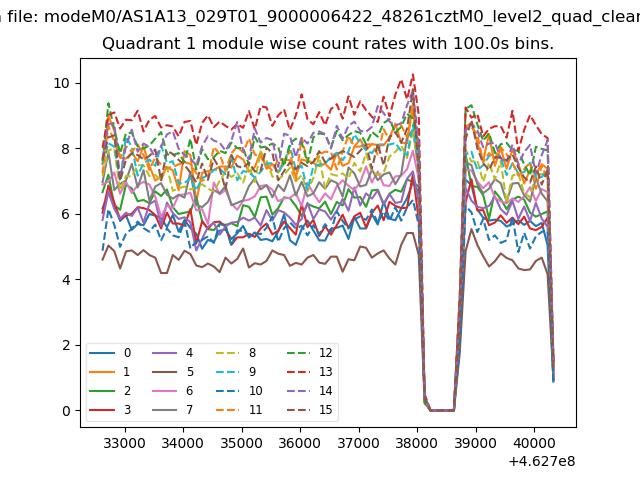
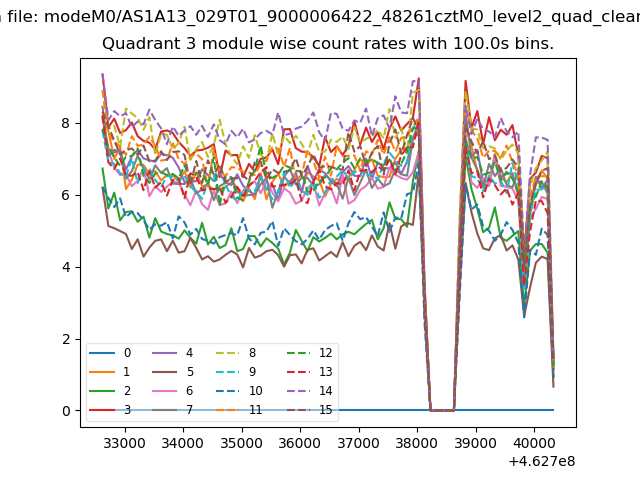
| Module-wise count rates for Quadrant A Data is divided into 100 sec bins |
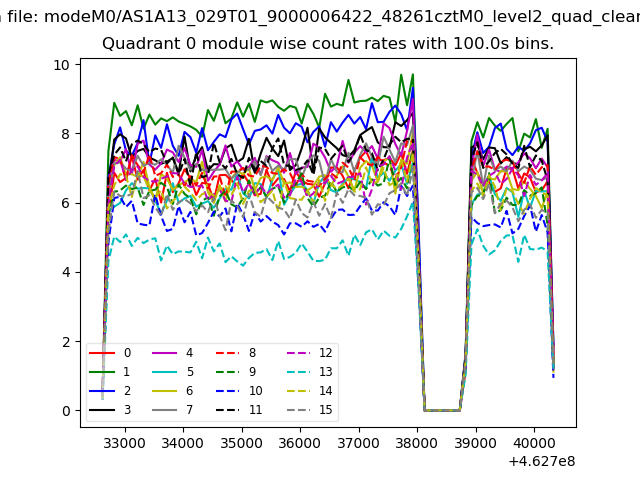 |
 |
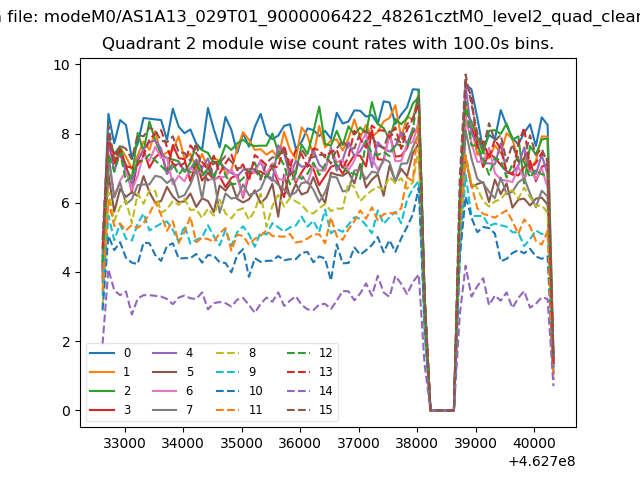
| Module-wise count rates for Quadrant B Data is divided into 100 sec bins |
 |
 |
| Module-wise count rates for Quadrant C Data is divided into 100 sec bins |
 |
 |
| Module-wise count rates for Quadrant D Data is divided into 100 sec bins |
 |
 |
| Parameter | Plot |
|---|---|
| CZT HV Monitor | 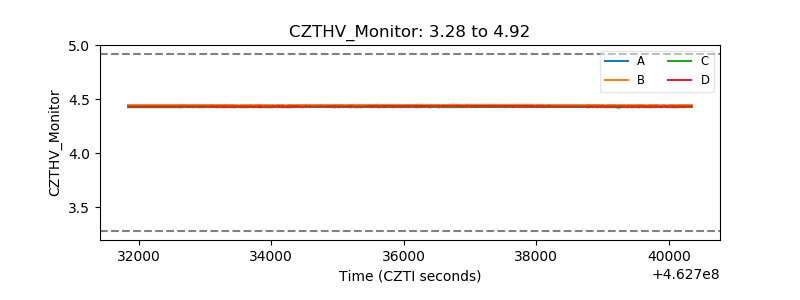 |
| D_VDD | 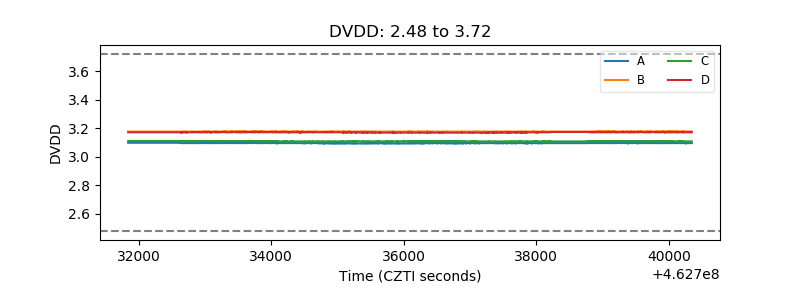 |
| Temperature 1 | 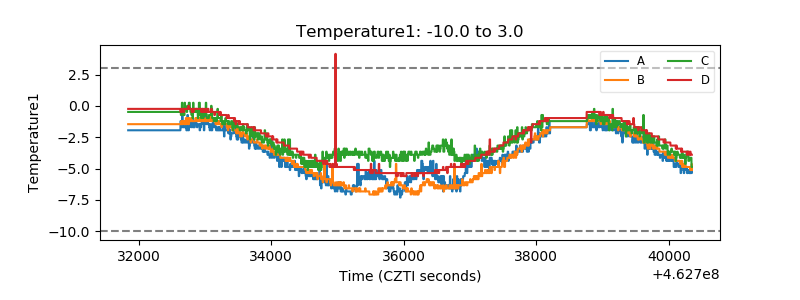 |
| Veto HV Monitor | 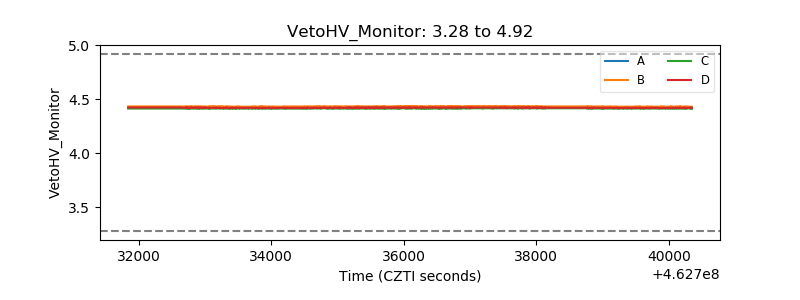 |
| Veto LLD | 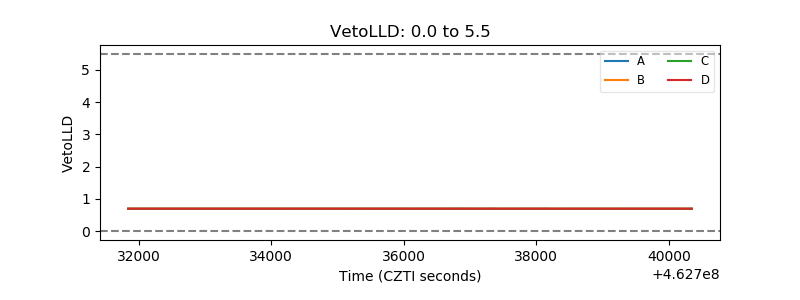 |
| Alpha Counter | 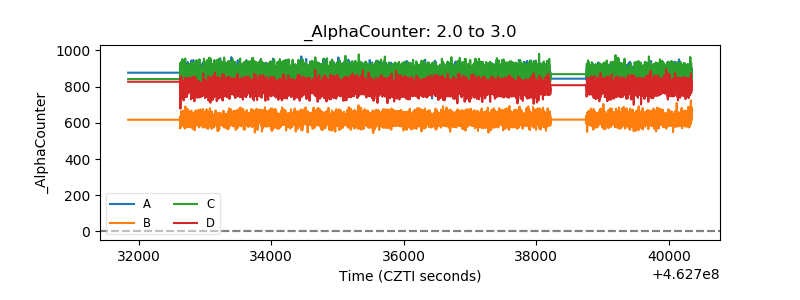 |
| _CPM_Rate | 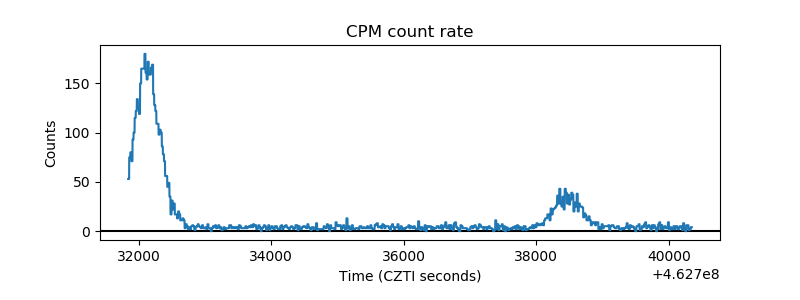 |
| CZT Counter | 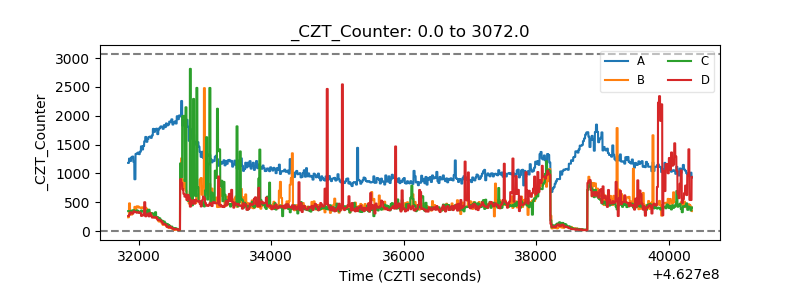 |
| +2.5 Volts monitor | 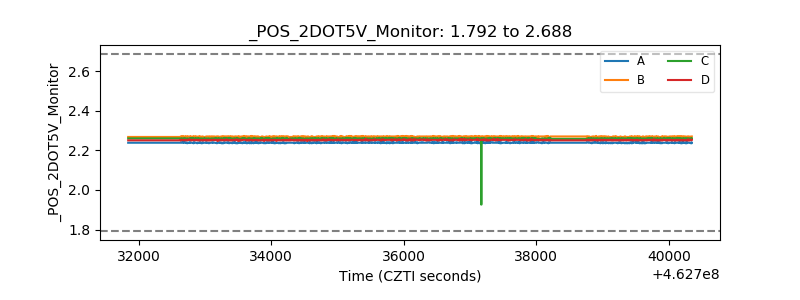 |
| +5 Volts monitor | 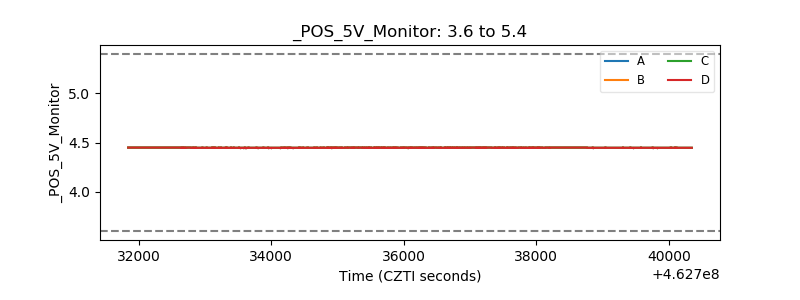 |
| _ROLL_ROT | 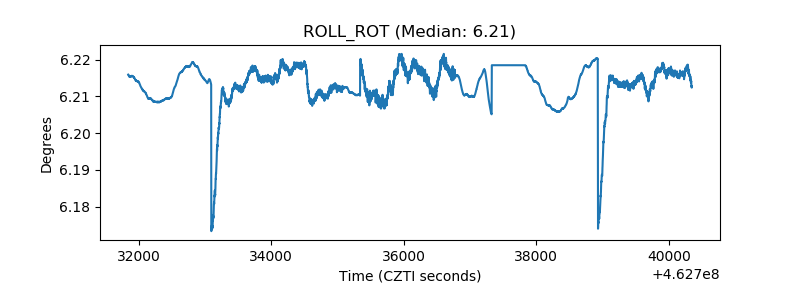 |
| _Roll_DEC | 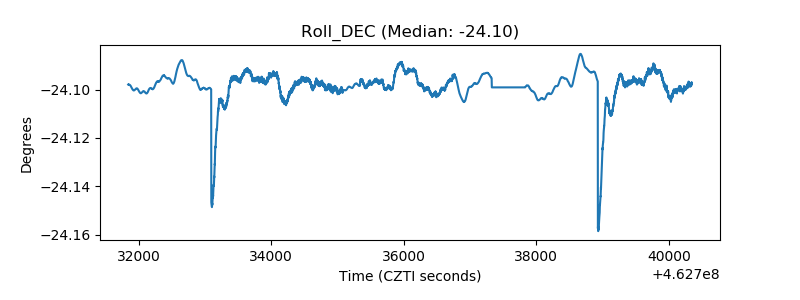 |
| _Roll_RA | 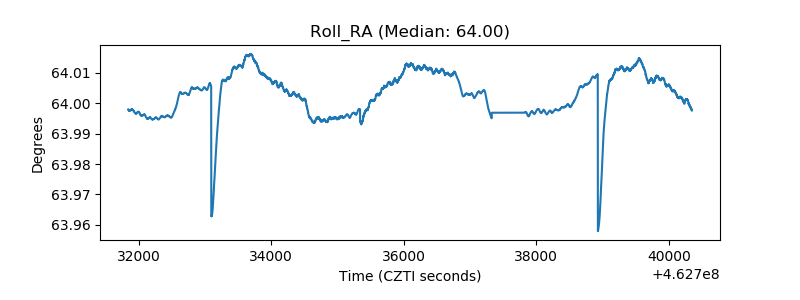 |
| Veto Counter | 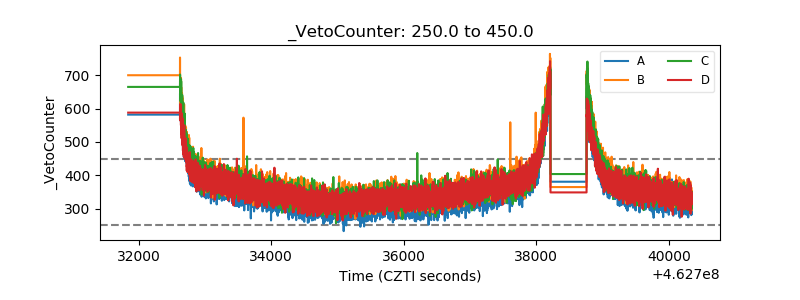 |