| Param | Original file | Final file |
|---|---|---|
| Filename | modeM0/AS1A13_037T01_9000006436_48567cztM0_level2.fits | modeM0/AS1A13_037T01_9000006436_48567cztM0_level2_quad_clean.evt |
| Size (bytes) | 563,685,120 | 127,428,480 |
| Size | 537.6 MB | 121.5 MB |
| Events in quadrant A | 8,092,468 | 817,413 |
| Events in quadrant B | 3,909,322 | 863,603 |
| Events in quadrant C | 3,688,703 | 843,952 |
| Events in quadrant D | 4,519,522 | 745,770 |
| Mode M0 | |||
|---|---|---|---|
| Quadrant | BADHDUFLAG | Total packets | Discarded packets |
| A | 0 | 30138 | 170 |
| B | 0 | 18071 | 90 |
| C | 0 | 17638 | 51 |
| D | 0 | 19756 | 85 |
| Mode SS | |||
|---|---|---|---|
| Quadrant | BADHDUFLAG | Total packets | Discarded packets |
| A | 0 | 174 | 0 |
| B | 0 | 174 | 2 |
| C | 0 | 174 | 0 |
| D | 0 | 174 | 2 |
| Quadrant | Total seconds | Saturated seconds | Saturation percentage |
|---|---|---|---|
| A | 8435 | 508 | 6.022525% |
| B | 8447 | 379 | 4.486800% |
| C | 8458 | 230 | 2.719319% |
| D | 8447 | 386 | 4.569670% |
Noise dominated data is calculated using 1-second bins in cleaned event files. If a bin has >2000 counts, and if more than 50% of those come from <1% of pixels, then it is considered to be noise-dominated and hence unusable.
| Quadrant | # 1 sec bins | Bins with >0 counts | Bins with >2000 counts | High rate bins dominated by noise | Noise dominated (total time) | Noise dominated (detector-on time) | Marked lightcurve |
|---|---|---|---|---|---|---|---|
| A | 8636 | 8462 | 1 | 1 | 0.01% | 0.01% |  |
| B | 8634 | 8472 | 16 | 16 | 0.19% | 0.19% |  |
| C | 8638 | 8477 | 0 | 0 | 0.00% | 0.00% |  |
| D | 8638 | 8473 | 103 | 103 | 1.19% | 1.22% |  |
Top three noisy pixels from each quadrant. If the there are fewer than three noisy pixels in the level2.evt file, extra rows are filled as -1
| Pixel properties | Quadrant properties | ||||||
|---|---|---|---|---|---|---|---|
| Quadrant | DetID | PixID | Counts | Sigma | Mean | Median | Sigma |
| A | 10 | 83 | 4428061 | 22406.08 | 931 | 905 | 197.6 |
| A | 12 | 189 | 39797 | 196.83 | 931 | 905 | 197.6 |
| A | 13 | 248 | 22281 | 108.19 | 931 | 905 | 197.6 |
| B | 5 | 255 | 136701 | 721.51 | 939 | 906 | 188.2 |
| B | 12 | 16 | 33131 | 171.22 | 939 | 906 | 188.2 |
| B | 12 | 111 | 25278 | 129.49 | 939 | 906 | 188.2 |
| C | 12 | 250 | 20662 | 88.98 | 936 | 938 | 221.7 |
| C | 10 | 20 | 9959 | 40.7 | 936 | 938 | 221.7 |
| C | 14 | 254 | 6302 | 24.2 | 936 | 938 | 221.7 |
| D | 2 | 165 | 289320 | 1253.61 | 918 | 889 | 230.1 |
| D | 7 | 96 | 257836 | 1116.77 | 918 | 889 | 230.1 |
| D | 13 | 171 | 185193 | 801.04 | 918 | 889 | 230.1 |
Histogram calculated using DETX and DETY for each event in the final _common_clean file
| Quadrant A |  |
 |
Quadrant B |
|---|---|---|---|
| Quadrant D |  |
 |
Quadrant C |
| Plot type | Count rate plots | Images |
|---|---|---|
| Comparison with Poisson distribution Blue bars denote a histogram of data divided into 1 sec bins. Red curve is a Poisson curve with rate = median count rate of data. |
 |
 |
| Quadrant-wise count rates Data is divided into 100 sec bins |
 |
|
| Module-wise count rates for Quadrant A Data is divided into 100 sec bins |
 |
 |
| Module-wise count rates for Quadrant B Data is divided into 100 sec bins |
 |
 |
| Module-wise count rates for Quadrant C Data is divided into 100 sec bins |
 |
 |
| Module-wise count rates for Quadrant D Data is divided into 100 sec bins |
 |
 |
| Parameter | Plot |
|---|---|
| CZT HV Monitor |  |
| D_VDD |  |
| Temperature 1 |  |
| Veto HV Monitor |  |
| Veto LLD |  |
| Alpha Counter |  |
| _CPM_Rate |  |
| CZT Counter |  |
| +2.5 Volts monitor | 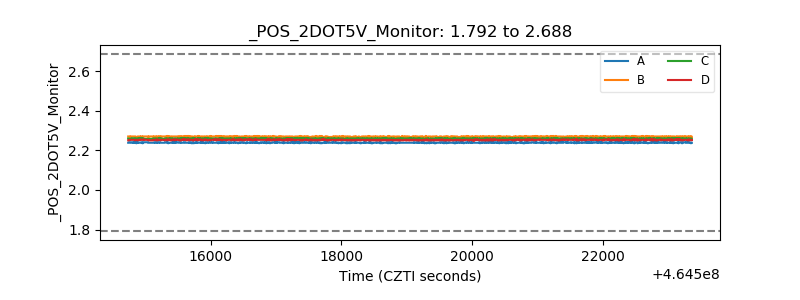 |
| +5 Volts monitor | 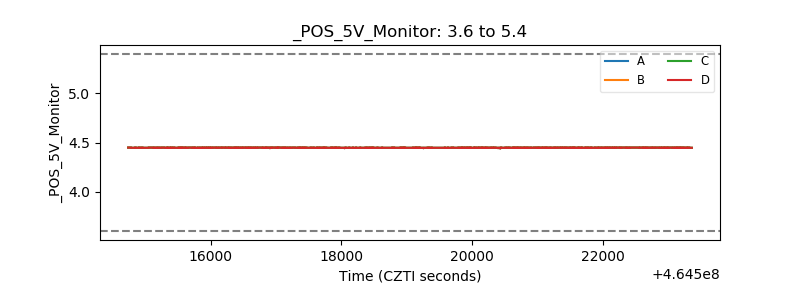 |
| _ROLL_ROT |  |
| _Roll_DEC |  |
| _Roll_RA |  |
| Veto Counter |  |