| Param | Original file | Final file |
|---|---|---|
| Filename | modeM0/AS1A13_037T01_9000006436_48618cztM0_level2.fits | modeM0/AS1A13_037T01_9000006436_48618cztM0_level2_quad_clean.evt |
| Size (bytes) | 473,353,920 | 103,651,200 |
| Size | 451.4 MB | 98.8 MB |
| Events in quadrant A | 7,154,046 | 668,169 |
| Events in quadrant B | 3,087,530 | 719,547 |
| Events in quadrant C | 2,856,051 | 701,587 |
| Events in quadrant D | 3,914,407 | 591,401 |
| Mode M0 | |||
|---|---|---|---|
| Quadrant | BADHDUFLAG | Total packets | Discarded packets |
| A | 0 | 25488 | 2 |
| B | 0 | 14029 | 2 |
| C | 0 | 13558 | 2 |
| D | 0 | 16554 | 2 |
| Mode M9 | |||
|---|---|---|---|
| Quadrant | BADHDUFLAG | Total packets | Discarded packets |
| A | 0 | 13 | 0 |
| B | 0 | 14 | 0 |
| C | 0 | 14 | 0 |
| D | 0 | 14 | 0 |
| Mode SS | |||
|---|---|---|---|
| Quadrant | BADHDUFLAG | Total packets | Discarded packets |
| A | 0 | 132 | 0 |
| B | 0 | 132 | 0 |
| C | 0 | 132 | 0 |
| D | 0 | 132 | 0 |
| Quadrant | Total seconds | Saturated seconds | Saturation percentage |
|---|---|---|---|
| A | 6567 | 418 | 6.365159% |
| B | 6567 | 116 | 1.766408% |
| C | 6567 | 29 | 0.441602% |
| D | 6567 | 402 | 6.121517% |
Noise dominated data is calculated using 1-second bins in cleaned event files. If a bin has >2000 counts, and if more than 50% of those come from <1% of pixels, then it is considered to be noise-dominated and hence unusable.
| Quadrant | # 1 sec bins | Bins with >0 counts | Bins with >2000 counts | High rate bins dominated by noise | Noise dominated (total time) | Noise dominated (detector-on time) | Marked lightcurve |
|---|---|---|---|---|---|---|---|
| A | 7637 | 6568 | 170 | 170 | 2.23% | 2.59% | 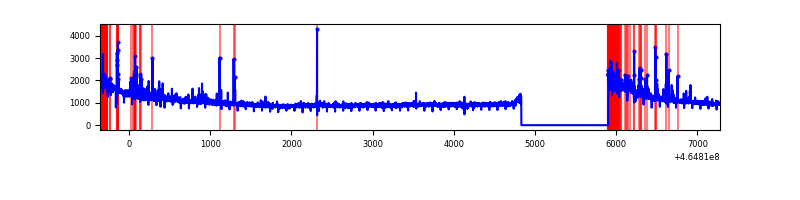 |
| B | 7637 | 6568 | 47 | 47 | 0.62% | 0.72% | 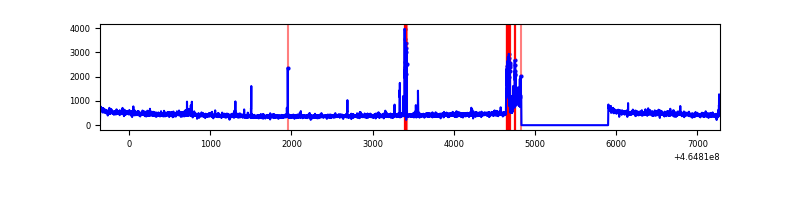 |
| C | 7637 | 6568 | 14 | 14 | 0.18% | 0.21% |  |
| D | 7637 | 6568 | 353 | 353 | 4.62% | 5.37% | 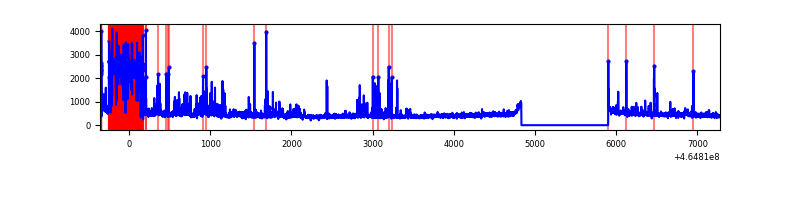 |
Top three noisy pixels from each quadrant. If the there are fewer than three noisy pixels in the level2.evt file, extra rows are filled as -1
| Pixel properties | Quadrant properties | ||||||
|---|---|---|---|---|---|---|---|
| Quadrant | DetID | PixID | Counts | Sigma | Mean | Median | Sigma |
| A | 10 | 83 | 4128306 | 28254.78 | 695 | 681 | 146.1 |
| A | 13 | 248 | 303932 | 2075.84 | 695 | 681 | 146.1 |
| A | 12 | 189 | 26249 | 175.02 | 695 | 681 | 146.1 |
| B | 12 | 16 | 174132 | 1251.76 | 707 | 685 | 138.6 |
| B | 15 | 85 | 53510 | 381.24 | 707 | 685 | 138.6 |
| B | 12 | 111 | 17680 | 122.65 | 707 | 685 | 138.6 |
| C | 12 | 2 | 98532 | 589.21 | 704 | 705 | 166.0 |
| C | 14 | 254 | 7368 | 40.13 | 704 | 705 | 166.0 |
| C | 13 | 61 | 4698 | 24.05 | 704 | 705 | 166.0 |
| D | 2 | 165 | 1194846 | 7182.11 | 667 | 647 | 166.3 |
| D | 2 | 249 | 72933 | 434.74 | 667 | 647 | 166.3 |
| D | 2 | 234 | 33197 | 195.76 | 667 | 647 | 166.3 |
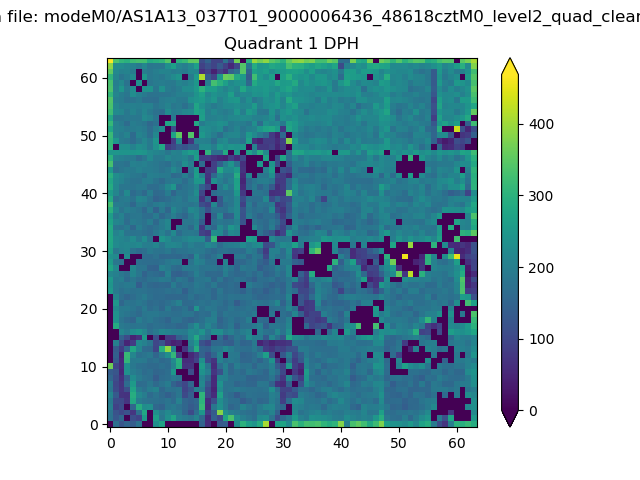
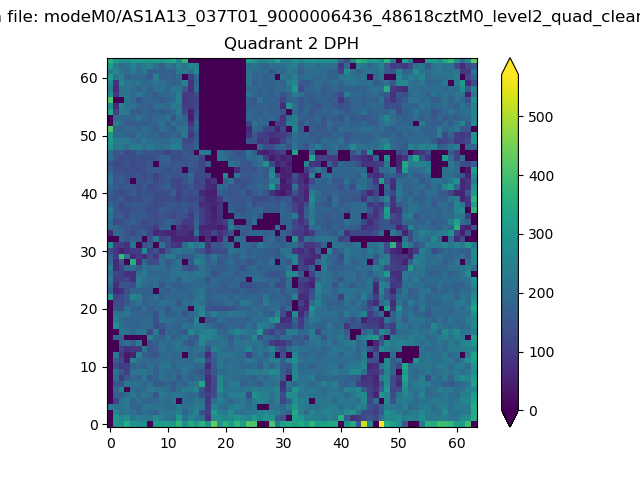
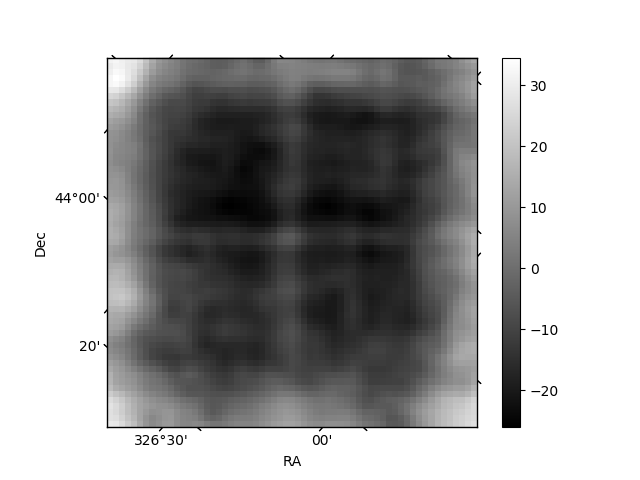
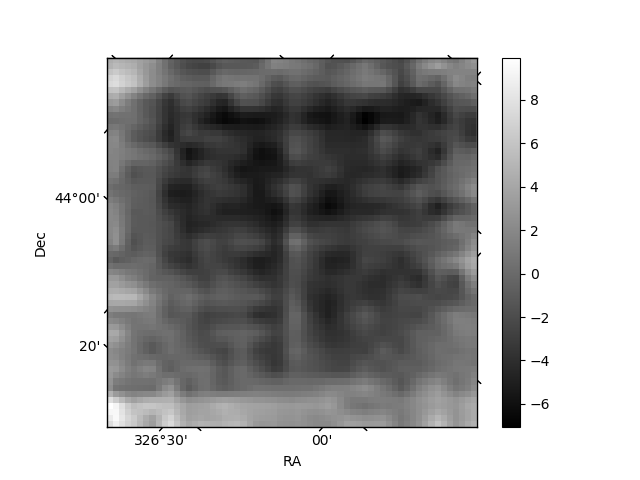
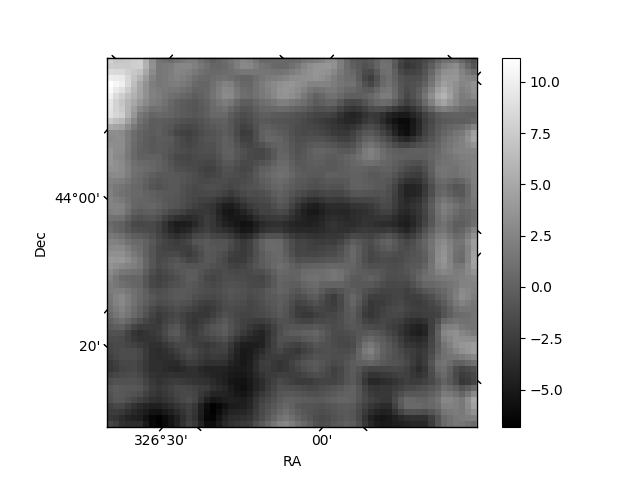
Histogram calculated using DETX and DETY for each event in the final _common_clean file
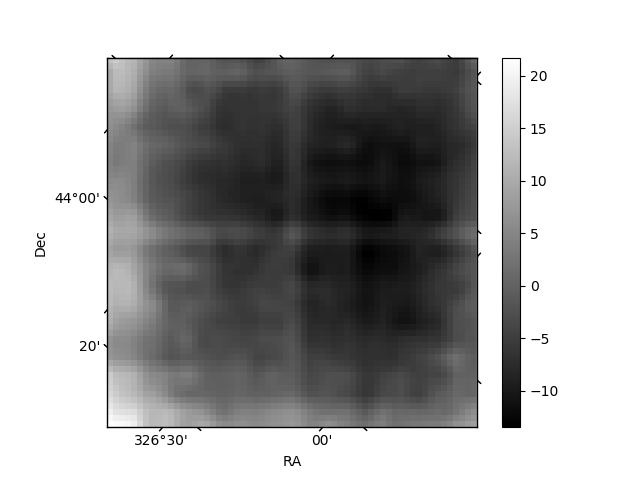
| Quadrant A | 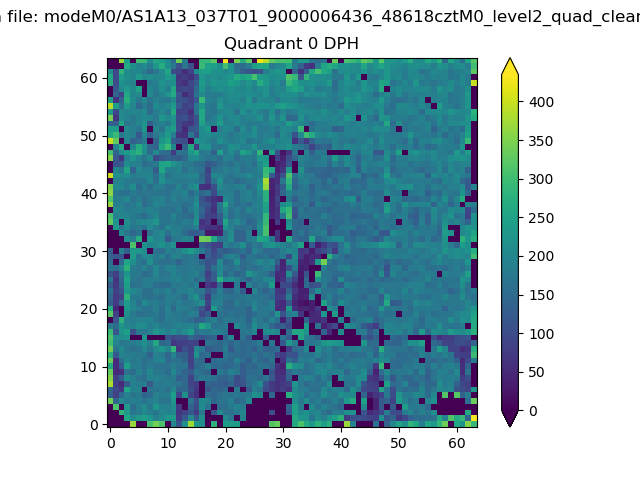 |
 |
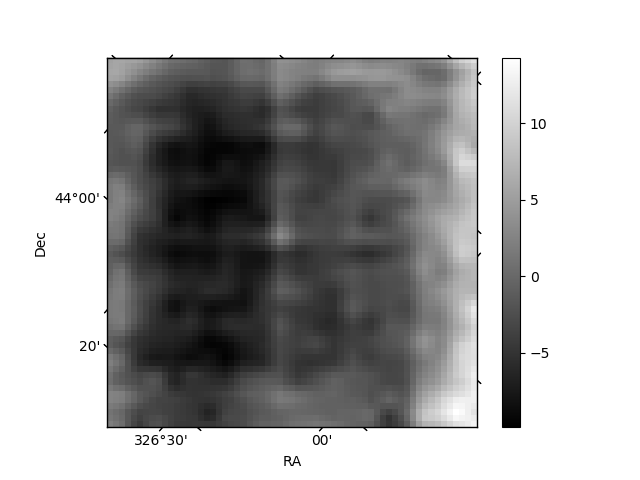
Quadrant B |
|---|---|---|---|
| Quadrant D | 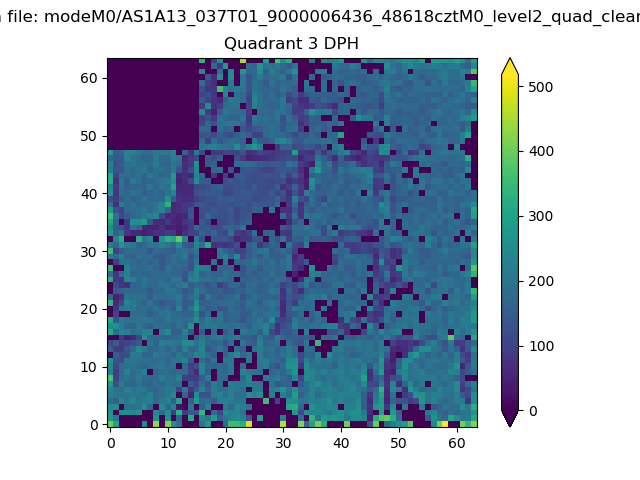 |
 |
Quadrant C |
| Plot type | Count rate plots | Images |
|---|---|---|
| Comparison with Poisson distribution Blue bars denote a histogram of data divided into 1 sec bins. Red curve is a Poisson curve with rate = median count rate of data. |
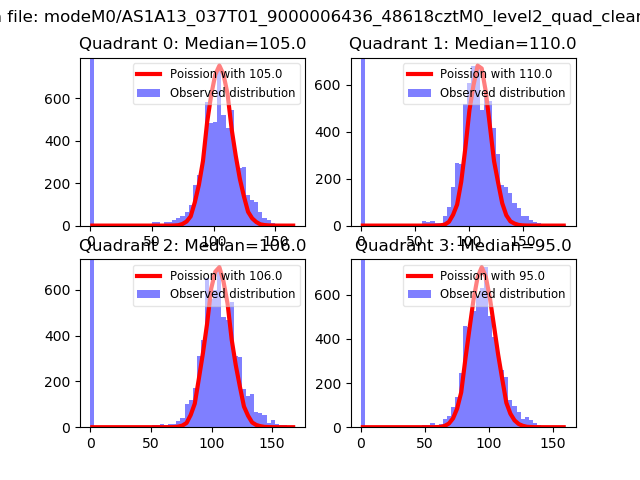 |
 |
| Quadrant-wise count rates Data is divided into 100 sec bins |
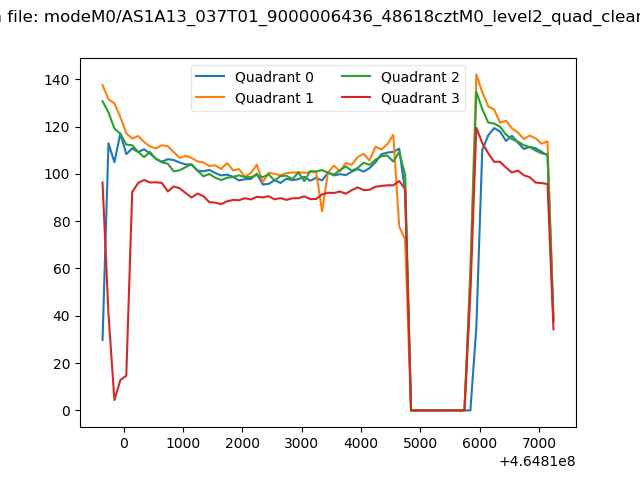 |
|
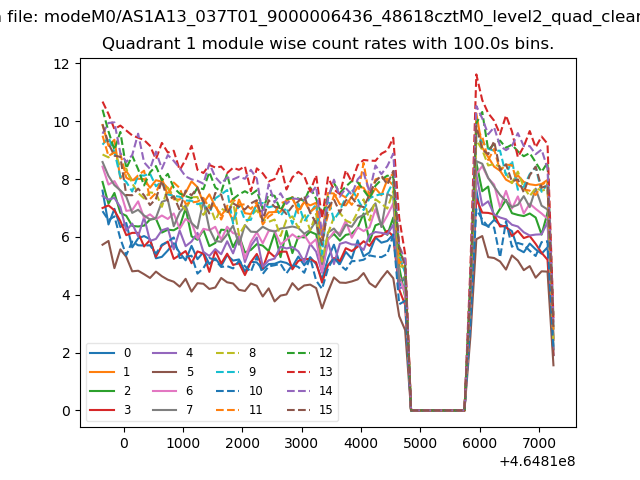
| Module-wise count rates for Quadrant A Data is divided into 100 sec bins |
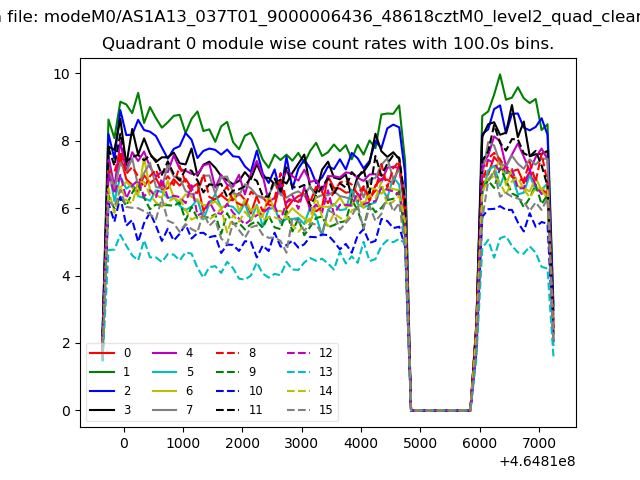 |
 |
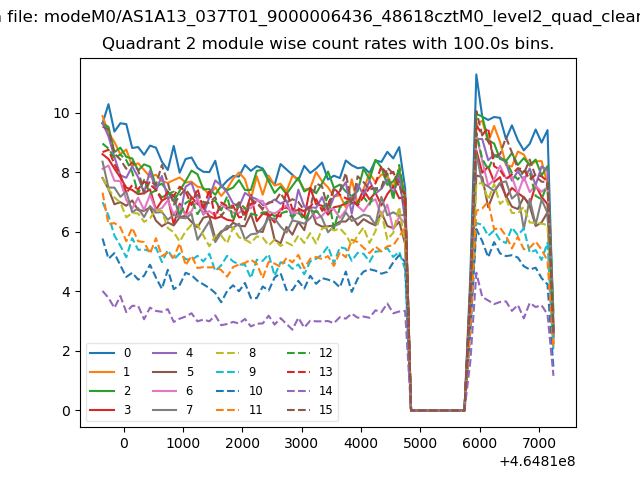
| Module-wise count rates for Quadrant B Data is divided into 100 sec bins |
 |
 |
| Module-wise count rates for Quadrant C Data is divided into 100 sec bins |
 |
 |
| Module-wise count rates for Quadrant D Data is divided into 100 sec bins |
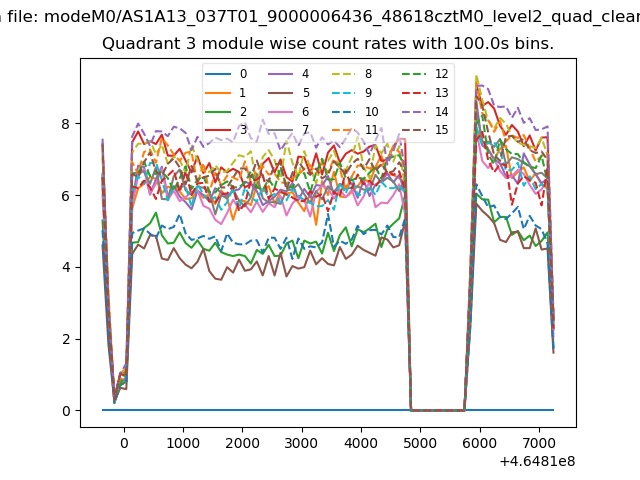 |
 |
| Parameter | Plot |
|---|---|
| CZT HV Monitor | 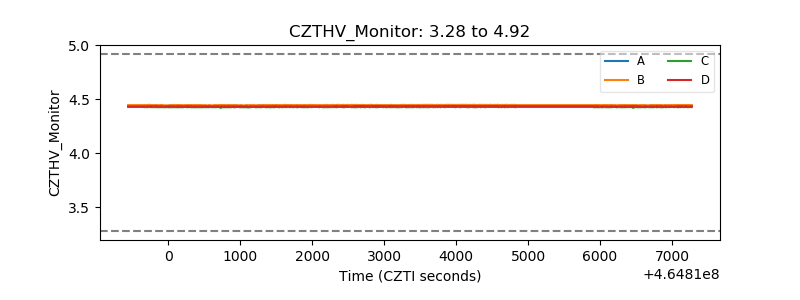 |
| D_VDD | 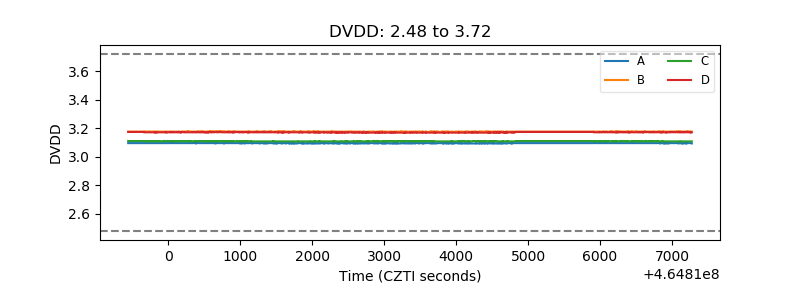 |
| Temperature 1 | 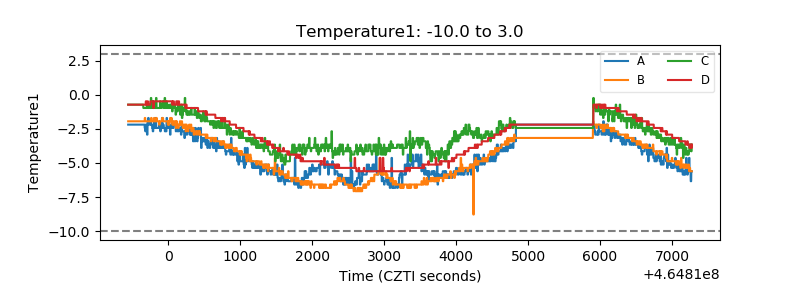 |
| Veto HV Monitor | 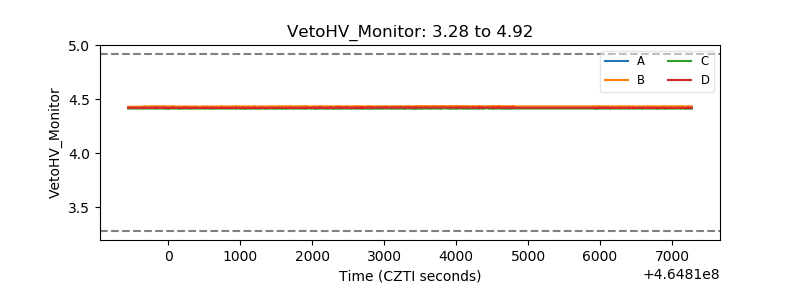 |
| Veto LLD | 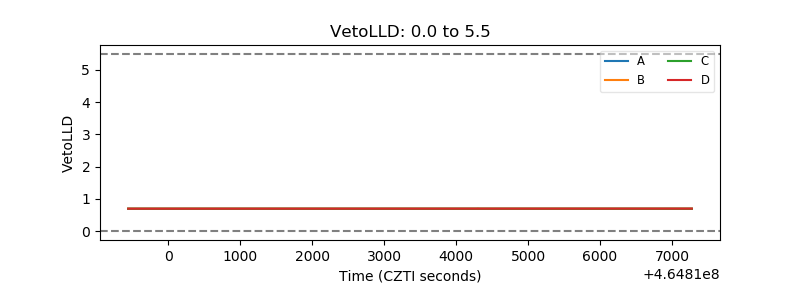 |
| Alpha Counter | 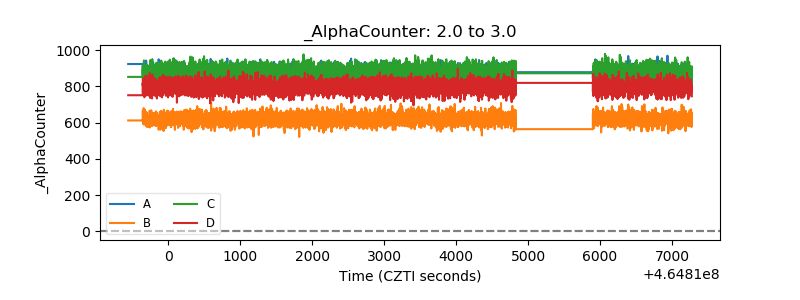 |
| _CPM_Rate | 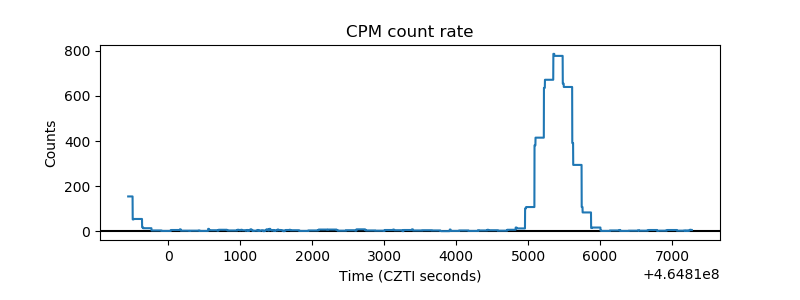 |
| CZT Counter | 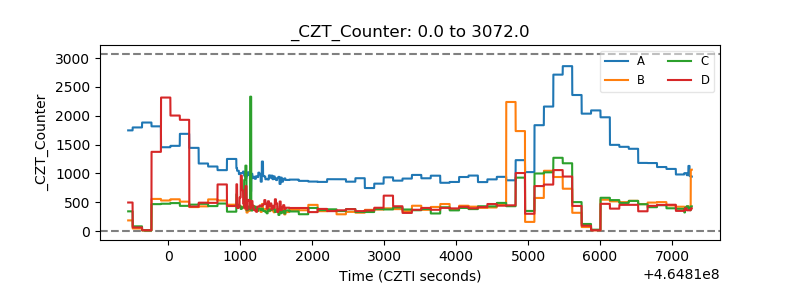 |
| +2.5 Volts monitor | 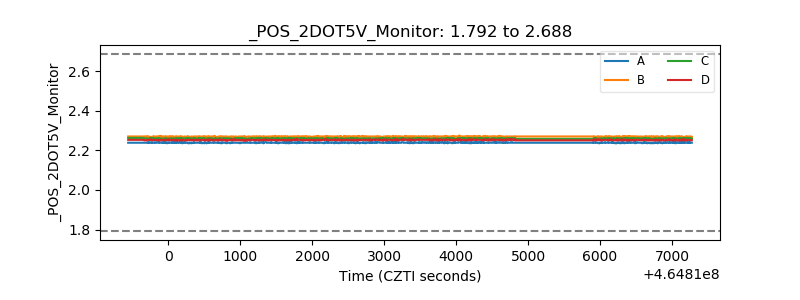 |
| +5 Volts monitor | 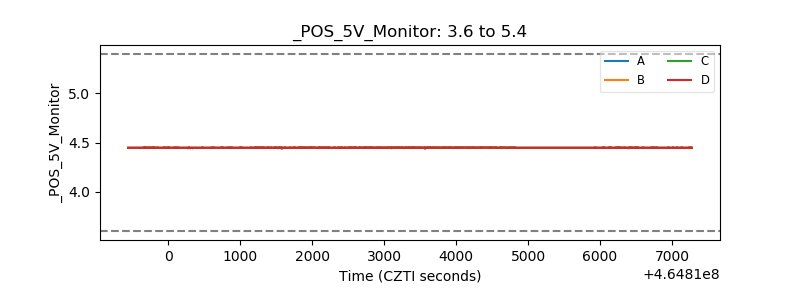 |
| _ROLL_ROT | 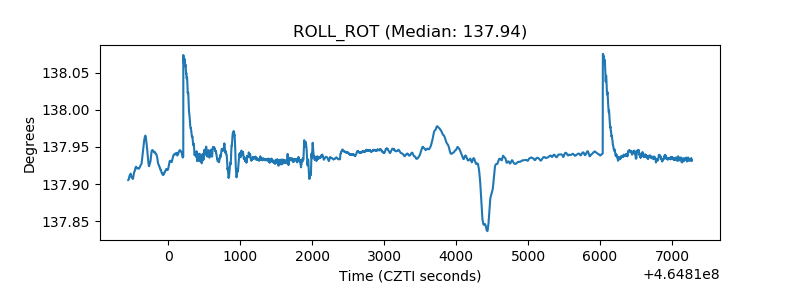 |
| _Roll_DEC | 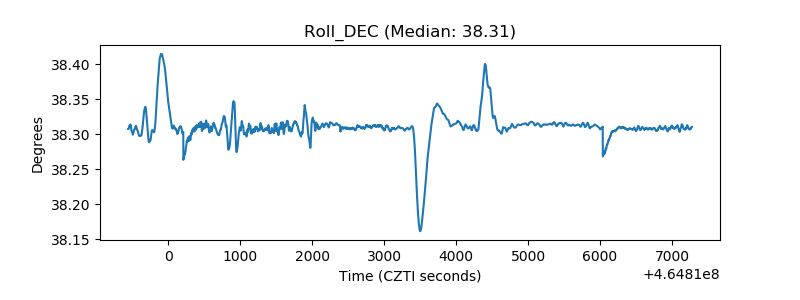 |
| _Roll_RA | 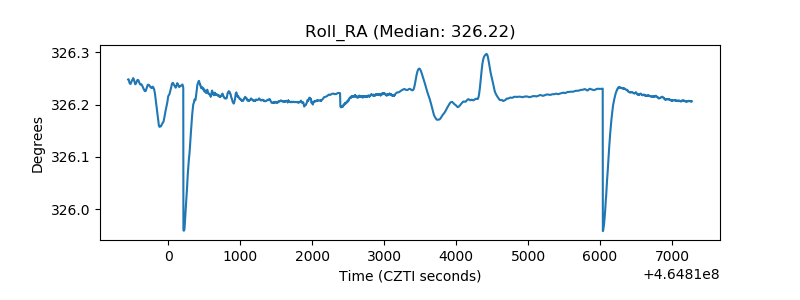 |
| Veto Counter | 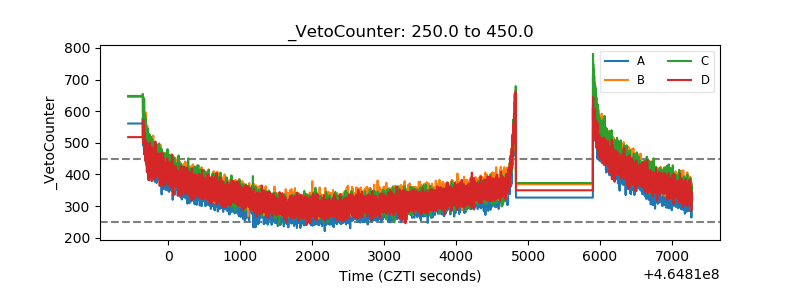 |