| Param | Original file | Final file |
|---|---|---|
| Filename | modeM0/AS1T05_233T01_9000006438cztM0_level2.fits | modeM0/AS1T05_233T01_9000006438cztM0_level2_quad_clean.evt |
| Size (bytes) | 2,110,772,160 | 2,310,647,040 |
| Size | 2.0 GB | 2.2 GB |
| Events in quadrant A | 6,517,796 | 1,827,697 |
| Events in quadrant B | 20,552,316 | 35,557,211 |
| Events in quadrant C | 583,638 | 22,077 |
| Events in quadrant D | 3,417,904 | 401,140 |
| Mode M9 | |||
|---|---|---|---|
| Quadrant | BADHDUFLAG | Total packets | Discarded packets |
| A | 0 | 553 | 0 |
| B | 0 | 553 | 0 |
| C | 0 | 553 | 0 |
| D | 0 | 553 | 0 |
| Mode SS | |||
|---|---|---|---|
| Quadrant | BADHDUFLAG | Total packets | Discarded packets |
| A | 0 | 9520 | 0 |
| B | 0 | 9518 | 0 |
| C | 0 | 9520 | 0 |
| D | 0 | 9520 | 0 |
| Mode M0 | |||
|---|---|---|---|
| Quadrant | BADHDUFLAG | Total packets | Discarded packets |
| A | 0 | 3680400 | 0 |
| B | 0 | 1462226 | 0 |
| C | 0 | 1862034 | 0 |
| D | 0 | 3696220 | 0 |
| Quadrant | Total seconds | Saturated seconds | Saturation percentage |
|---|---|---|---|
| A | 469322 | 451255 | 96.150404% |
| B | 469371 | 51866 | 11.050107% |
| C | 469367 | 468651 | 99.847454% |
| D | 469299 | 461509 | 98.340077% |
Noise dominated data is calculated using 1-second bins in cleaned event files. If a bin has >2000 counts, and if more than 50% of those come from <1% of pixels, then it is considered to be noise-dominated and hence unusable.
| Quadrant | # 1 sec bins | Bins with >0 counts | Bins with >2000 counts | High rate bins dominated by noise | Noise dominated (total time) | Noise dominated (detector-on time) | Marked lightcurve |
|---|---|---|---|---|---|---|---|
| A | 763513 | 390426 | 0 | 0 | 0.00% | 0.00% | 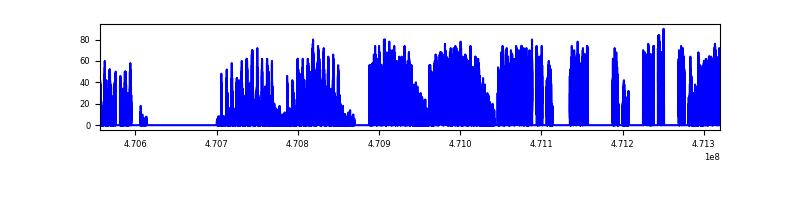 |
| B | 763512 | 468640 | 0 | 0 | 0.00% | 0.00% | 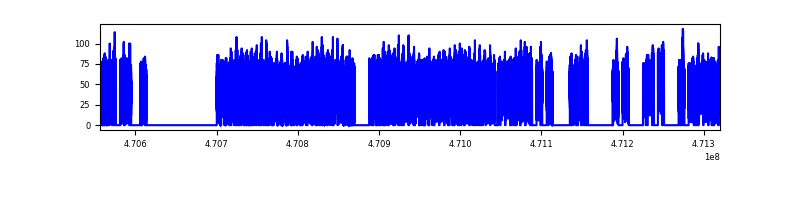 |
| C | 763504 | 103826 | 0 | 0 | 0.00% | 0.00% | 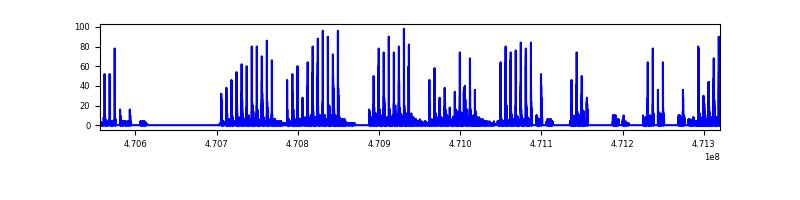 |
| D | 763511 | 358857 | 0 | 0 | 0.00% | 0.00% | 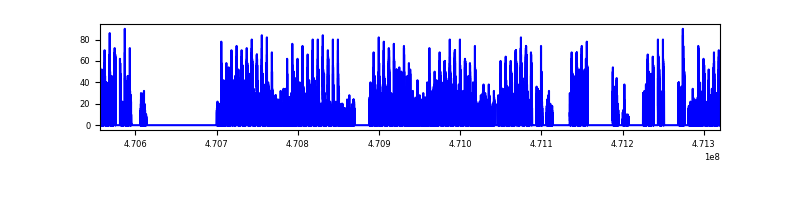 |
Top three noisy pixels from each quadrant. If the there are fewer than three noisy pixels in the level2.evt file, extra rows are filled as -1
| Pixel properties | Quadrant properties | ||||||
|---|---|---|---|---|---|---|---|
| Quadrant | DetID | PixID | Counts | Sigma | Mean | Median | Sigma |
| A | 14 | 188 | 6895 | 9.68 | 1790 | 1665 | 540.4 |
| A | 9 | 255 | 6829 | 9.56 | 1790 | 1665 | 540.4 |
| A | 9 | 19 | 5785 | 7.62 | 1790 | 1665 | 540.4 |
| B | 2 | 9 | 21843 | 13.43 | 5532 | 5253 | 1235.1 |
| B | 2 | 8 | 19696 | 11.69 | 5532 | 5253 | 1235.1 |
| B | 2 | 245 | 17356 | 9.8 | 5532 | 5253 | 1235.1 |
| C | 3 | 158 | 476 | 6.07 | 162 | 148 | 54.0 |
| C | 7 | 245 | 469 | 5.94 | 162 | 148 | 54.0 |
| C | 7 | 111 | 466 | 5.89 | 162 | 148 | 54.0 |
| D | 6 | 218 | 4728 | 11.59 | 1022 | 903 | 329.9 |
| D | 3 | 30 | 3753 | 8.64 | 1022 | 903 | 329.9 |
| D | 3 | 31 | 3186 | 6.92 | 1022 | 903 | 329.9 |
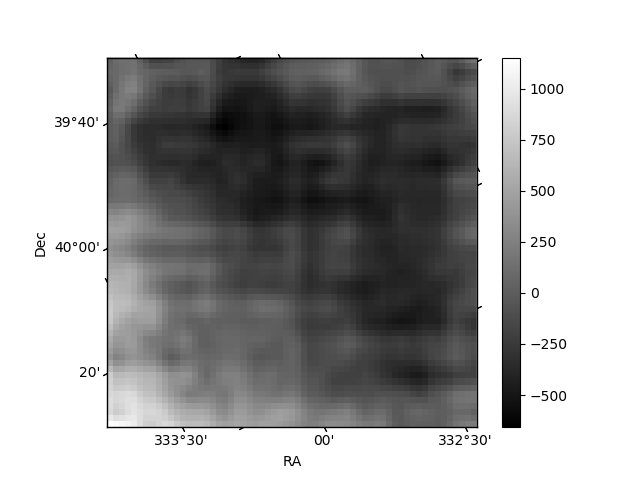
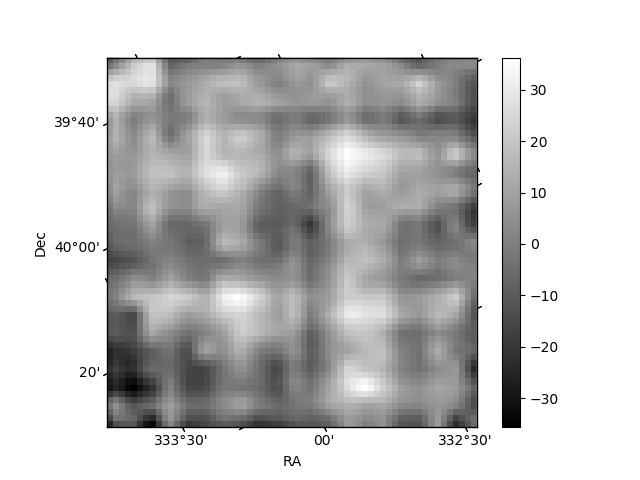
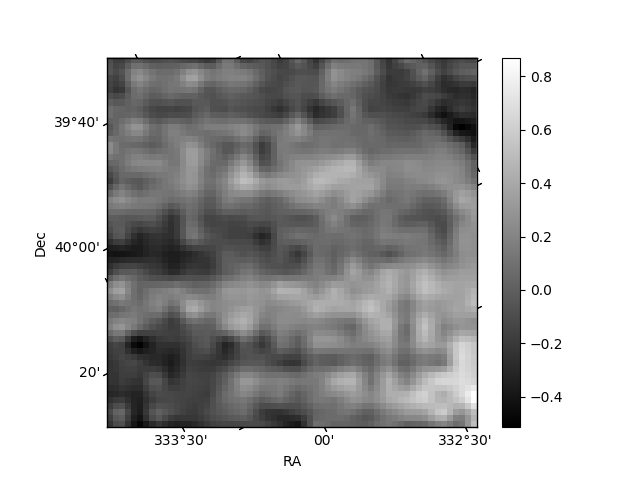
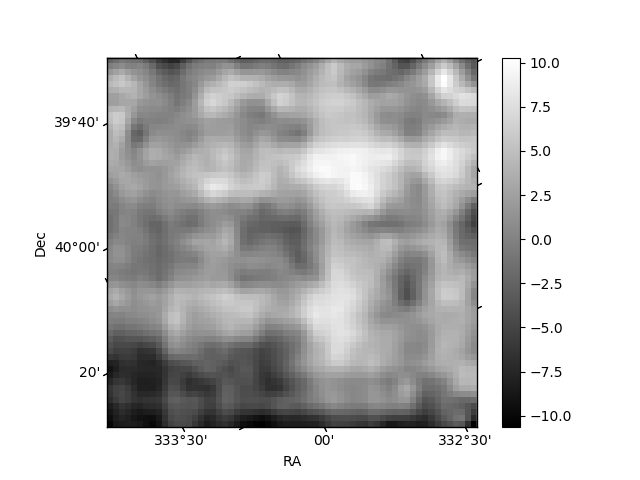
Histogram calculated using DETX and DETY for each event in the final _common_clean file
| Quadrant A | 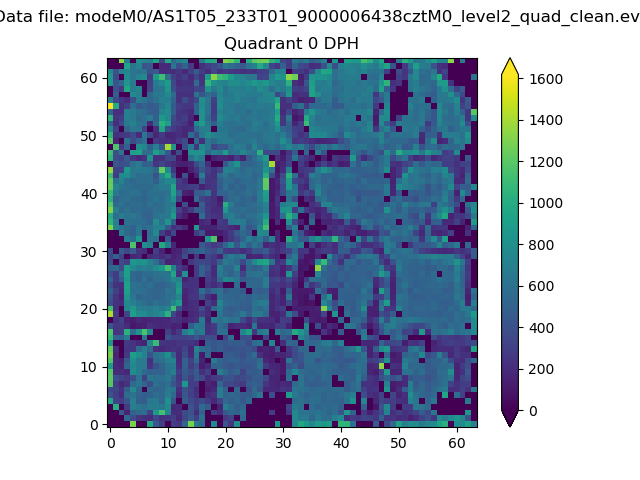 |
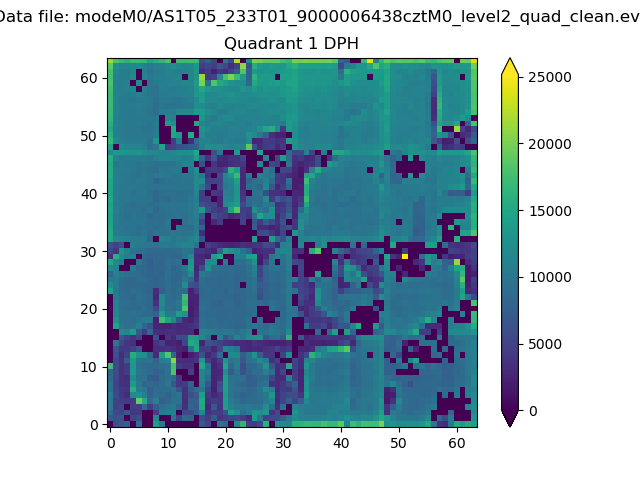 |
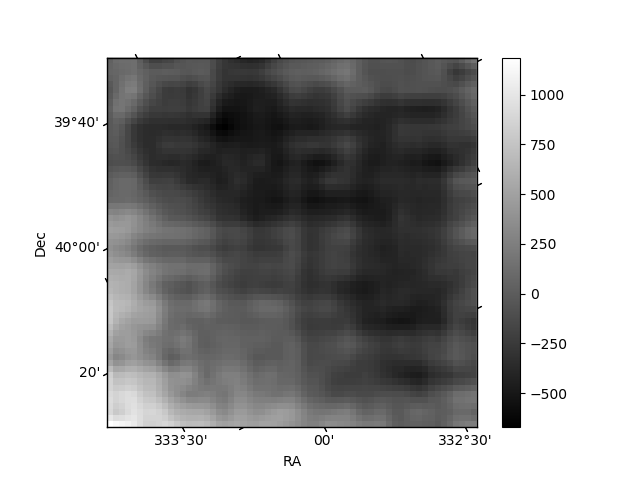
Quadrant B |
|---|---|---|---|
| Quadrant D | 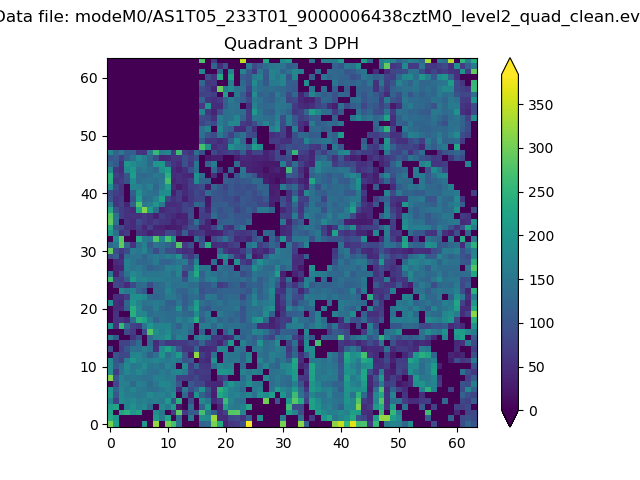 |
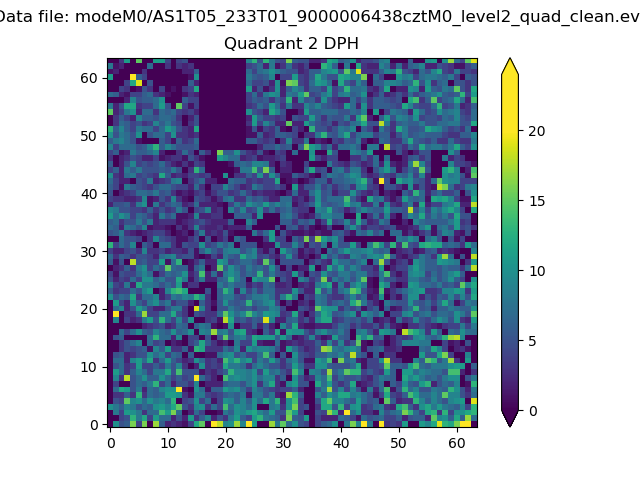 |
Quadrant C |
| Plot type | Count rate plots | Images |
|---|---|---|
| Comparison with Poisson distribution Blue bars denote a histogram of data divided into 1 sec bins. Red curve is a Poisson curve with rate = median count rate of data. |
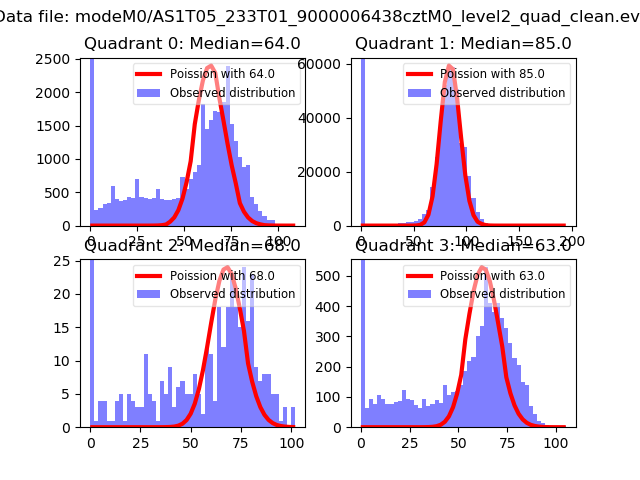 |
 |
| Quadrant-wise count rates Data is divided into 100 sec bins |
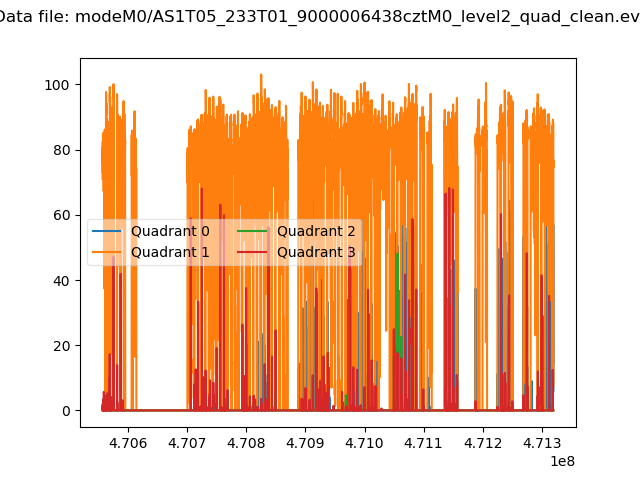 |
|
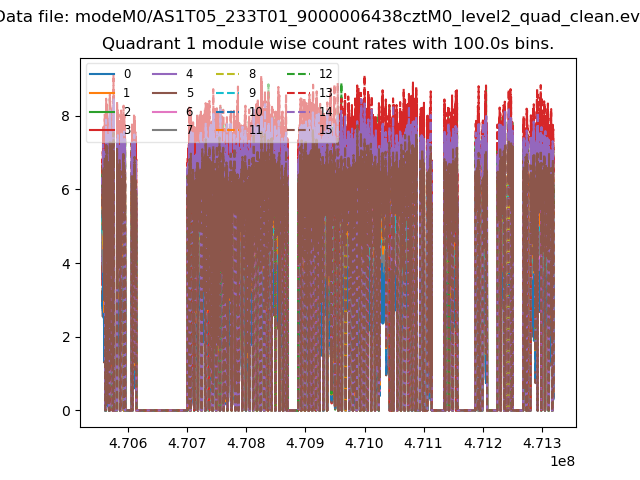
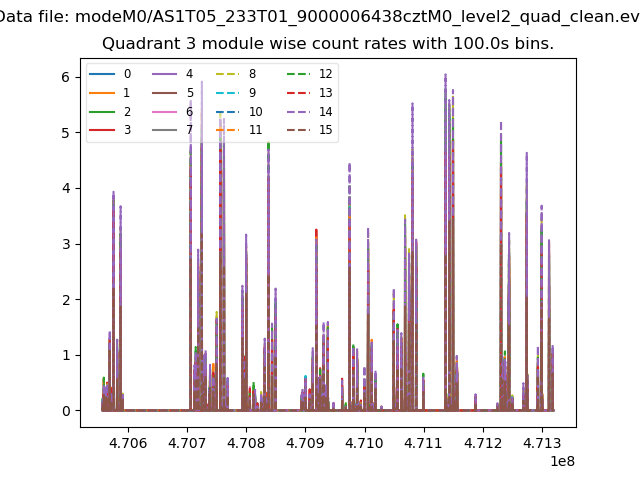
| Module-wise count rates for Quadrant A Data is divided into 100 sec bins |
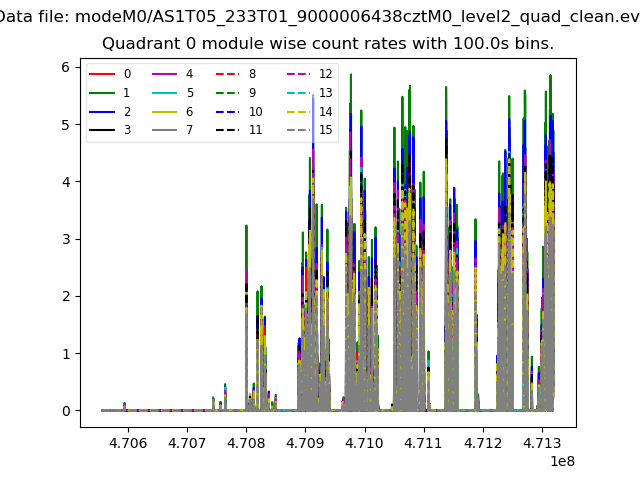 |
 |
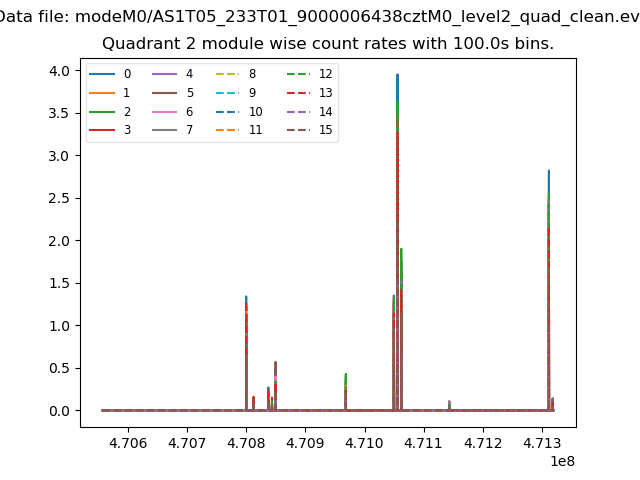
| Module-wise count rates for Quadrant B Data is divided into 100 sec bins |
 |
 |
| Module-wise count rates for Quadrant C Data is divided into 100 sec bins |
 |
 |
| Module-wise count rates for Quadrant D Data is divided into 100 sec bins |
 |
 |
| Parameter | Plot |
|---|---|
| CZT HV Monitor | 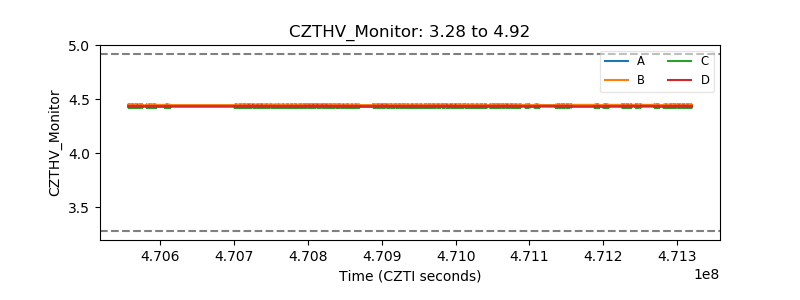 |
| D_VDD | 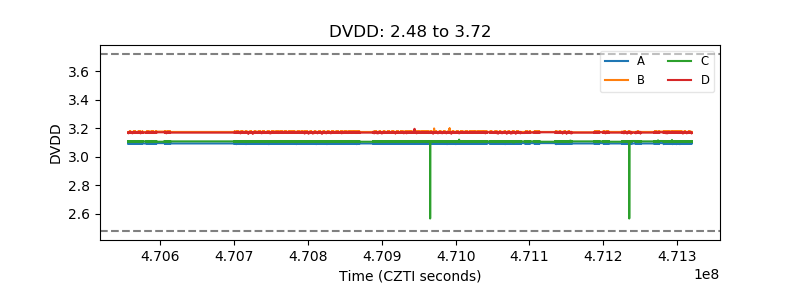 |
| Temperature 1 | 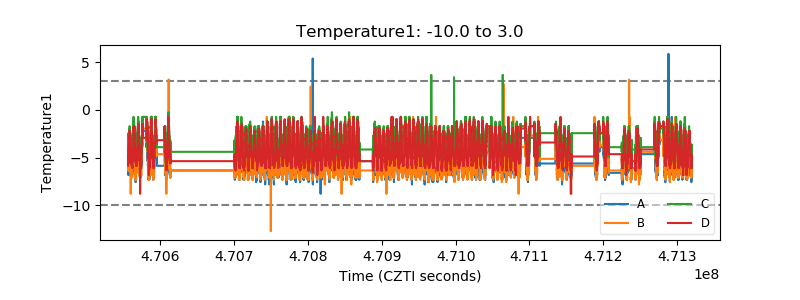 |
| Veto HV Monitor | 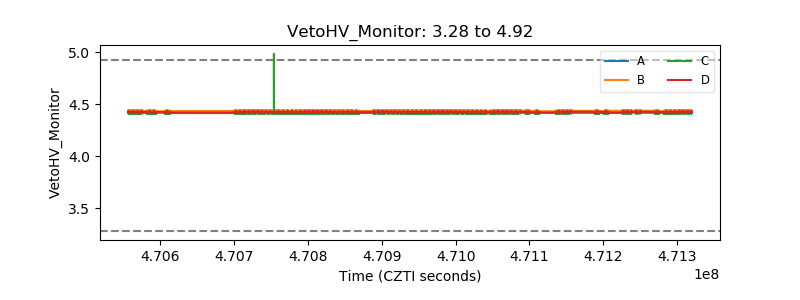 |
| Veto LLD | 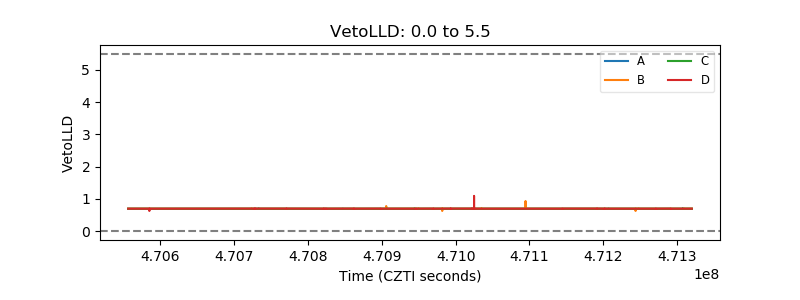 |
| Alpha Counter | 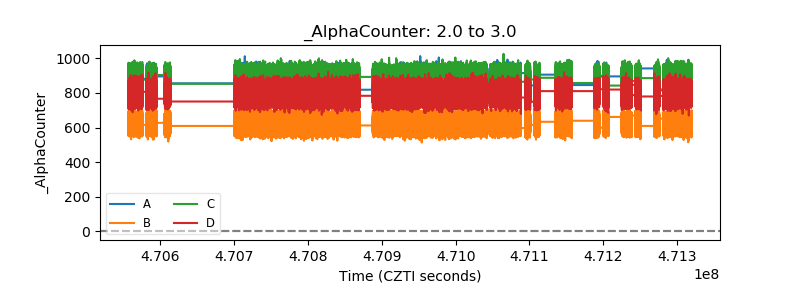 |
| _CPM_Rate | 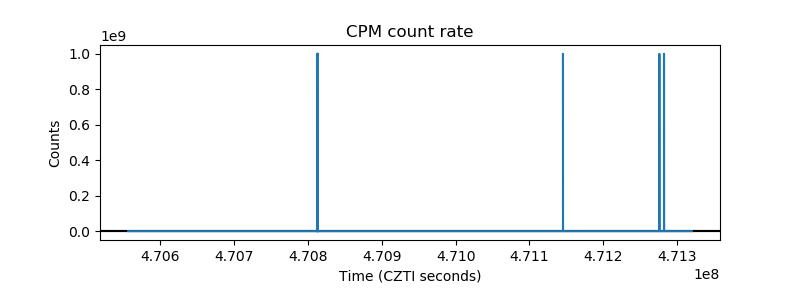 |
| CZT Counter | 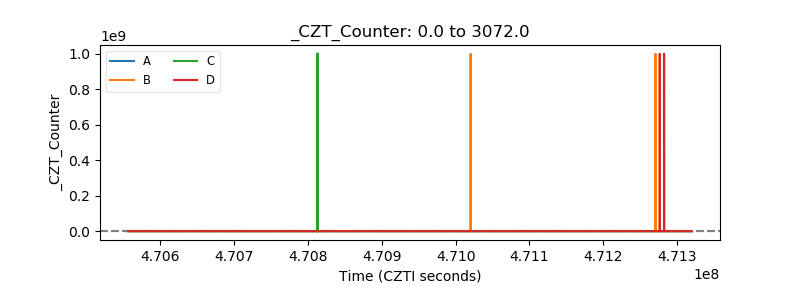 |
| +2.5 Volts monitor | 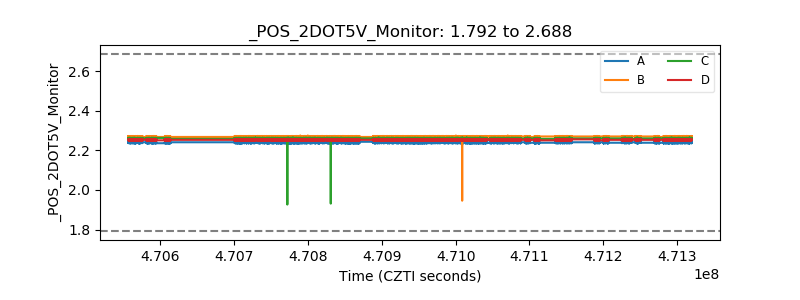 |
| +5 Volts monitor | 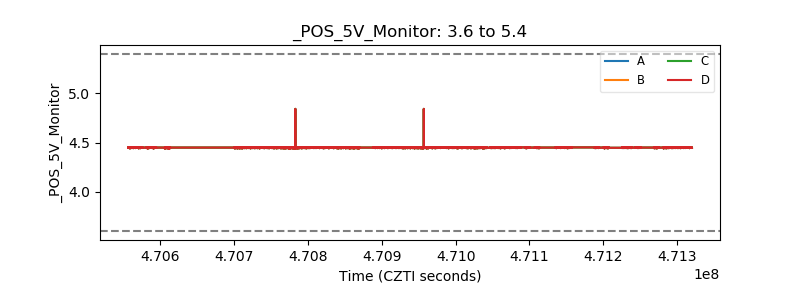 |
| _ROLL_ROT | 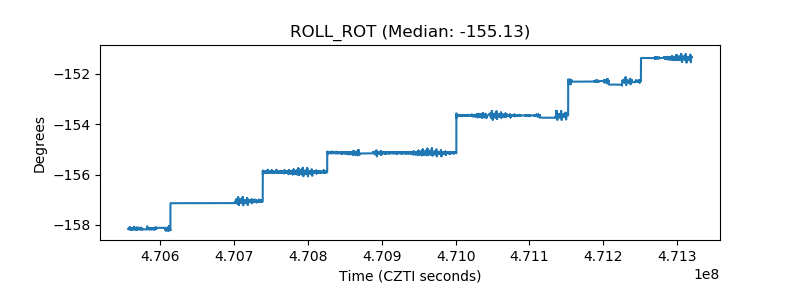 |
| _Roll_DEC | 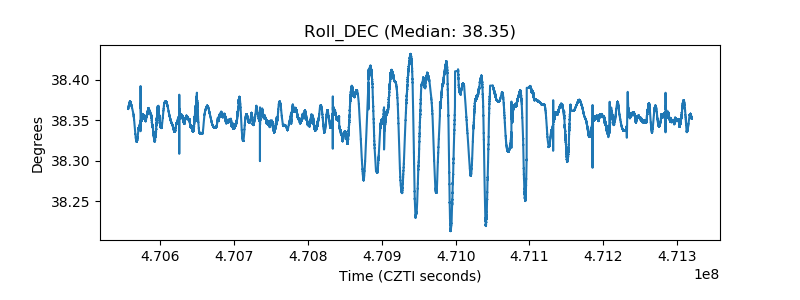 |
| _Roll_RA | 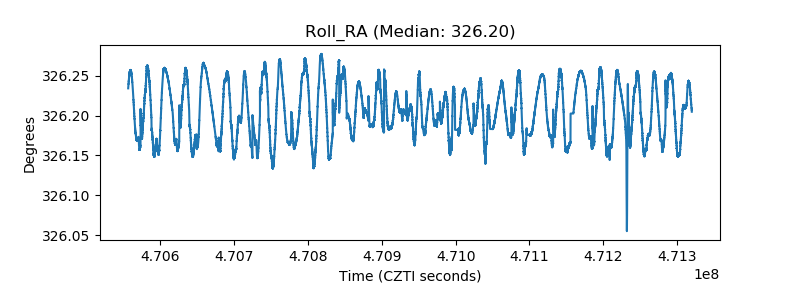 |
| Veto Counter | 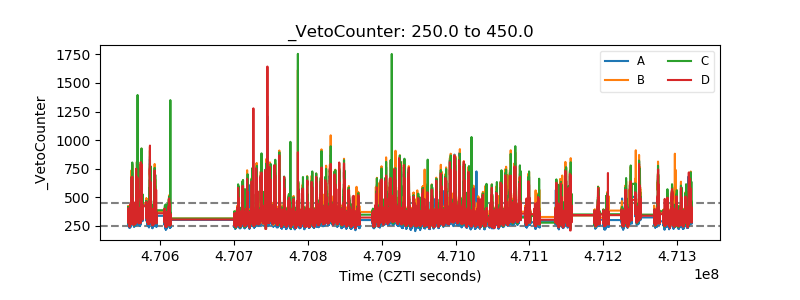 |