| Param | Original file | Final file |
|---|---|---|
| Filename | modeM0/AS1T05_233T01_9000006438_49605cztM0_level2.fits | modeM0/AS1T05_233T01_9000006438_49605cztM0_level2_quad_clean.evt |
| Size (bytes) | 1,106,383,680 | 41,641,920 |
| Size | 1.0 GB | 39.7 MB |
| Events in quadrant A | 14,718,763 | 93,068 |
| Events in quadrant B | 6,273,106 | 573,269 |
| Events in quadrant C | 4,045,078 | 3,187 |
| Events in quadrant D | 15,452,407 | 163,982 |
| Mode M9 | |||
|---|---|---|---|
| Quadrant | BADHDUFLAG | Total packets | Discarded packets |
| A | 0 | 10 | 0 |
| B | 0 | 10 | 0 |
| C | 0 | 10 | 0 |
| D | 0 | 10 | 0 |
| Mode SS | |||
|---|---|---|---|
| Quadrant | BADHDUFLAG | Total packets | Discarded packets |
| A | 0 | 122 | 0 |
| B | 0 | 122 | 0 |
| C | 0 | 122 | 0 |
| D | 0 | 122 | 0 |
| Mode M0 | |||
|---|---|---|---|
| Quadrant | BADHDUFLAG | Total packets | Discarded packets |
| A | 0 | 47826 | 1 |
| B | 0 | 22728 | 1 |
| C | 0 | 16376 | 1 |
| D | 0 | 49964 | 1 |
| Quadrant | Total seconds | Saturated seconds | Saturation percentage |
|---|---|---|---|
| A | 5988 | 5988 | 100.000000% |
| B | 5988 | 1098 | 18.336673% |
| C | 5988 | 5988 | 100.000000% |
| D | 5988 | 5958 | 99.498998% |
Noise dominated data is calculated using 1-second bins in cleaned event files. If a bin has >2000 counts, and if more than 50% of those come from <1% of pixels, then it is considered to be noise-dominated and hence unusable.
| Quadrant | # 1 sec bins | Bins with >0 counts | Bins with >2000 counts | High rate bins dominated by noise | Noise dominated (total time) | Noise dominated (detector-on time) | Marked lightcurve |
|---|---|---|---|---|---|---|---|
| A | 6993 | 5990 | 5492 | 5492 | 78.54% | 91.69% | 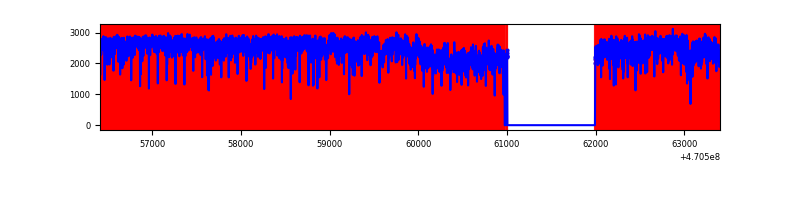 |
| B | 6993 | 5988 | 899 | 899 | 12.86% | 15.01% | 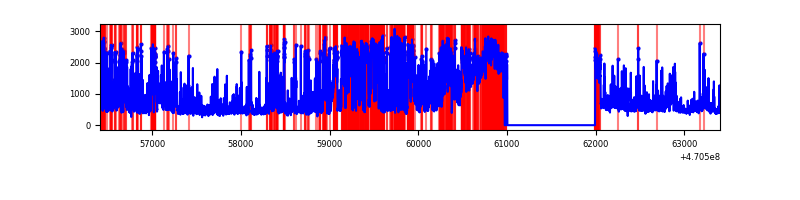 |
| C | 6992 | 5988 | 193 | 193 | 2.76% | 3.22% | 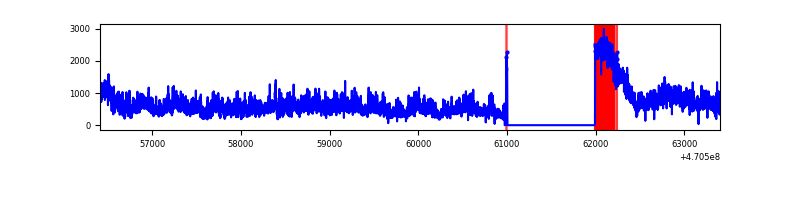 |
| D | 6993 | 5990 | 5721 | 5721 | 81.81% | 95.51% | 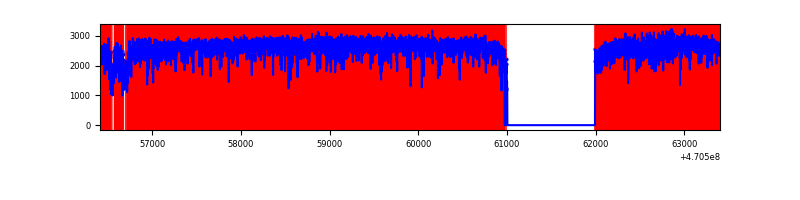 |
Top three noisy pixels from each quadrant. If the there are fewer than three noisy pixels in the level2.evt file, extra rows are filled as -1
| Pixel properties | Quadrant properties | ||||||
|---|---|---|---|---|---|---|---|
| Quadrant | DetID | PixID | Counts | Sigma | Mean | Median | Sigma |
| A | 0 | 99 | 7799848 | 136169.63 | 125 | 116 | 57.3 |
| A | 10 | 83 | 1840023 | 32121.55 | 125 | 116 | 57.3 |
| A | 4 | 60 | 1015558 | 17727.83 | 125 | 116 | 57.3 |
| B | 5 | 172 | 1218375 | 9594.16 | 589 | 570 | 126.9 |
| B | 4 | 206 | 1014055 | 7984.48 | 589 | 570 | 126.9 |
| B | 6 | 255 | 667362 | 5253.15 | 589 | 570 | 126.9 |
| C | 15 | 181 | 1192289 | 94083.84 | 15 | 13 | 12.7 |
| C | 15 | 180 | 889486 | 70189.32 | 15 | 13 | 12.7 |
| C | 15 | 235 | 230702 | 18203.93 | 15 | 13 | 12.7 |
| D | 15 | 40 | 4570328 | 38428.28 | 224 | 205 | 118.9 |
| D | 15 | 184 | 1372334 | 11537.67 | 224 | 205 | 118.9 |
| D | 12 | 6 | 1285906 | 10810.93 | 224 | 205 | 118.9 |
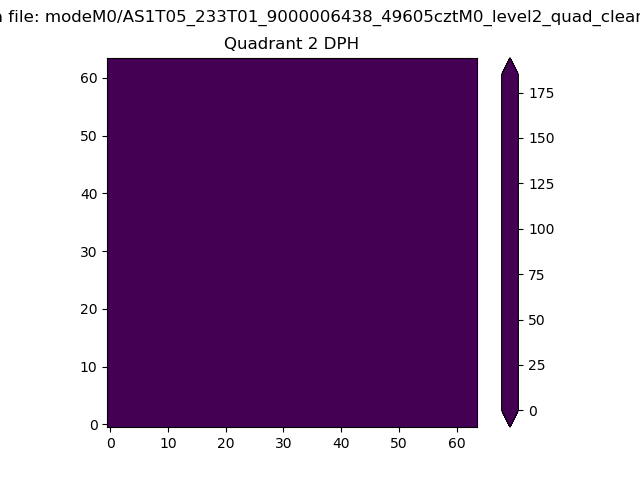
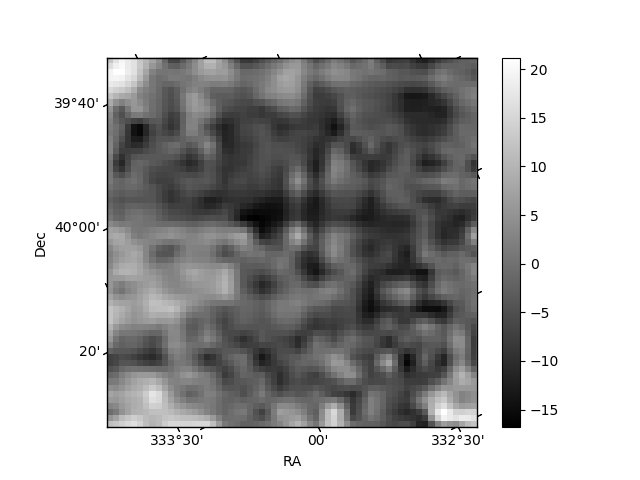
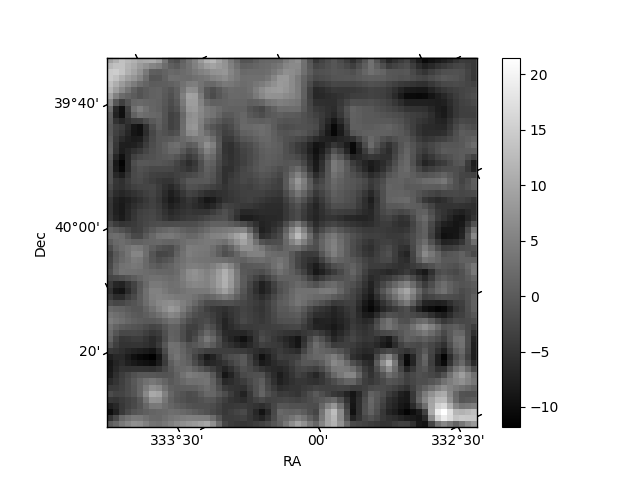
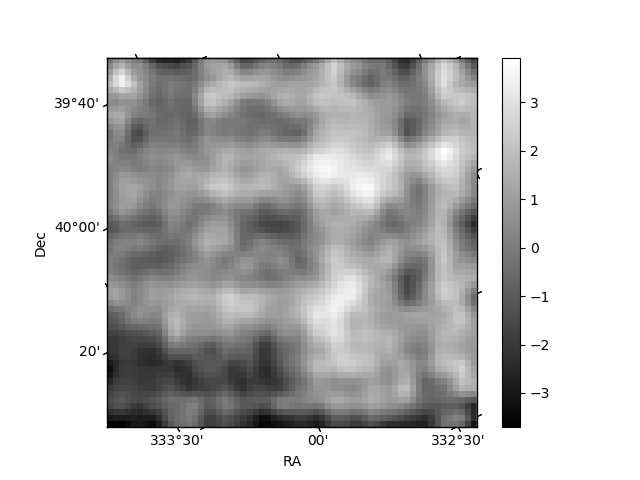
Histogram calculated using DETX and DETY for each event in the final _common_clean file
| Quadrant A | 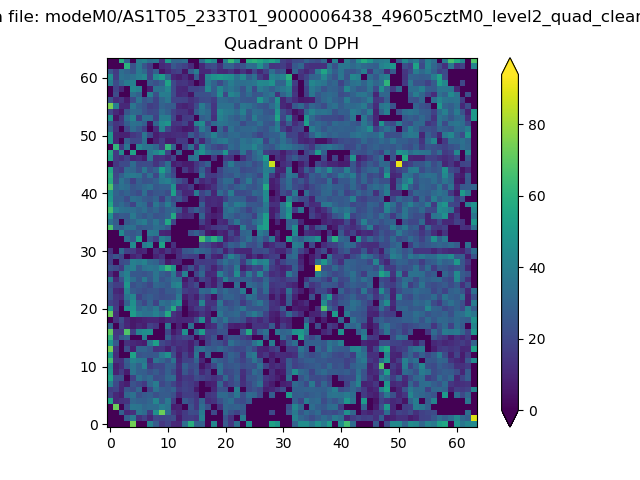 |
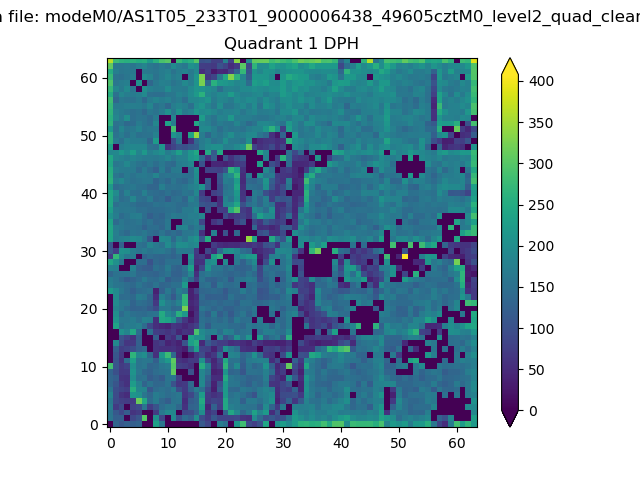 |
Quadrant B |
|---|---|---|---|
| Quadrant D | 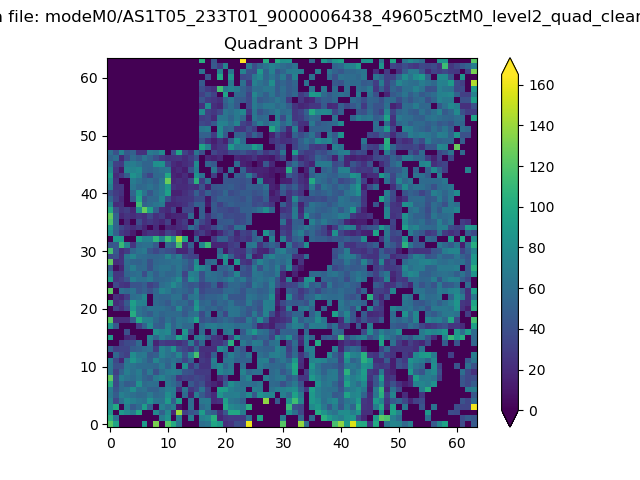 |
 |
Quadrant C |
| Plot type | Count rate plots | Images |
|---|---|---|
| Comparison with Poisson distribution Blue bars denote a histogram of data divided into 1 sec bins. Red curve is a Poisson curve with rate = median count rate of data. |
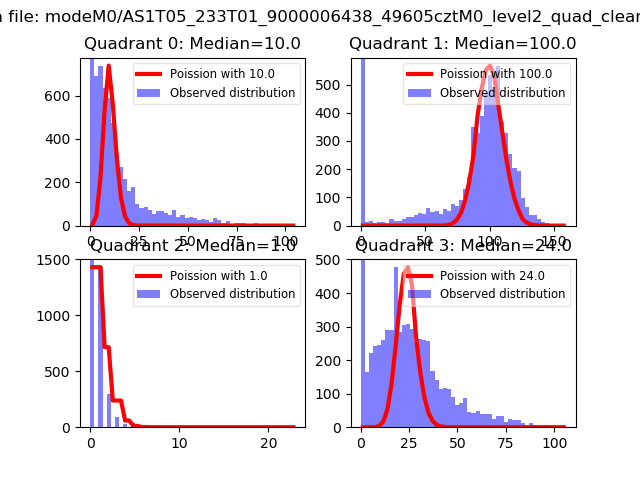 |
 |
| Quadrant-wise count rates Data is divided into 100 sec bins |
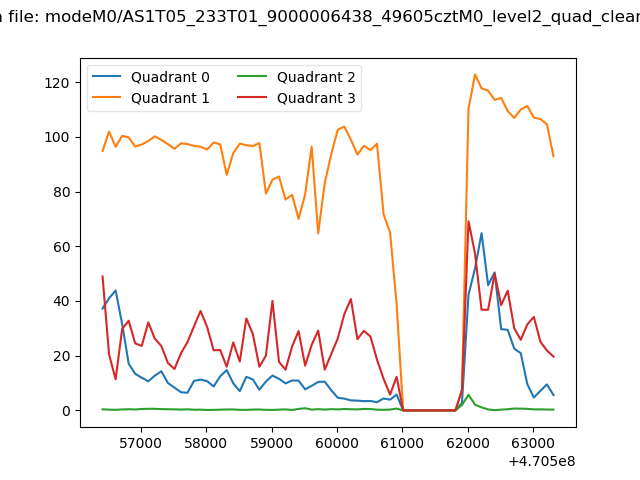 |
|
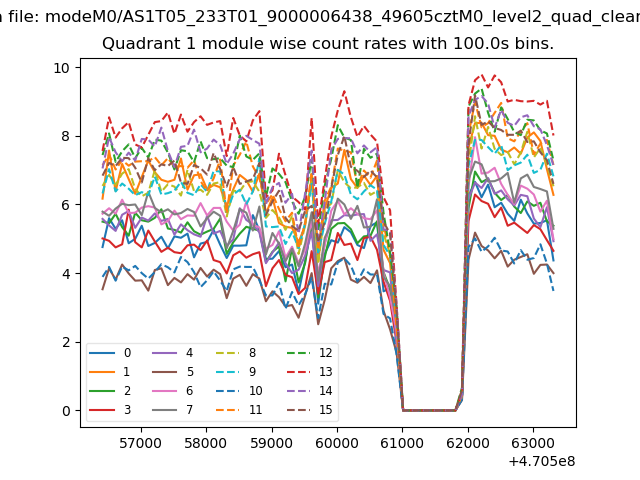
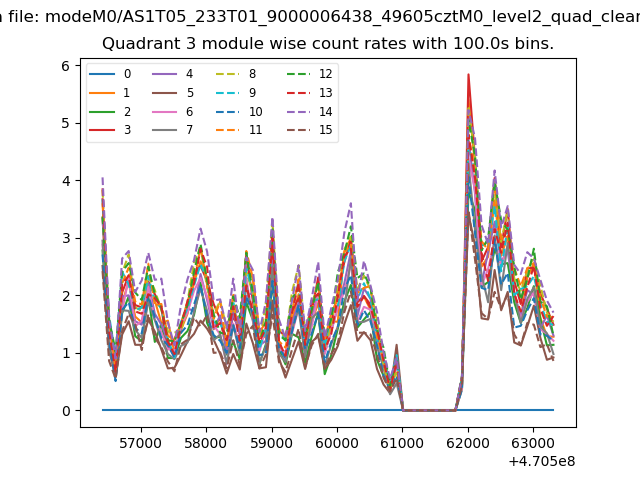
| Module-wise count rates for Quadrant A Data is divided into 100 sec bins |
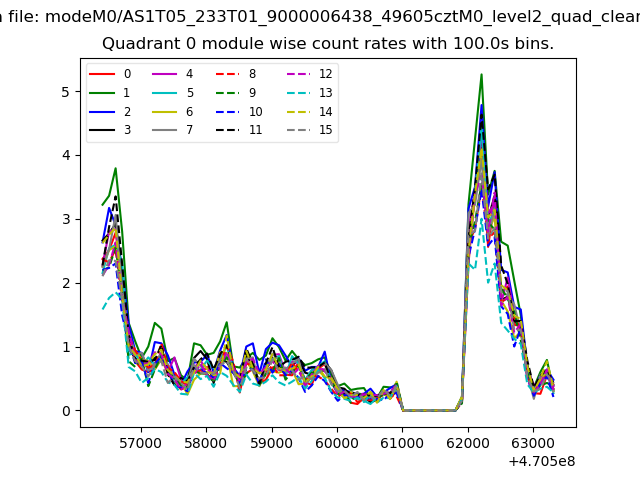 |
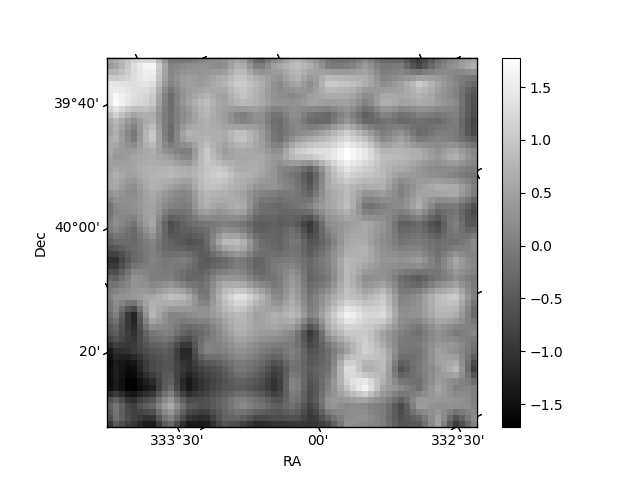 |
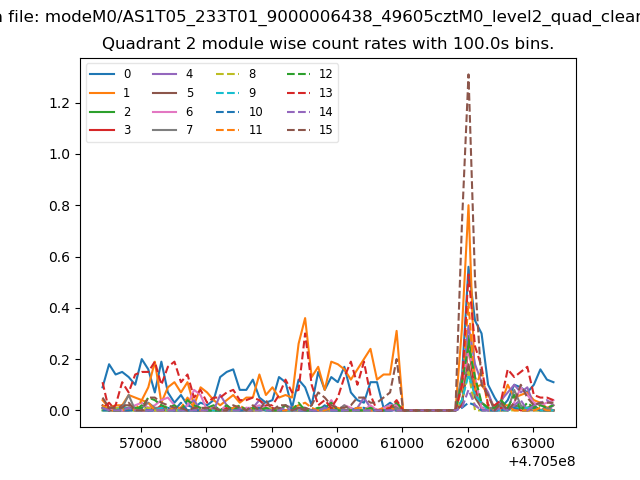
| Module-wise count rates for Quadrant B Data is divided into 100 sec bins |
 |
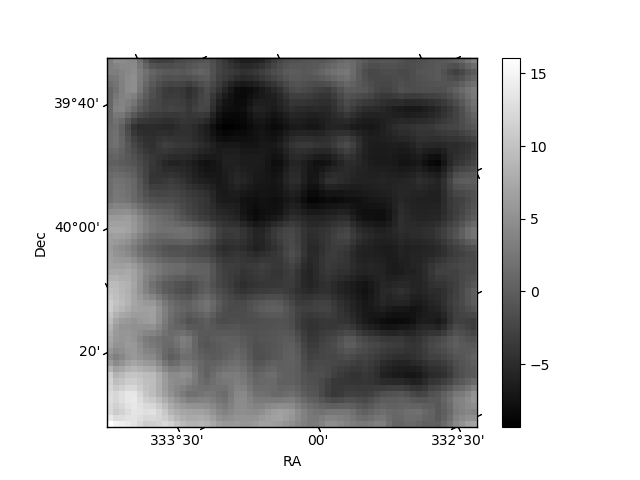 |
| Module-wise count rates for Quadrant C Data is divided into 100 sec bins |
 |
 |
| Module-wise count rates for Quadrant D Data is divided into 100 sec bins |
 |
 |
| Parameter | Plot |
|---|---|
| CZT HV Monitor |  |
| D_VDD | 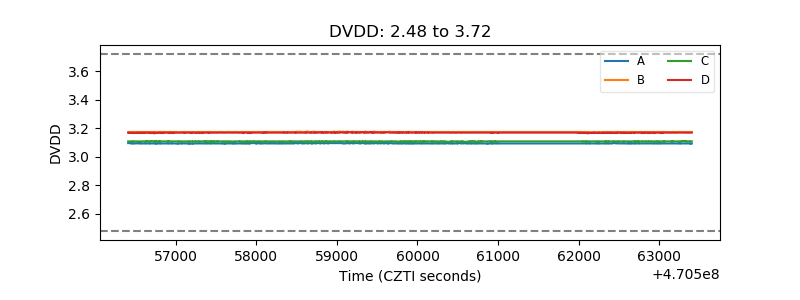 |
| Temperature 1 | 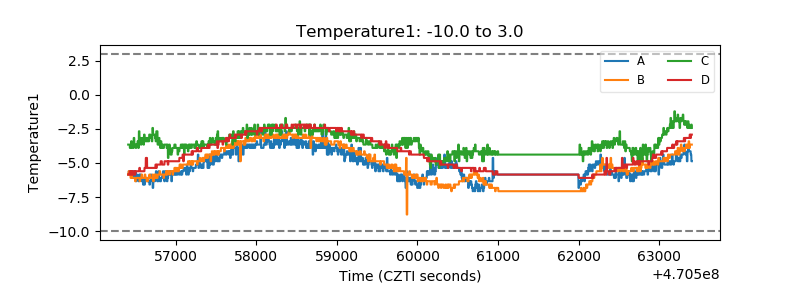 |
| Veto HV Monitor | 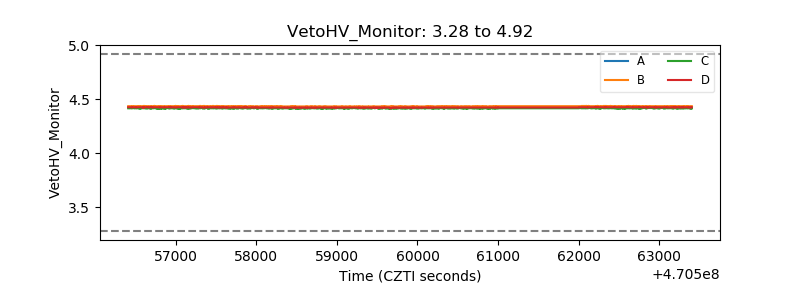 |
| Veto LLD | 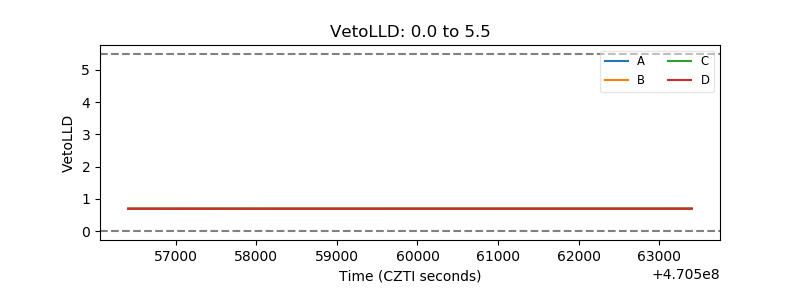 |
| Alpha Counter | 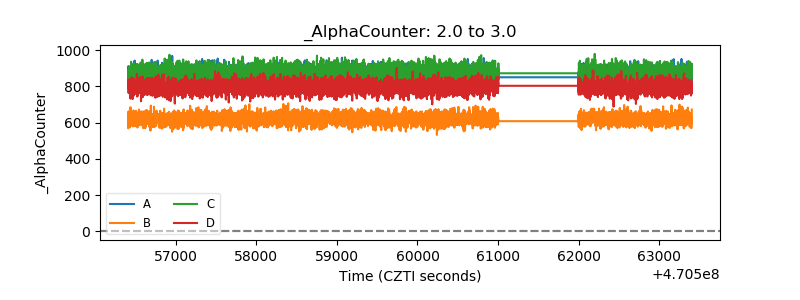 |
| _CPM_Rate | 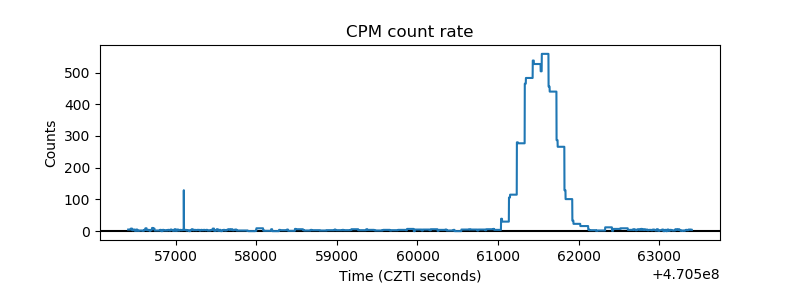 |
| CZT Counter | 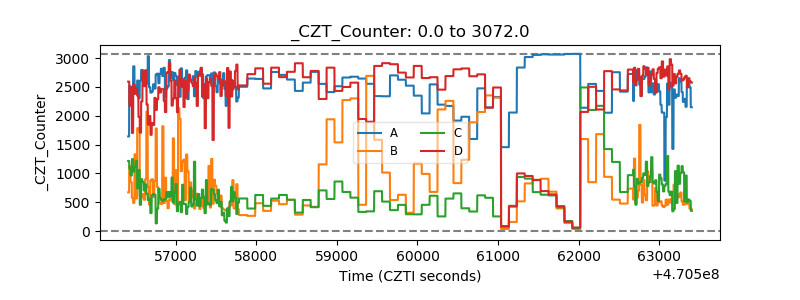 |
| +2.5 Volts monitor | 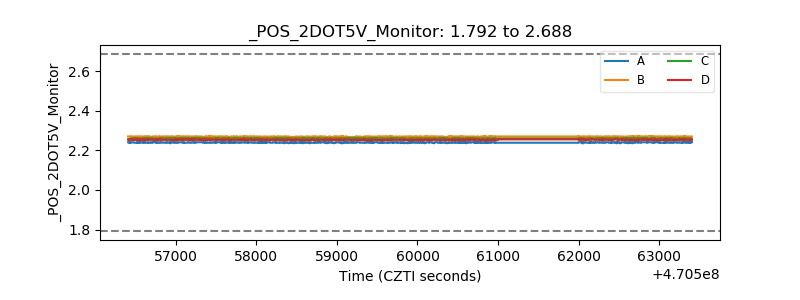 |
| +5 Volts monitor | 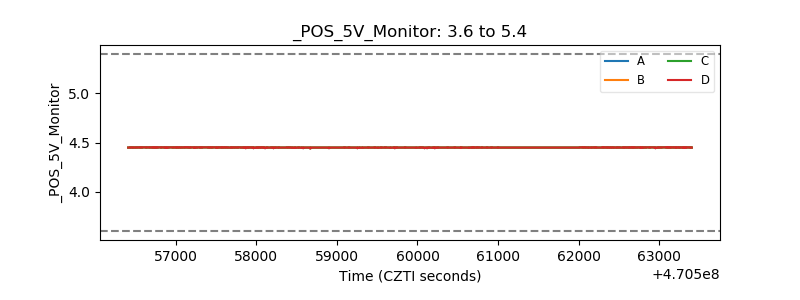 |
| _ROLL_ROT | 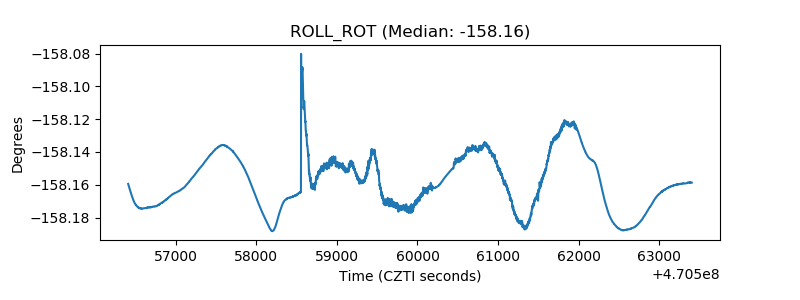 |
| _Roll_DEC | 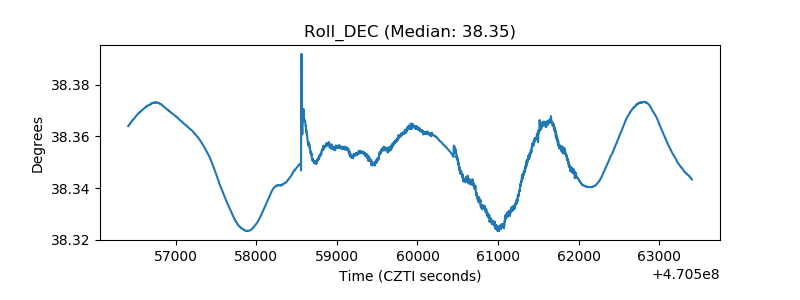 |
| _Roll_RA | 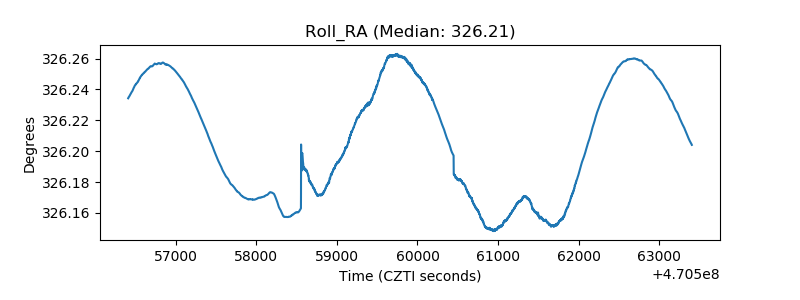 |
| Veto Counter | 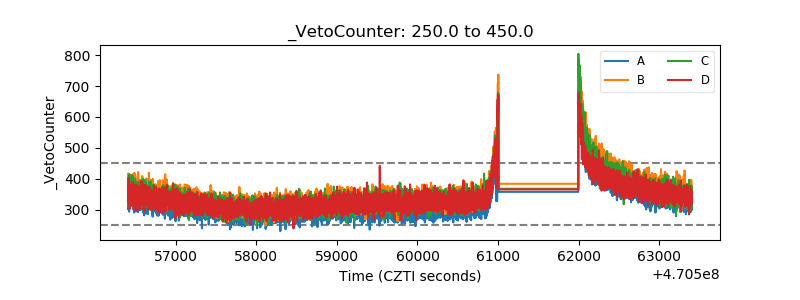 |