| Param | Original file | Final file |
|---|---|---|
| Filename | modeM0/AS1T05_233T01_9000006438_49607cztM0_level2.fits | modeM0/AS1T05_233T01_9000006438_49607cztM0_level2_quad_clean.evt |
| Size (bytes) | 1,191,124,800 | 51,491,520 |
| Size | 1.1 GB | 49.1 MB |
| Events in quadrant A | 17,054,534 | 184,253 |
| Events in quadrant B | 5,649,138 | 694,017 |
| Events in quadrant C | 4,667,011 | 5,573 |
| Events in quadrant D | 16,213,847 | 209,829 |
| Mode M9 | |||
|---|---|---|---|
| Quadrant | BADHDUFLAG | Total packets | Discarded packets |
| A | 0 | 10 | 0 |
| B | 0 | 10 | 0 |
| C | 0 | 10 | 0 |
| D | 0 | 10 | 0 |
| Mode SS | |||
|---|---|---|---|
| Quadrant | BADHDUFLAG | Total packets | Discarded packets |
| A | 0 | 134 | 0 |
| B | 0 | 134 | 0 |
| C | 0 | 134 | 0 |
| D | 0 | 134 | 0 |
| Mode M0 | |||
|---|---|---|---|
| Quadrant | BADHDUFLAG | Total packets | Discarded packets |
| A | 0 | 55182 | 1 |
| B | 0 | 21107 | 1 |
| C | 0 | 18639 | 1 |
| D | 0 | 52646 | 7 |
| Quadrant | Total seconds | Saturated seconds | Saturation percentage |
|---|---|---|---|
| A | 6532 | 6532 | 100.000000% |
| B | 6532 | 761 | 11.650337% |
| C | 6533 | 6533 | 100.000000% |
| D | 6532 | 6067 | 92.881200% |
Noise dominated data is calculated using 1-second bins in cleaned event files. If a bin has >2000 counts, and if more than 50% of those come from <1% of pixels, then it is considered to be noise-dominated and hence unusable.
| Quadrant | # 1 sec bins | Bins with >0 counts | Bins with >2000 counts | High rate bins dominated by noise | Noise dominated (total time) | Noise dominated (detector-on time) | Marked lightcurve |
|---|---|---|---|---|---|---|---|
| A | 7612 | 6533 | 6342 | 6342 | 83.32% | 97.08% | 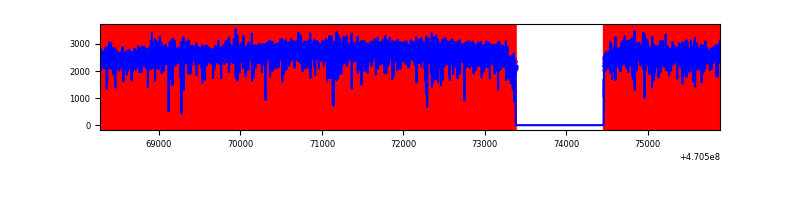 |
| B | 7612 | 6532 | 495 | 495 | 6.50% | 7.58% | 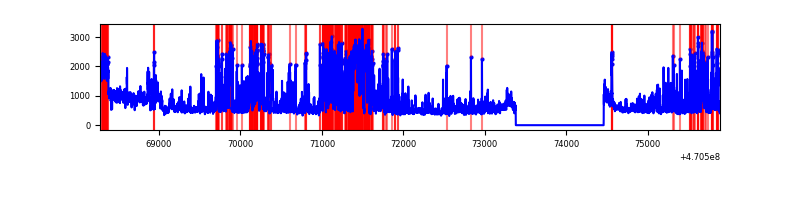 |
| C | 7612 | 6531 | 218 | 218 | 2.86% | 3.34% | 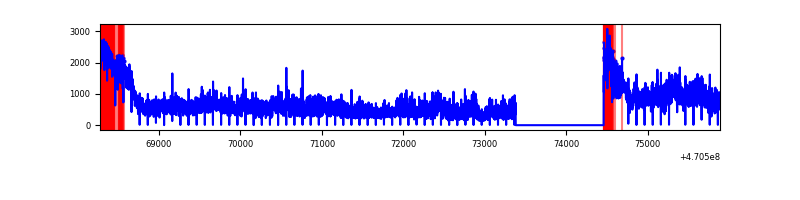 |
| D | 7612 | 6532 | 5779 | 5779 | 75.92% | 88.47% | 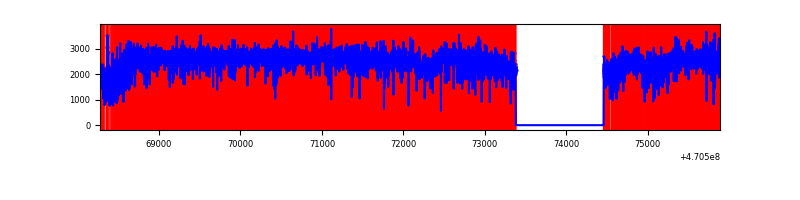 |
Top three noisy pixels from each quadrant. If the there are fewer than three noisy pixels in the level2.evt file, extra rows are filled as -1
| Pixel properties | Quadrant properties | ||||||
|---|---|---|---|---|---|---|---|
| Quadrant | DetID | PixID | Counts | Sigma | Mean | Median | Sigma |
| A | 0 | 99 | 4212455 | 38742.78 | 230 | 214 | 108.7 |
| A | 10 | 83 | 3304073 | 30387.78 | 230 | 214 | 108.7 |
| A | 0 | 98 | 2080877 | 19137.24 | 230 | 214 | 108.7 |
| B | 4 | 206 | 722903 | 4842.71 | 702 | 682 | 149.1 |
| B | 5 | 172 | 607321 | 4067.7 | 702 | 682 | 149.1 |
| B | 3 | 232 | 377723 | 2528.18 | 702 | 682 | 149.1 |
| C | 15 | 181 | 2091055 | 104290.3 | 25 | 23 | 20.1 |
| C | 15 | 180 | 679998 | 33913.78 | 25 | 23 | 20.1 |
| C | 15 | 190 | 251813 | 12558.04 | 25 | 23 | 20.1 |
| D | 15 | 40 | 3800564 | 32149.31 | 277 | 260 | 118.2 |
| D | 15 | 184 | 2644983 | 22373.48 | 277 | 260 | 118.2 |
| D | 15 | 74 | 1219926 | 10317.97 | 277 | 260 | 118.2 |
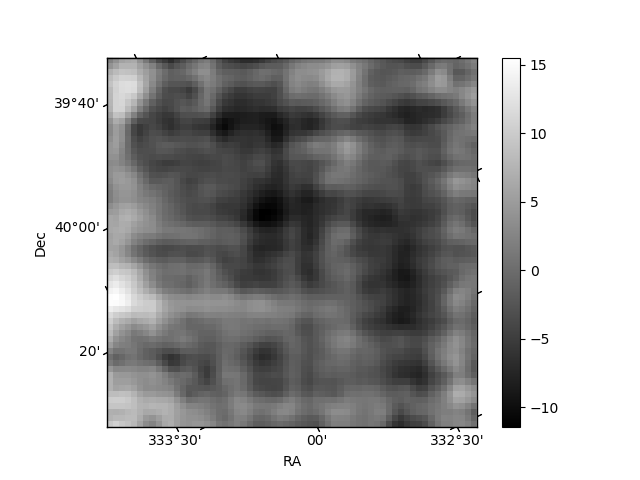
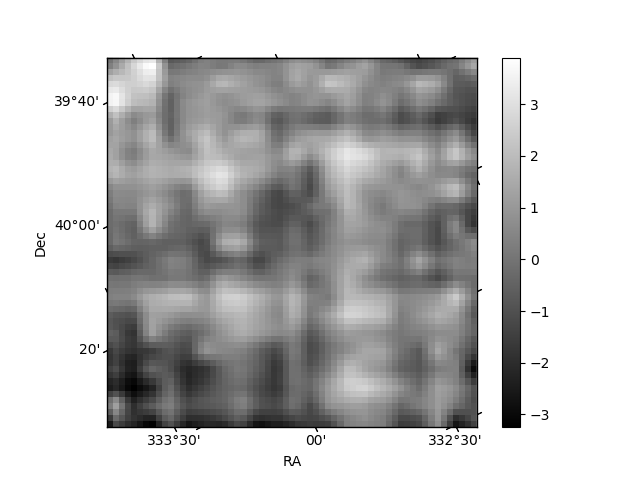
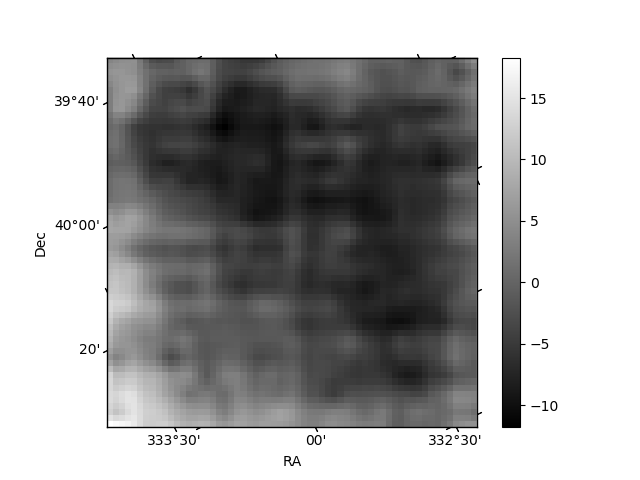
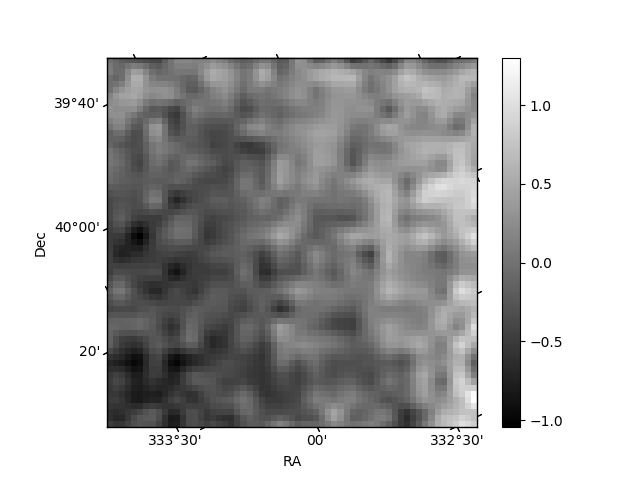
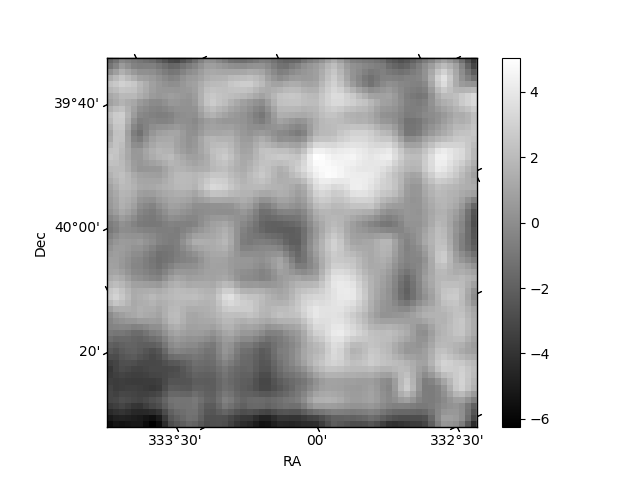
Histogram calculated using DETX and DETY for each event in the final _common_clean file
| Quadrant A | 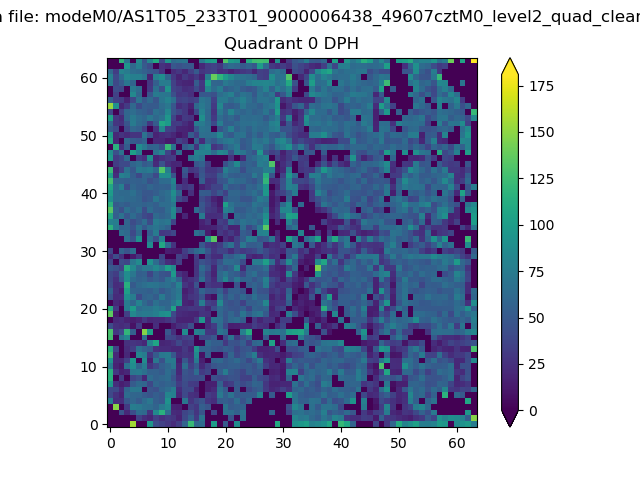 |
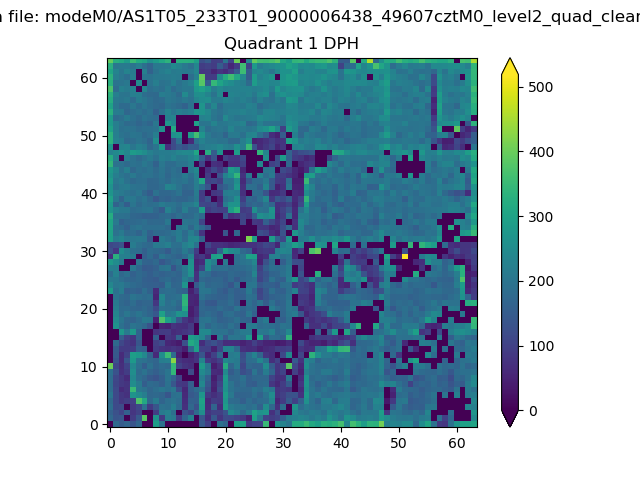 |
Quadrant B |
|---|---|---|---|
| Quadrant D | 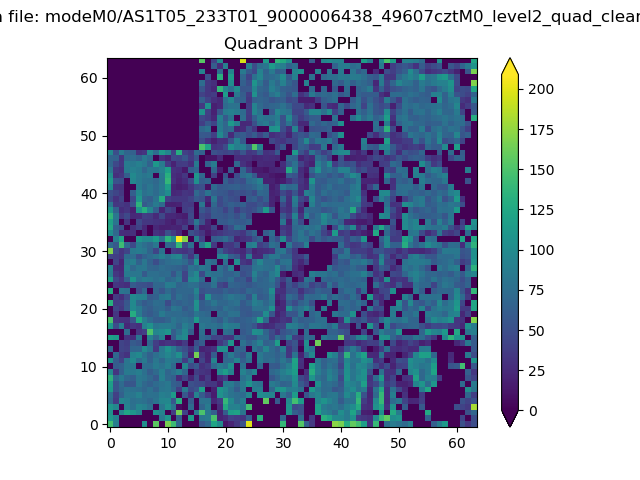 |
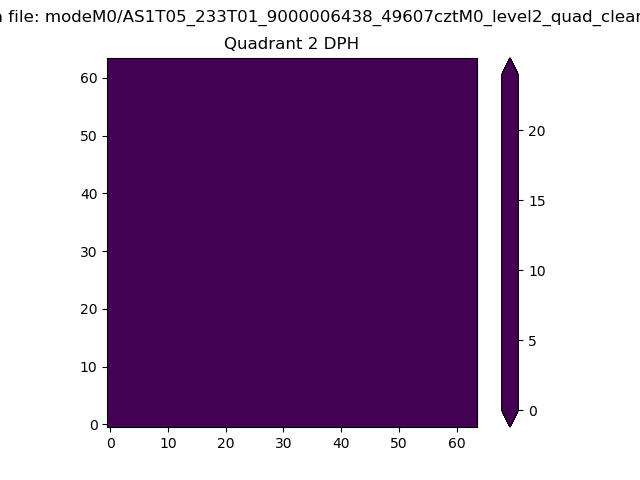 |
Quadrant C |
| Plot type | Count rate plots | Images |
|---|---|---|
| Comparison with Poisson distribution Blue bars denote a histogram of data divided into 1 sec bins. Red curve is a Poisson curve with rate = median count rate of data. |
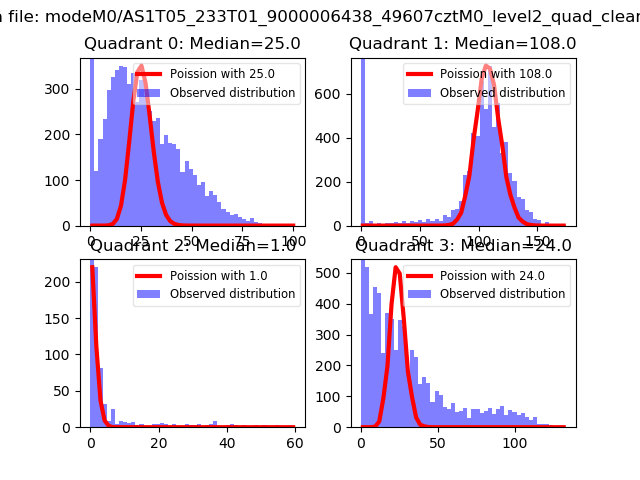 |
 |
| Quadrant-wise count rates Data is divided into 100 sec bins |
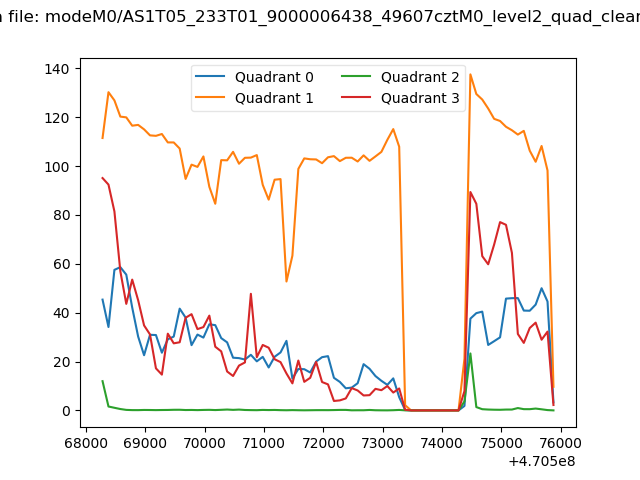 |
|
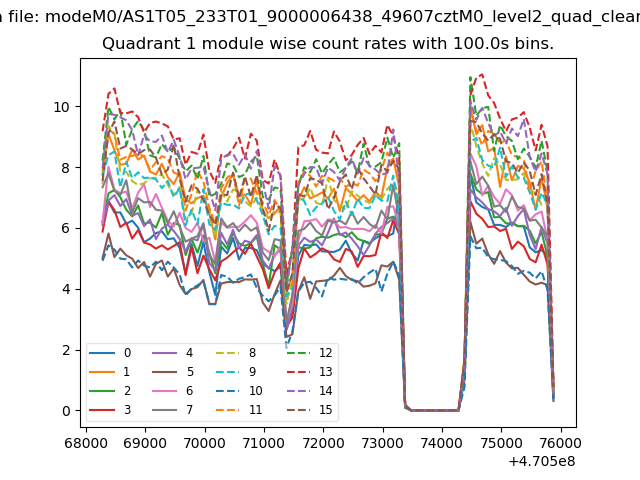
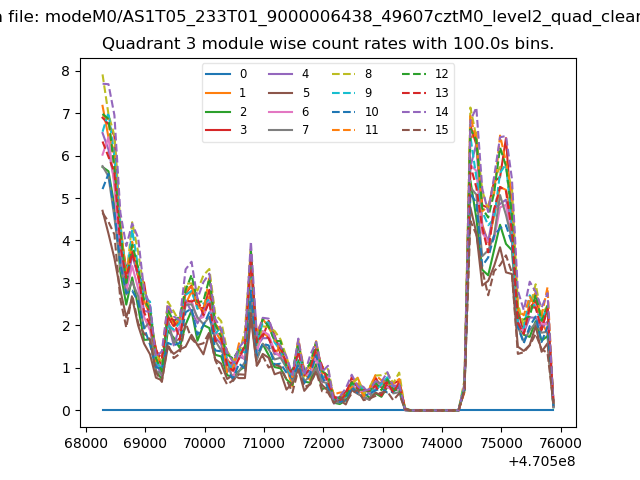
| Module-wise count rates for Quadrant A Data is divided into 100 sec bins |
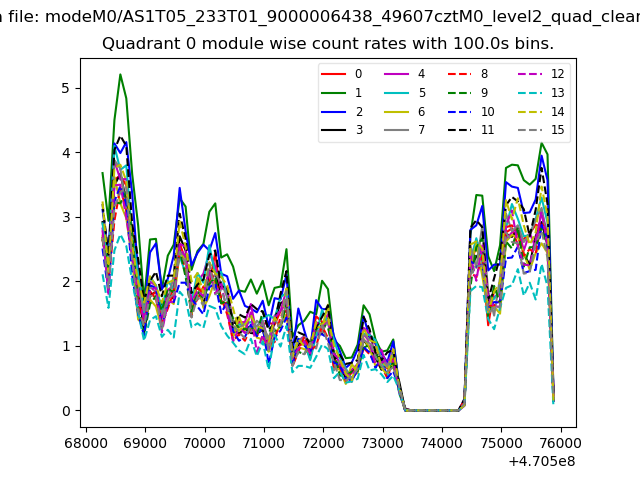 |
 |
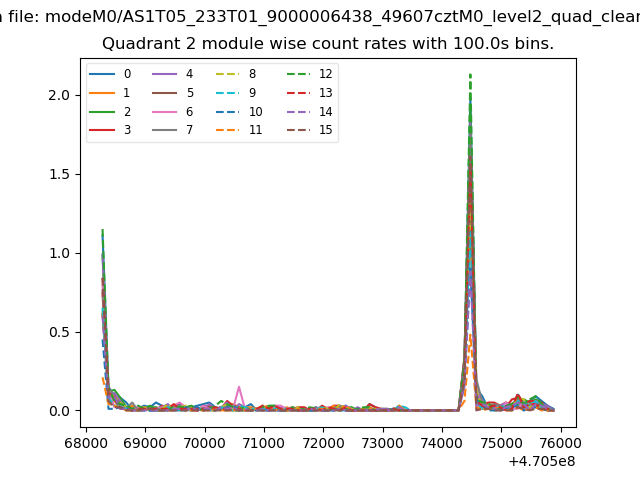
| Module-wise count rates for Quadrant B Data is divided into 100 sec bins |
 |
 |
| Module-wise count rates for Quadrant C Data is divided into 100 sec bins |
 |
 |
| Module-wise count rates for Quadrant D Data is divided into 100 sec bins |
 |
 |
| Parameter | Plot |
|---|---|
| CZT HV Monitor | 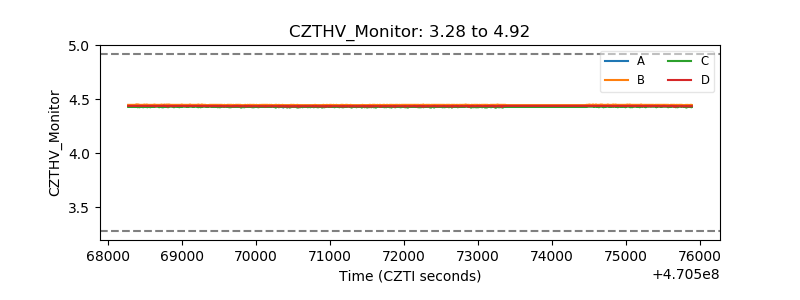 |
| D_VDD | 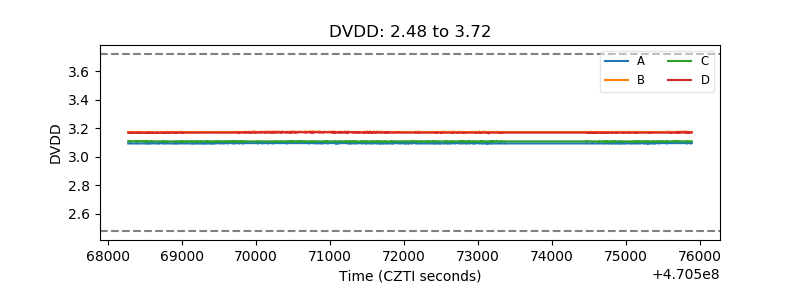 |
| Temperature 1 | 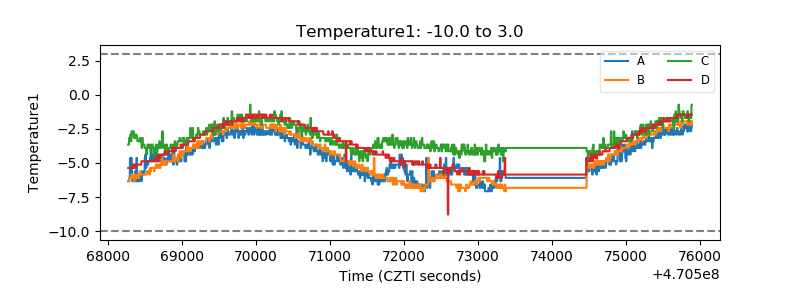 |
| Veto HV Monitor | 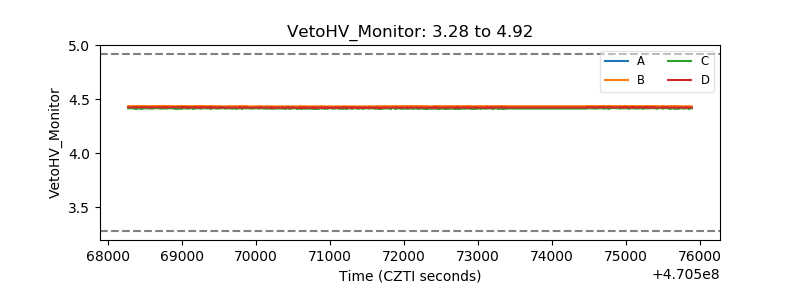 |
| Veto LLD | 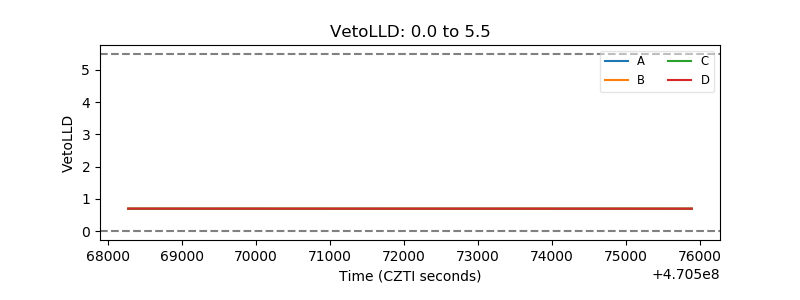 |
| Alpha Counter | 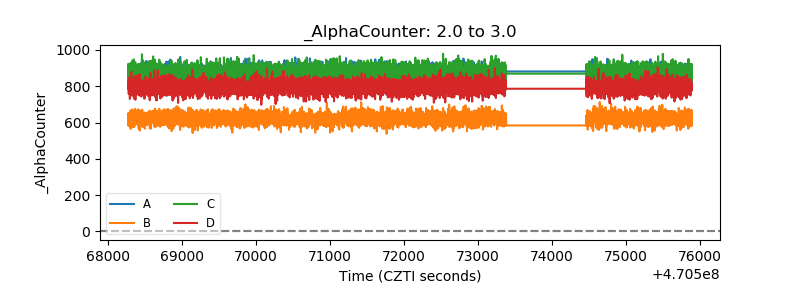 |
| _CPM_Rate | 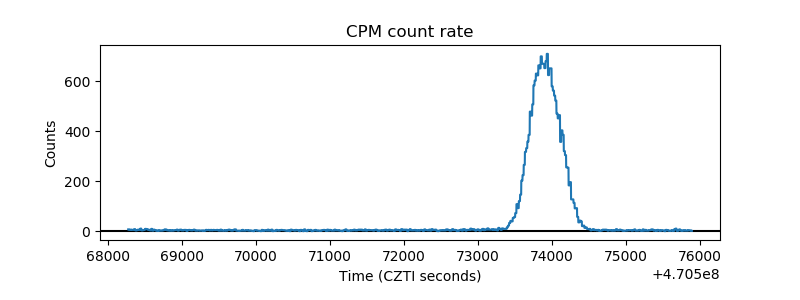 |
| CZT Counter | 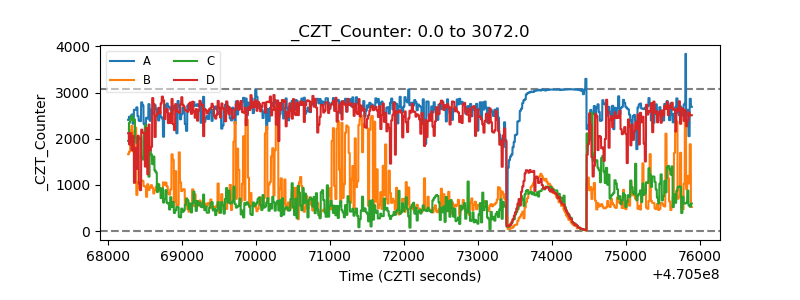 |
| +2.5 Volts monitor | 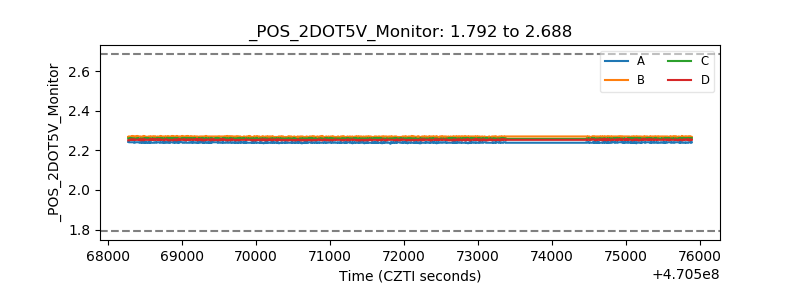 |
| +5 Volts monitor | 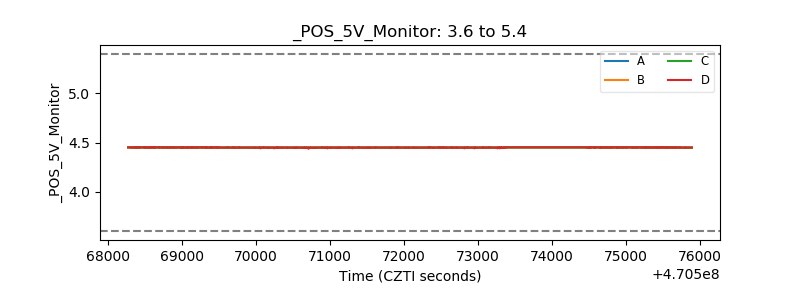 |
| _ROLL_ROT | 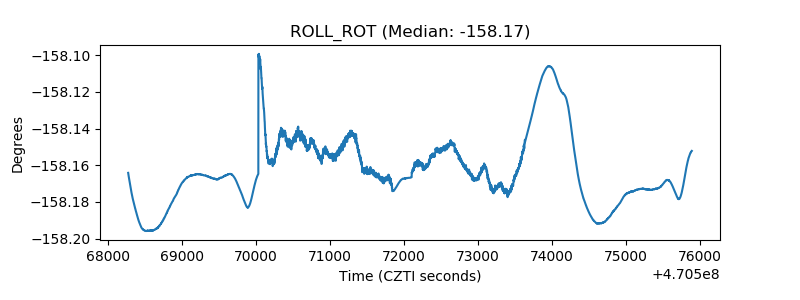 |
| _Roll_DEC | 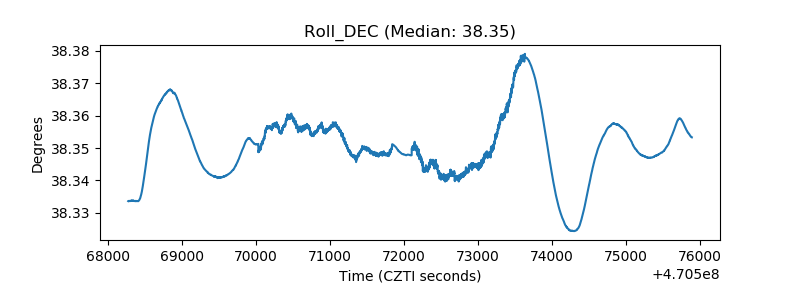 |
| _Roll_RA | 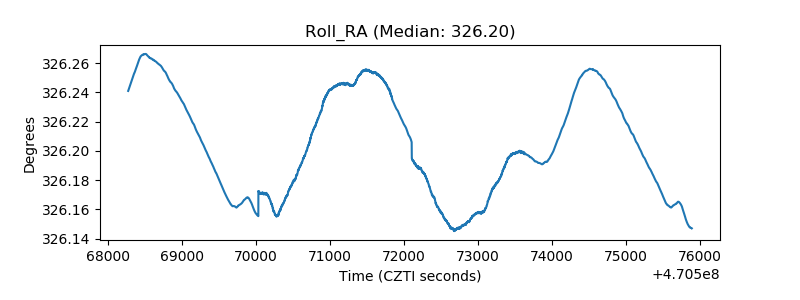 |
| Veto Counter | 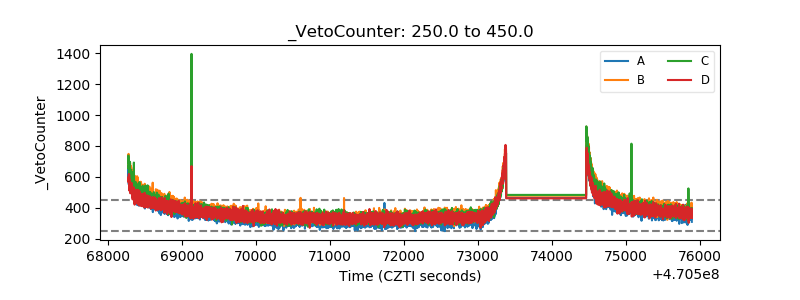 |