| Param | Original file | Final file |
|---|---|---|
| Filename | modeM0/AS1T05_233T01_9000006438_49609cztM0_level2.fits | modeM0/AS1T05_233T01_9000006438_49609cztM0_level2_quad_clean.evt |
| Size (bytes) | 1,187,743,680 | 46,702,080 |
| Size | 1.1 GB | 44.5 MB |
| Events in quadrant A | 17,135,394 | 166,655 |
| Events in quadrant B | 6,601,691 | 651,747 |
| Events in quadrant C | 4,518,150 | 4,536 |
| Events in quadrant D | 15,198,264 | 120,887 |
| Mode M9 | |||
|---|---|---|---|
| Quadrant | BADHDUFLAG | Total packets | Discarded packets |
| A | 0 | 10 | 0 |
| B | 0 | 10 | 0 |
| C | 0 | 10 | 0 |
| D | 0 | 10 | 0 |
| Mode SS | |||
|---|---|---|---|
| Quadrant | BADHDUFLAG | Total packets | Discarded packets |
| A | 0 | 134 | 0 |
| B | 0 | 134 | 0 |
| C | 0 | 134 | 0 |
| D | 0 | 134 | 0 |
| Mode M0 | |||
|---|---|---|---|
| Quadrant | BADHDUFLAG | Total packets | Discarded packets |
| A | 0 | 55495 | 1 |
| B | 0 | 24132 | 1 |
| C | 0 | 18307 | 1 |
| D | 0 | 49691 | 5 |
| Quadrant | Total seconds | Saturated seconds | Saturation percentage |
|---|---|---|---|
| A | 6600 | 6600 | 100.000000% |
| B | 6601 | 1017 | 15.406757% |
| C | 6601 | 6601 | 100.000000% |
| D | 6600 | 6445 | 97.651515% |
Noise dominated data is calculated using 1-second bins in cleaned event files. If a bin has >2000 counts, and if more than 50% of those come from <1% of pixels, then it is considered to be noise-dominated and hence unusable.
| Quadrant | # 1 sec bins | Bins with >0 counts | Bins with >2000 counts | High rate bins dominated by noise | Noise dominated (total time) | Noise dominated (detector-on time) | Marked lightcurve |
|---|---|---|---|---|---|---|---|
| A | 7610 | 6602 | 6235 | 6235 | 81.93% | 94.44% | 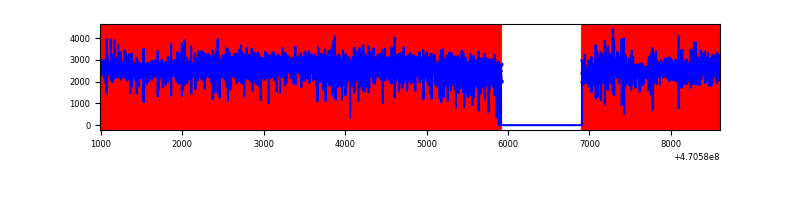 |
| B | 7611 | 6603 | 741 | 741 | 9.74% | 11.22% | 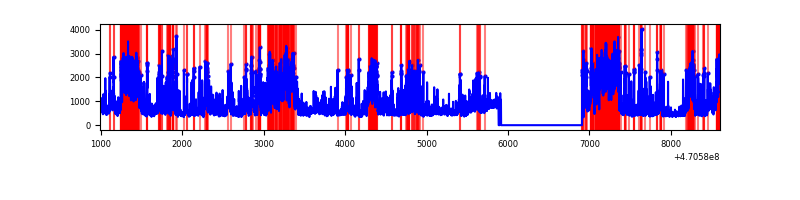 |
| C | 7610 | 6600 | 153 | 153 | 2.01% | 2.32% | 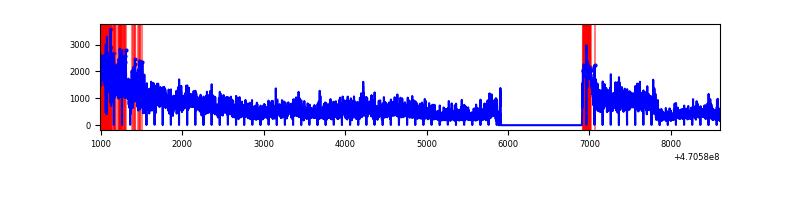 |
| D | 7610 | 6600 | 4760 | 4760 | 62.55% | 72.12% | 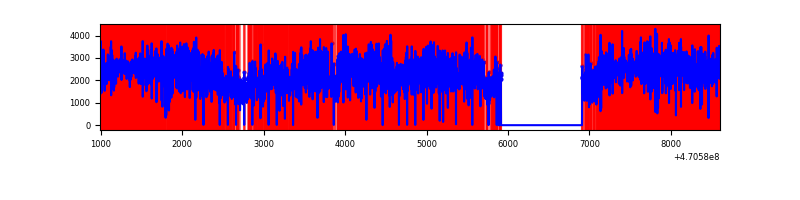 |
Top three noisy pixels from each quadrant. If the there are fewer than three noisy pixels in the level2.evt file, extra rows are filled as -1
| Pixel properties | Quadrant properties | ||||||
|---|---|---|---|---|---|---|---|
| Quadrant | DetID | PixID | Counts | Sigma | Mean | Median | Sigma |
| A | 0 | 99 | 3295864 | 40553.93 | 205 | 194 | 81.3 |
| A | 10 | 83 | 3177656 | 39099.35 | 205 | 194 | 81.3 |
| A | 9 | 191 | 2019679 | 24850.2 | 205 | 194 | 81.3 |
| B | 5 | 172 | 1015540 | 7177.08 | 665 | 644 | 141.4 |
| B | 3 | 232 | 907781 | 6415.03 | 665 | 644 | 141.4 |
| B | 4 | 206 | 579842 | 4095.94 | 665 | 644 | 141.4 |
| C | 15 | 181 | 1376599 | 103887.94 | 12 | 10 | 13.3 |
| C | 15 | 235 | 853223 | 64389.98 | 12 | 10 | 13.3 |
| C | 15 | 180 | 851517 | 64261.23 | 12 | 10 | 13.3 |
| D | 15 | 40 | 3329467 | 45598.53 | 166 | 155 | 73.0 |
| D | 15 | 122 | 2214825 | 30332.3 | 166 | 155 | 73.0 |
| D | 15 | 94 | 2070232 | 28351.94 | 166 | 155 | 73.0 |
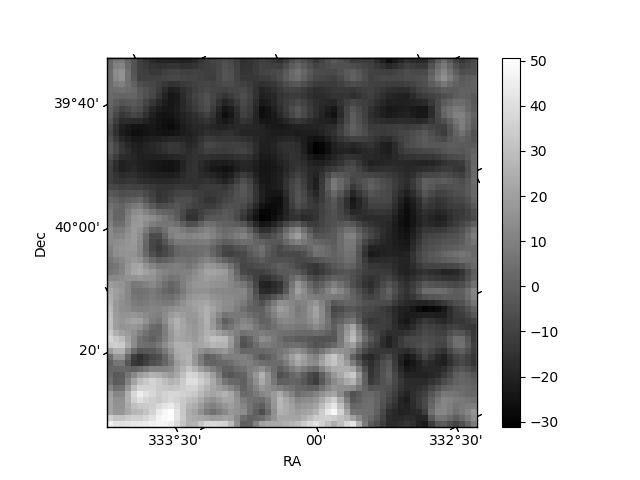
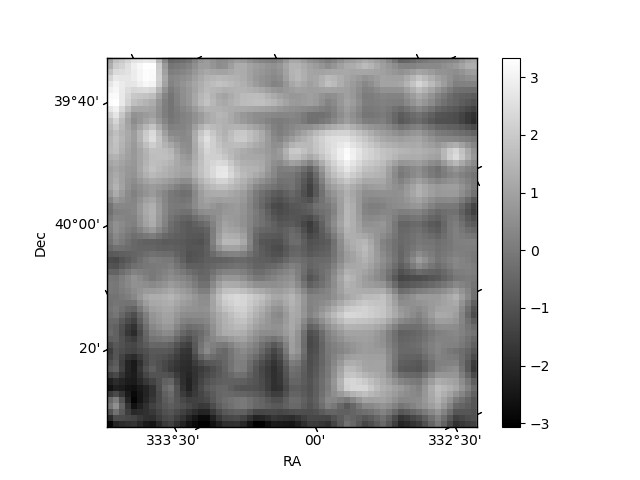
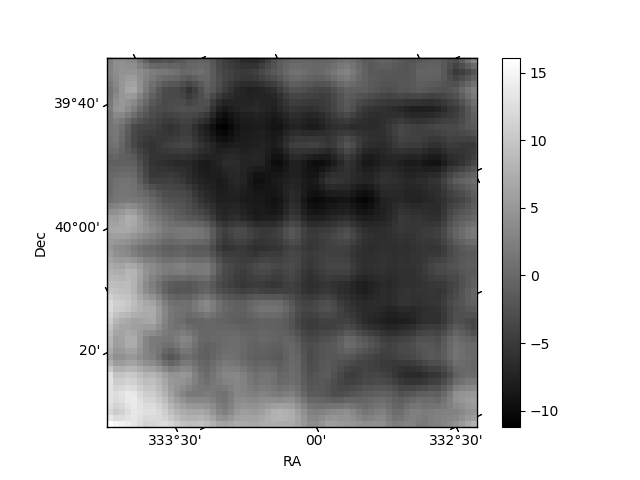
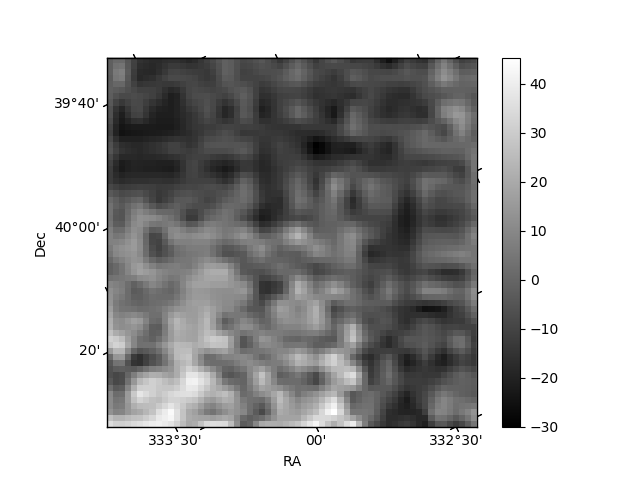
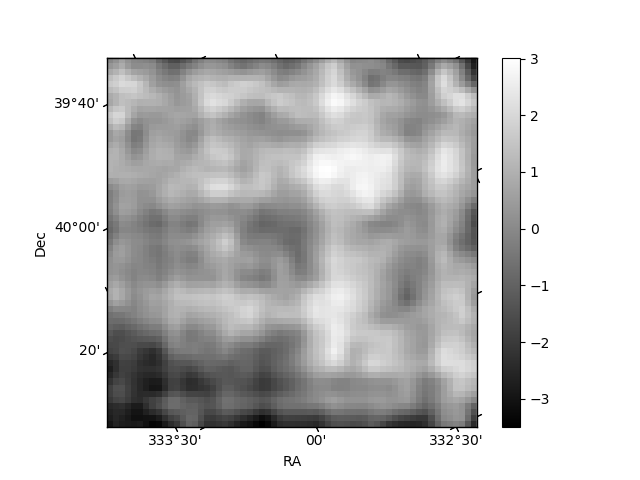
Histogram calculated using DETX and DETY for each event in the final _common_clean file
| Quadrant A | 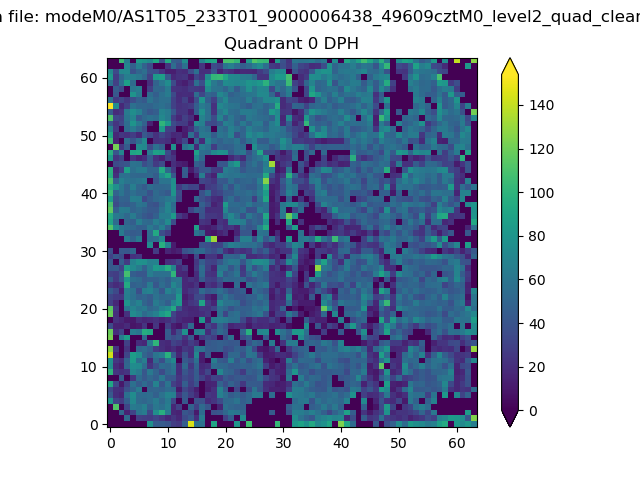 |
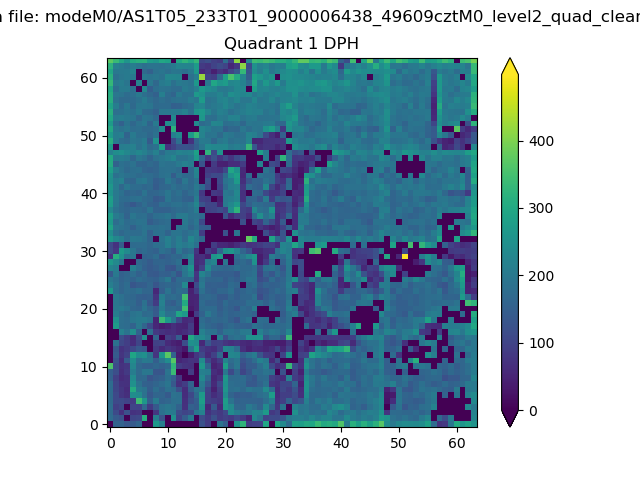 |
Quadrant B |
|---|---|---|---|
| Quadrant D | 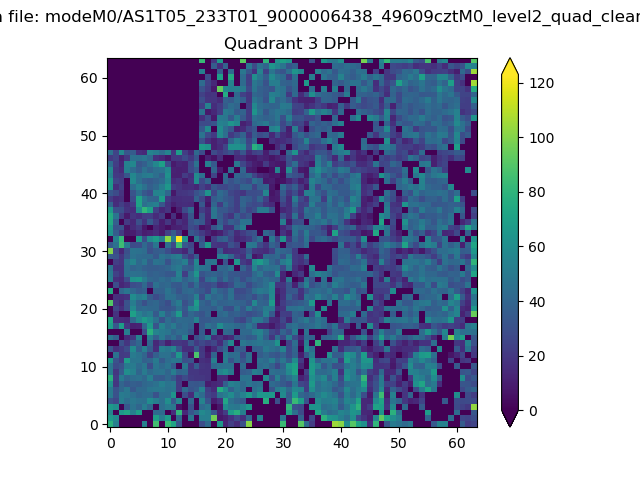 |
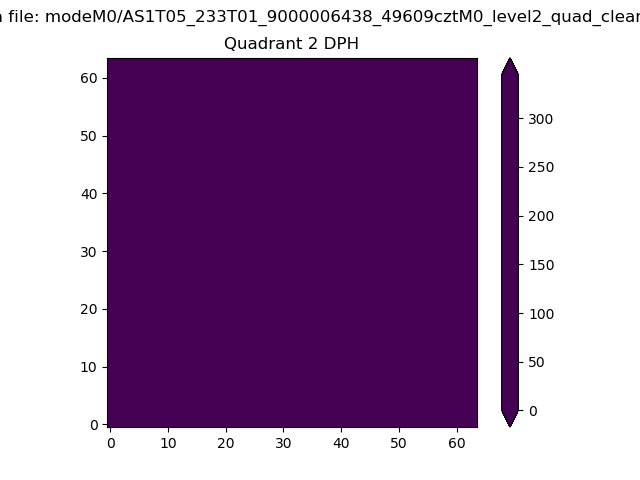 |
Quadrant C |
| Plot type | Count rate plots | Images |
|---|---|---|
| Comparison with Poisson distribution Blue bars denote a histogram of data divided into 1 sec bins. Red curve is a Poisson curve with rate = median count rate of data. |
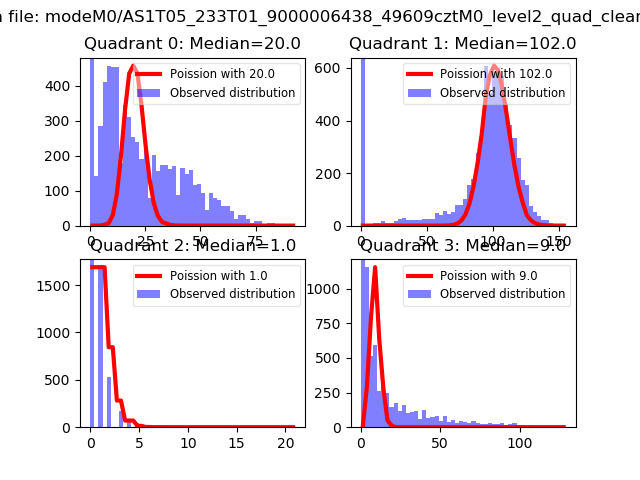 |
 |
| Quadrant-wise count rates Data is divided into 100 sec bins |
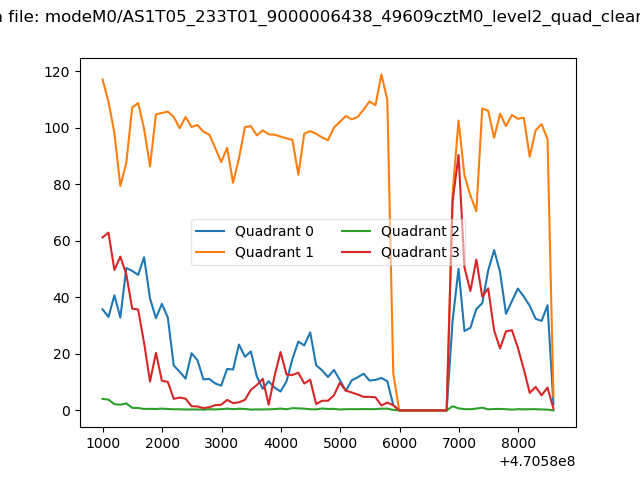 |
|
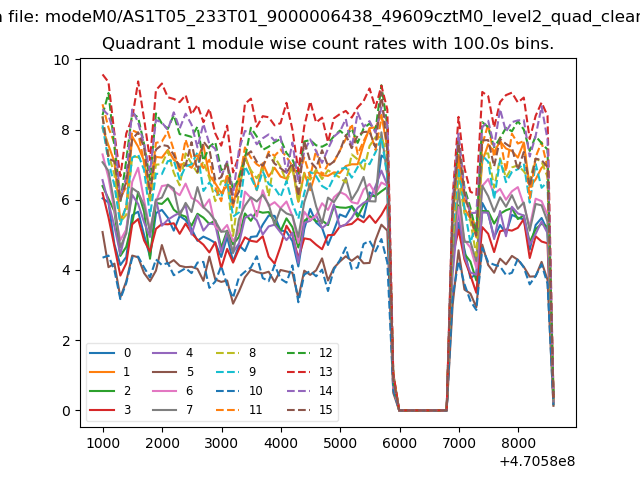
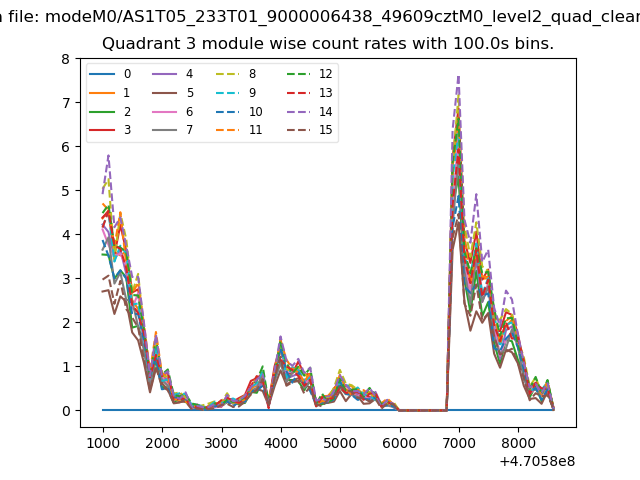
| Module-wise count rates for Quadrant A Data is divided into 100 sec bins |
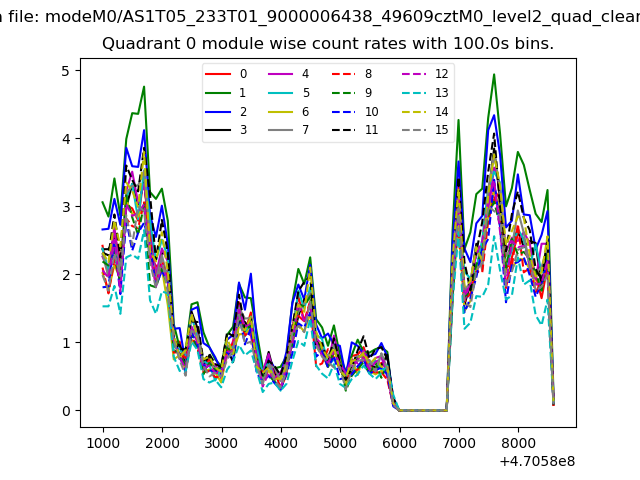 |
 |
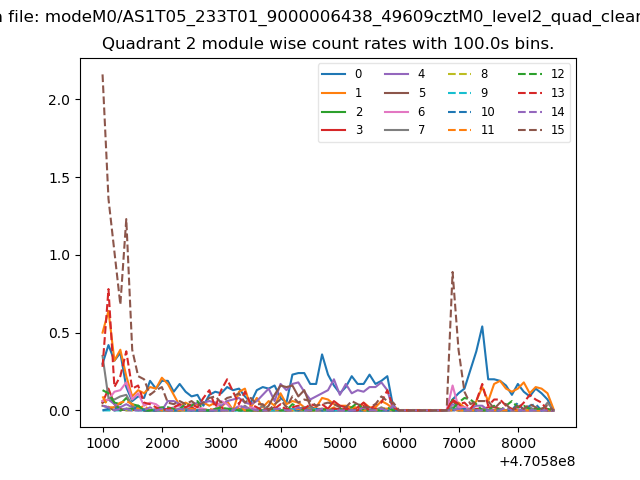
| Module-wise count rates for Quadrant B Data is divided into 100 sec bins |
 |
 |
| Module-wise count rates for Quadrant C Data is divided into 100 sec bins |
 |
 |
| Module-wise count rates for Quadrant D Data is divided into 100 sec bins |
 |
 |
| Parameter | Plot |
|---|---|
| CZT HV Monitor | 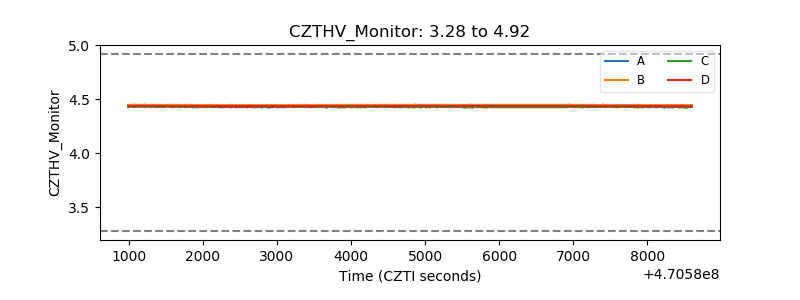 |
| D_VDD | 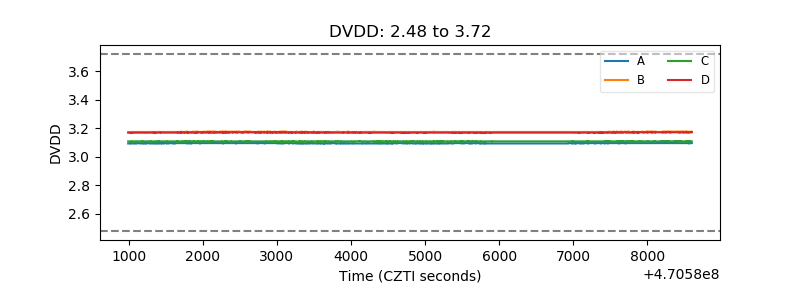 |
| Temperature 1 | 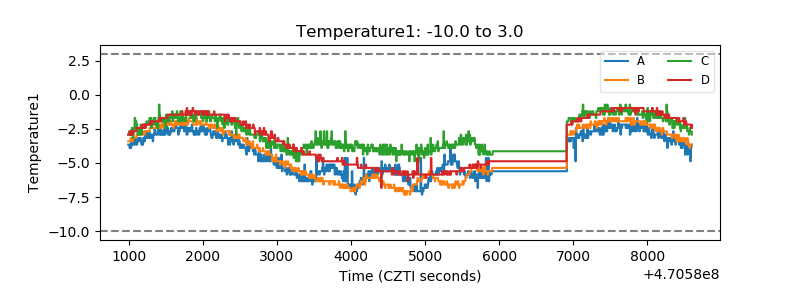 |
| Veto HV Monitor |  |
| Veto LLD | 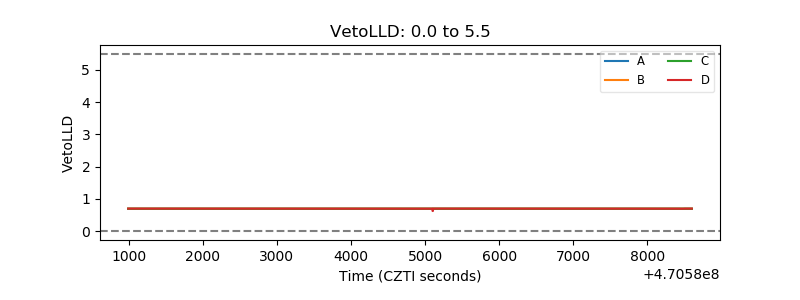 |
| Alpha Counter | 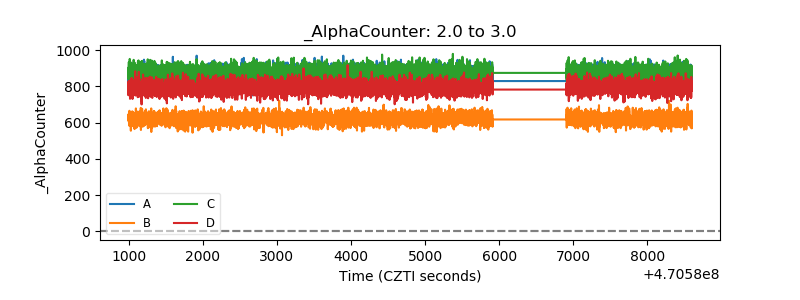 |
| _CPM_Rate | 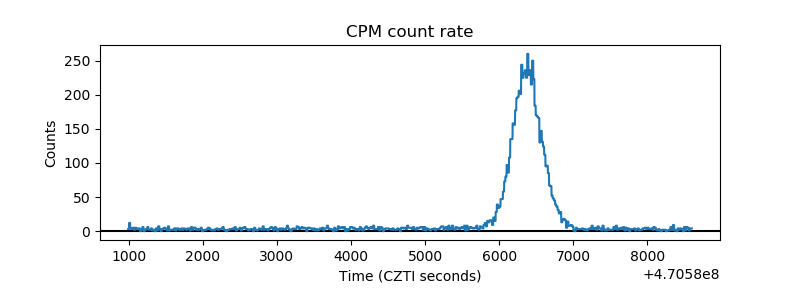 |
| CZT Counter | 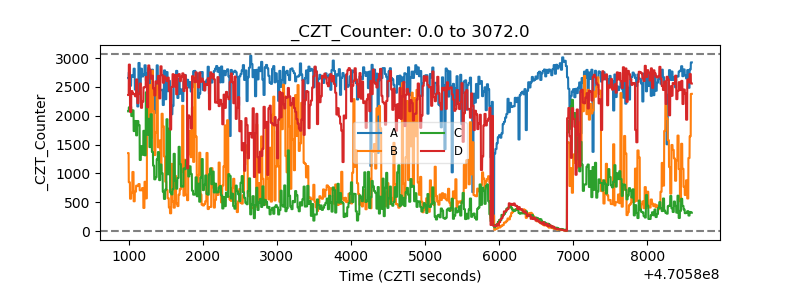 |
| +2.5 Volts monitor | 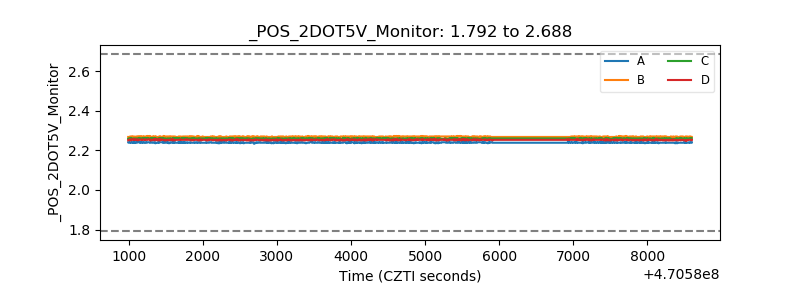 |
| +5 Volts monitor |  |
| _ROLL_ROT | 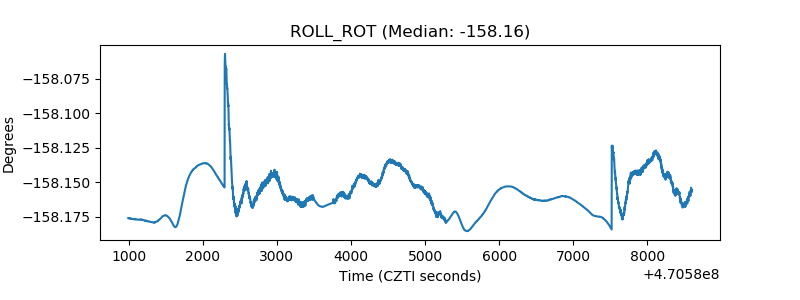 |
| _Roll_DEC | 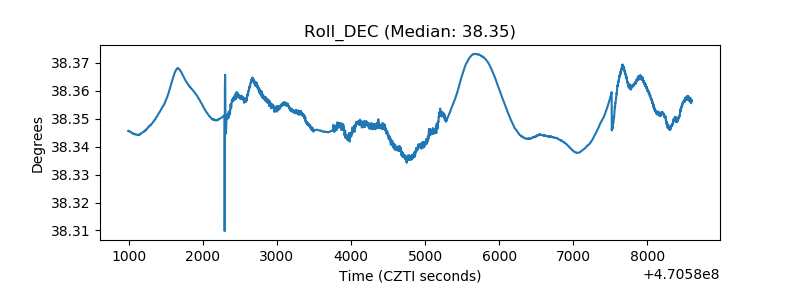 |
| _Roll_RA | 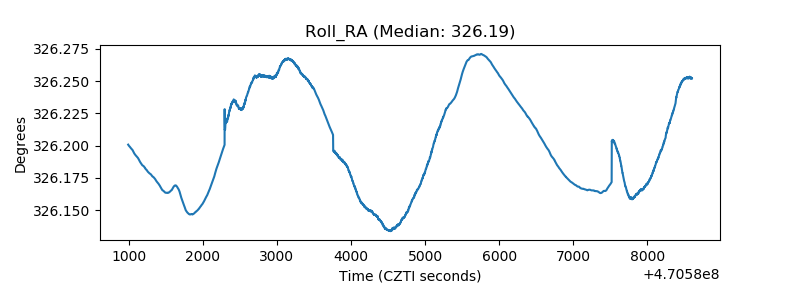 |
| Veto Counter | 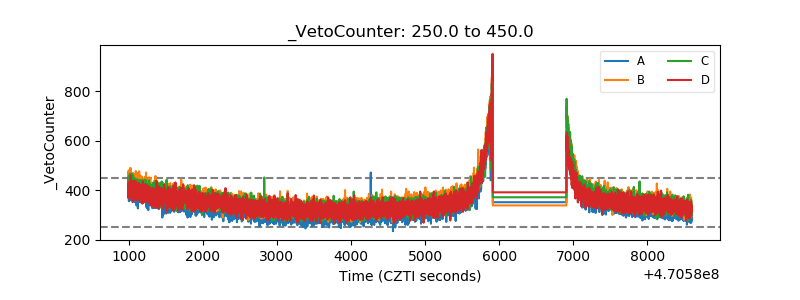 |