| Param | Original file | Final file |
|---|---|---|
| Filename | modeM0/AS1T05_233T01_9000006438_49610cztM0_level2.fits | modeM0/AS1T05_233T01_9000006438_49610cztM0_level2_quad_clean.evt |
| Size (bytes) | 1,151,300,160 | 46,814,400 |
| Size | 1.1 GB | 44.6 MB |
| Events in quadrant A | 17,153,990 | 188,382 |
| Events in quadrant B | 4,902,896 | 661,617 |
| Events in quadrant C | 3,831,715 | 3,749 |
| Events in quadrant D | 16,215,198 | 93,716 |
| Mode M9 | |||
|---|---|---|---|
| Quadrant | BADHDUFLAG | Total packets | Discarded packets |
| A | 0 | 8 | 0 |
| B | 0 | 8 | 0 |
| C | 0 | 8 | 0 |
| D | 0 | 8 | 0 |
| Mode SS | |||
|---|---|---|---|
| Quadrant | BADHDUFLAG | Total packets | Discarded packets |
| A | 0 | 134 | 0 |
| B | 0 | 134 | 0 |
| C | 0 | 134 | 0 |
| D | 0 | 134 | 0 |
| Mode M0 | |||
|---|---|---|---|
| Quadrant | BADHDUFLAG | Total packets | Discarded packets |
| A | 0 | 55506 | 3 |
| B | 0 | 18997 | 1 |
| C | 0 | 16411 | 1 |
| D | 0 | 52671 | 1 |
| Quadrant | Total seconds | Saturated seconds | Saturation percentage |
|---|---|---|---|
| A | 6601 | 6600 | 99.984851% |
| B | 6601 | 396 | 5.999091% |
| C | 6602 | 6602 | 100.000000% |
| D | 6602 | 6581 | 99.681915% |
Noise dominated data is calculated using 1-second bins in cleaned event files. If a bin has >2000 counts, and if more than 50% of those come from <1% of pixels, then it is considered to be noise-dominated and hence unusable.
| Quadrant | # 1 sec bins | Bins with >0 counts | Bins with >2000 counts | High rate bins dominated by noise | Noise dominated (total time) | Noise dominated (detector-on time) | Marked lightcurve |
|---|---|---|---|---|---|---|---|
| A | 7426 | 6602 | 6351 | 6351 | 85.52% | 96.20% | 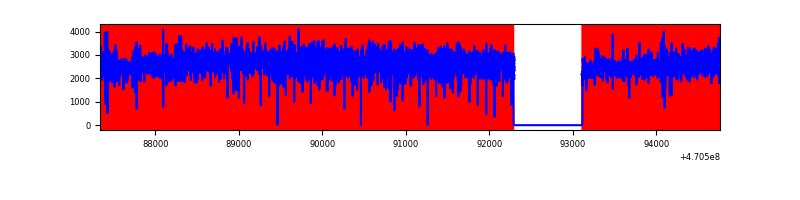 |
| B | 7426 | 6602 | 291 | 291 | 3.92% | 4.41% | 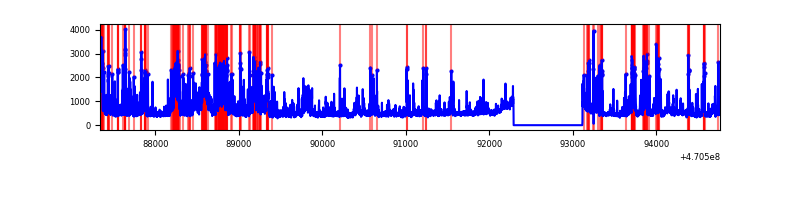 |
| C | 7426 | 6601 | 149 | 149 | 2.01% | 2.26% | 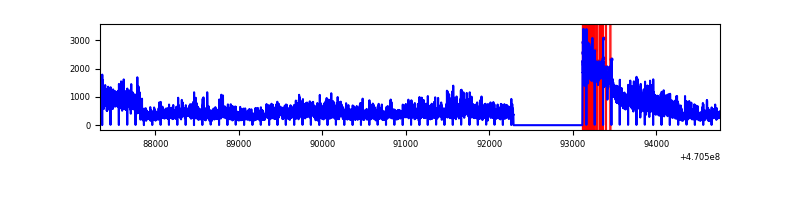 |
| D | 7427 | 6602 | 5656 | 5656 | 76.15% | 85.67% | 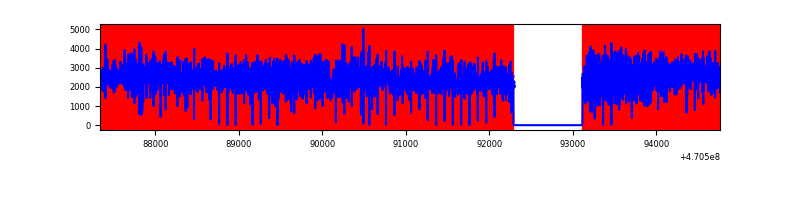 |
Top three noisy pixels from each quadrant. If the there are fewer than three noisy pixels in the level2.evt file, extra rows are filled as -1
| Pixel properties | Quadrant properties | ||||||
|---|---|---|---|---|---|---|---|
| Quadrant | DetID | PixID | Counts | Sigma | Mean | Median | Sigma |
| A | 10 | 83 | 3683823 | 53235.45 | 223 | 214 | 69.2 |
| A | 0 | 99 | 3586313 | 51826.24 | 223 | 214 | 69.2 |
| A | 0 | 98 | 2292520 | 33128.36 | 223 | 214 | 69.2 |
| B | 3 | 232 | 688204 | 4703.37 | 683 | 663 | 146.2 |
| B | 4 | 206 | 451733 | 3085.71 | 683 | 663 | 146.2 |
| B | 4 | 170 | 207273 | 1413.39 | 683 | 663 | 146.2 |
| C | 15 | 181 | 1047190 | 89905.4 | 10 | 9 | 11.6 |
| C | 15 | 180 | 824405 | 70778.26 | 10 | 9 | 11.6 |
| C | 15 | 235 | 661801 | 56817.94 | 10 | 9 | 11.6 |
| D | 15 | 40 | 2958998 | 33209.63 | 138 | 124 | 89.1 |
| D | 15 | 122 | 2493857 | 27989.01 | 138 | 124 | 89.1 |
| D | 15 | 94 | 2237327 | 25109.79 | 138 | 124 | 89.1 |
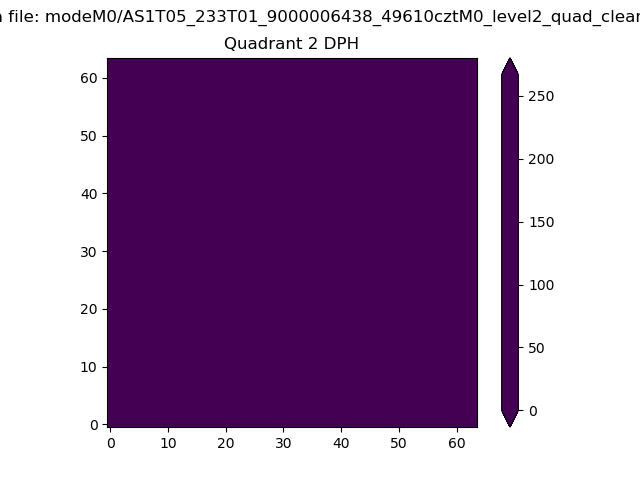
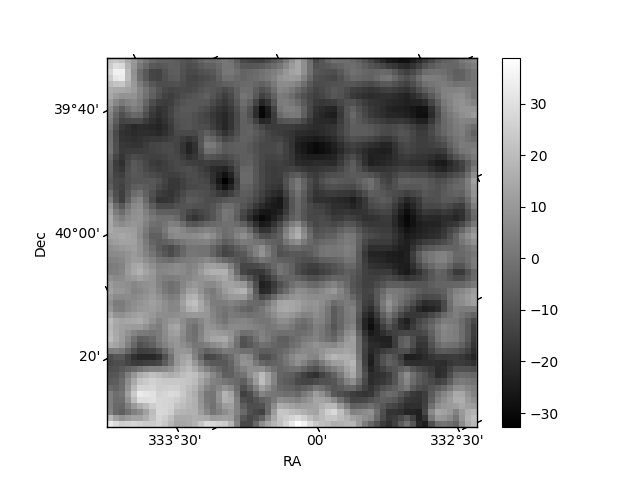
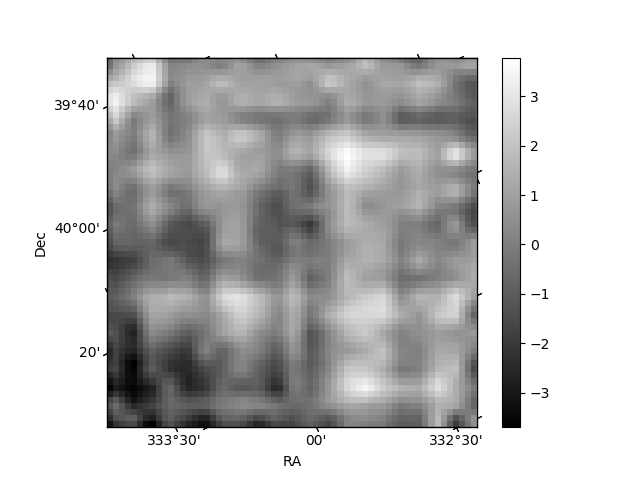
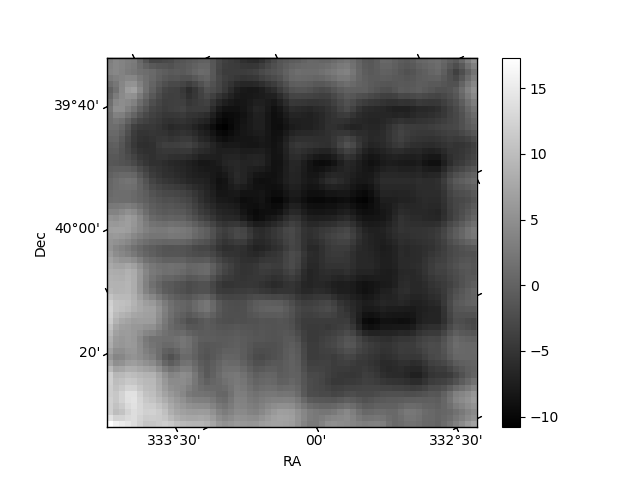
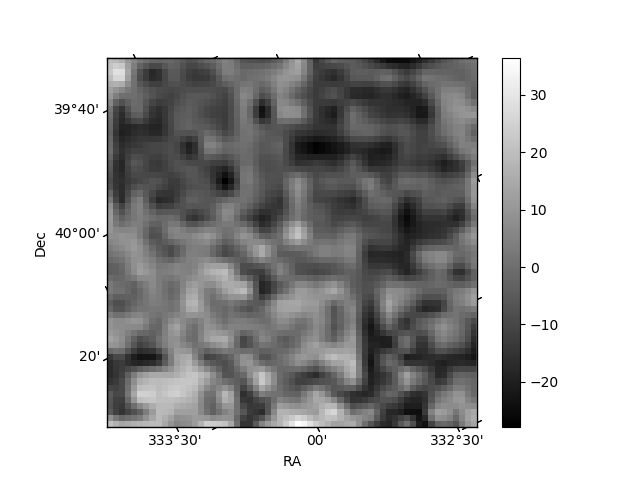
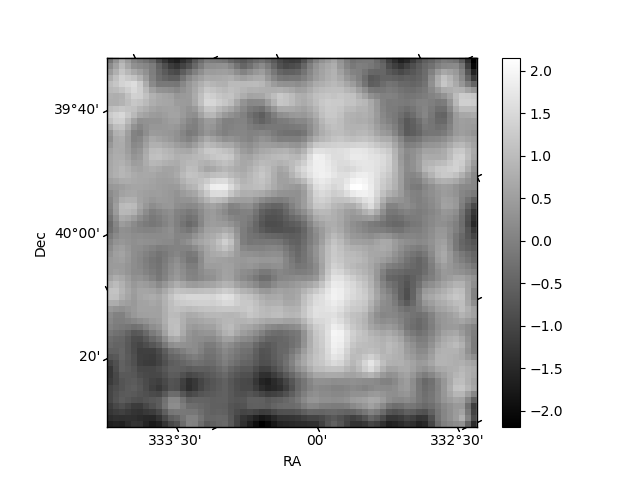
Histogram calculated using DETX and DETY for each event in the final _common_clean file
| Quadrant A | 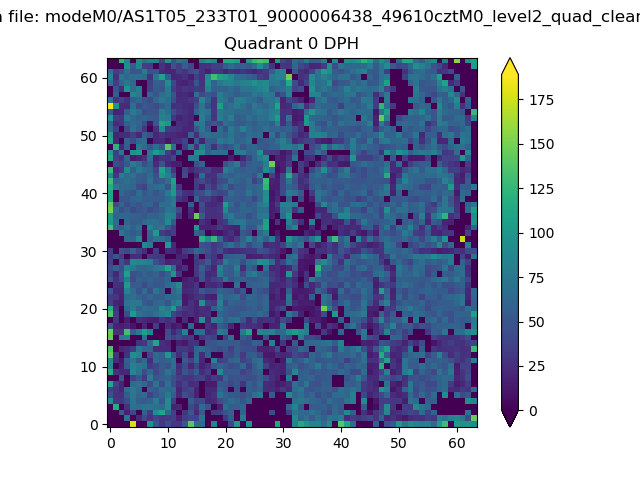 |
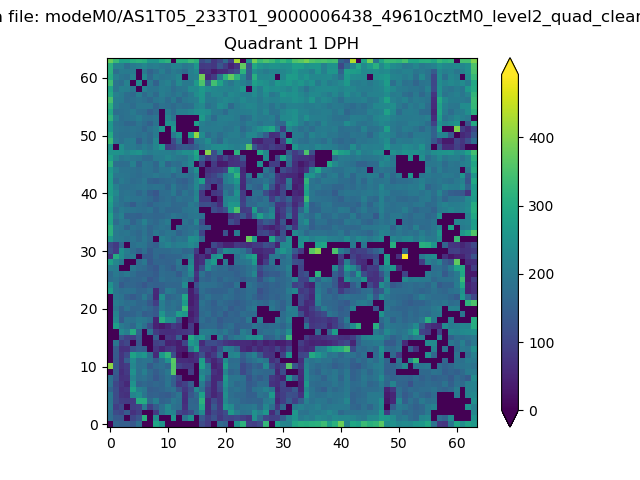 |
Quadrant B |
|---|---|---|---|
| Quadrant D | 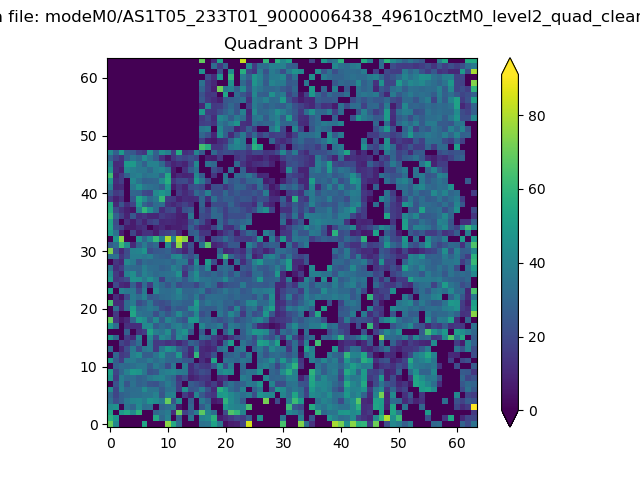 |
 |
Quadrant C |
| Plot type | Count rate plots | Images |
|---|---|---|
| Comparison with Poisson distribution Blue bars denote a histogram of data divided into 1 sec bins. Red curve is a Poisson curve with rate = median count rate of data. |
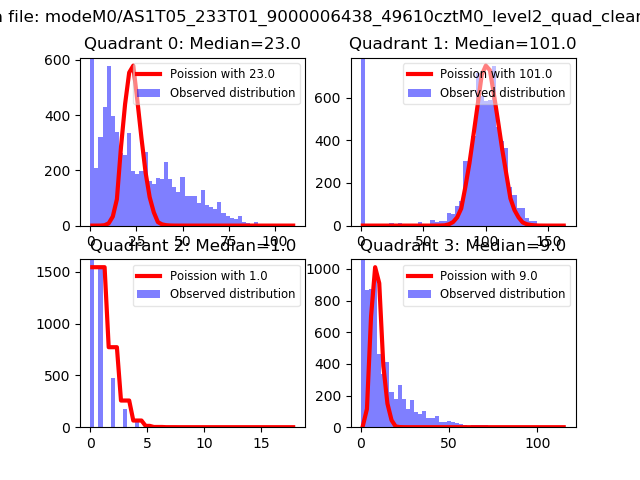 |
 |
| Quadrant-wise count rates Data is divided into 100 sec bins |
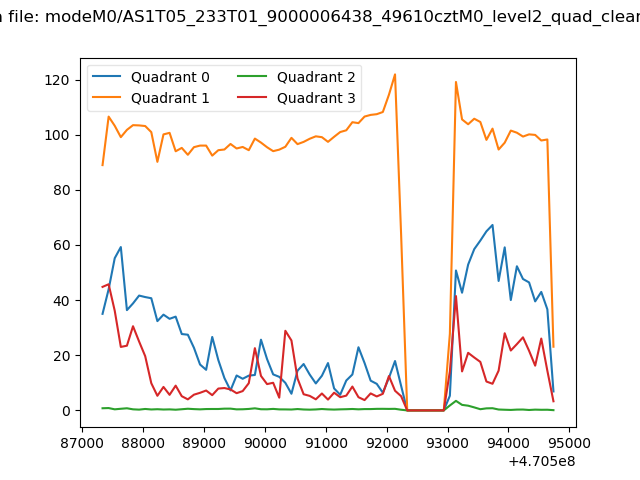 |
|
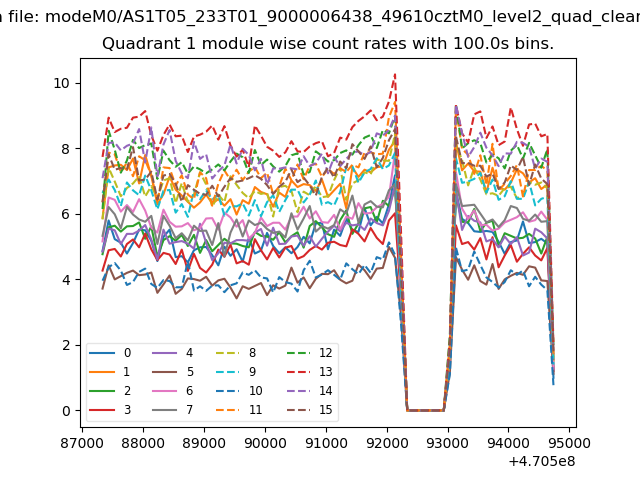
| Module-wise count rates for Quadrant A Data is divided into 100 sec bins |
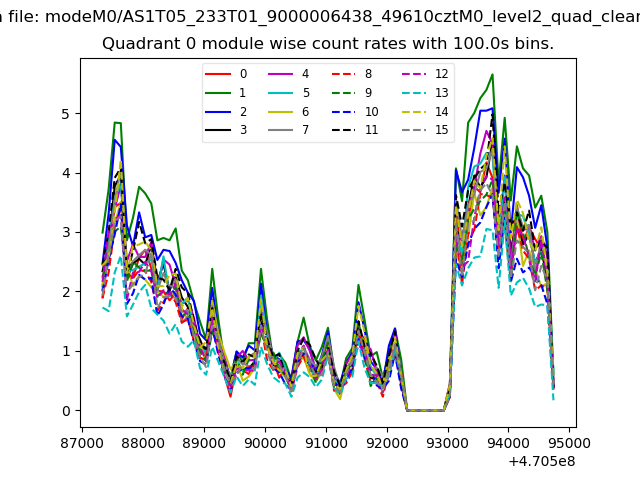 |
 |
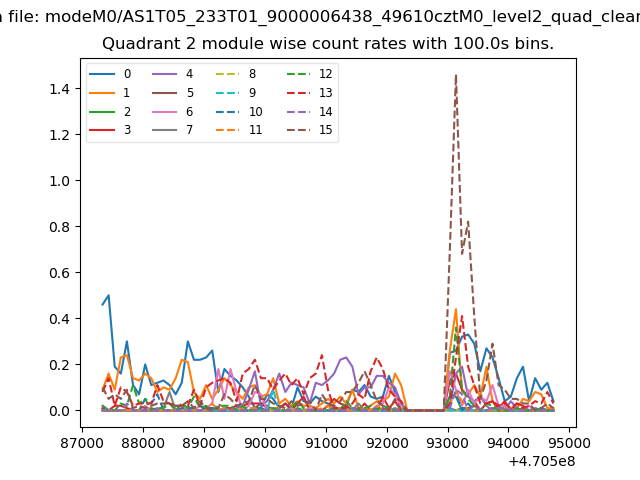
| Module-wise count rates for Quadrant B Data is divided into 100 sec bins |
 |
 |
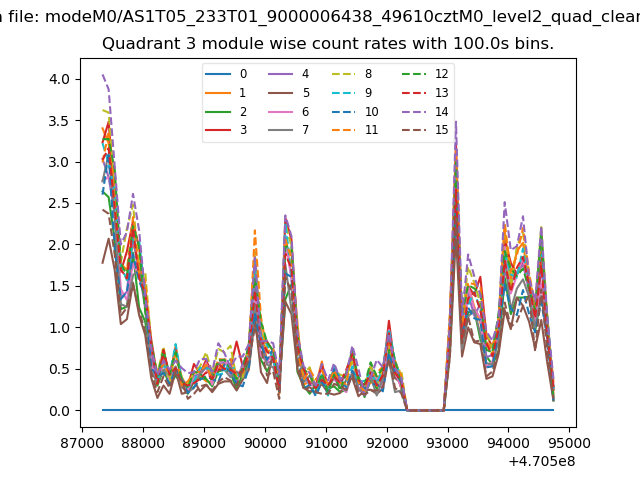
| Module-wise count rates for Quadrant C Data is divided into 100 sec bins |
 |
 |
| Module-wise count rates for Quadrant D Data is divided into 100 sec bins |
 |
 |
| Parameter | Plot |
|---|---|
| CZT HV Monitor | 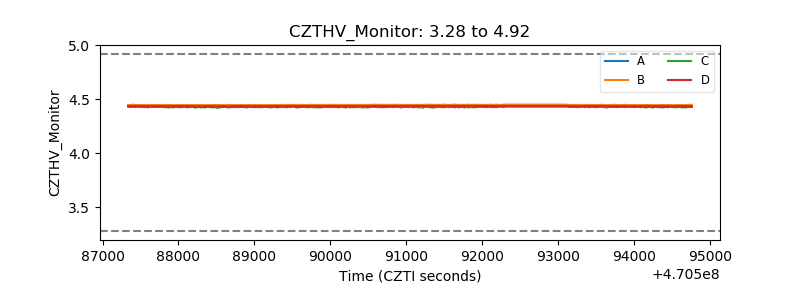 |
| D_VDD | 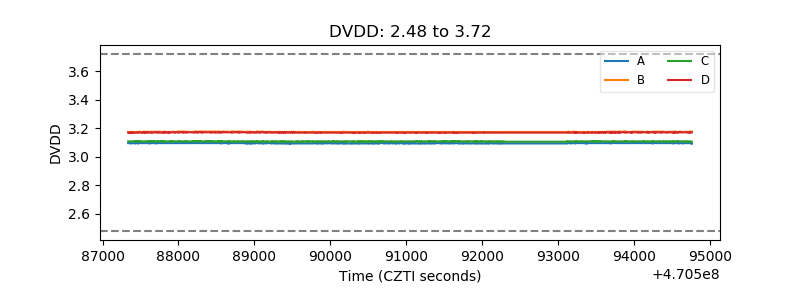 |
| Temperature 1 | 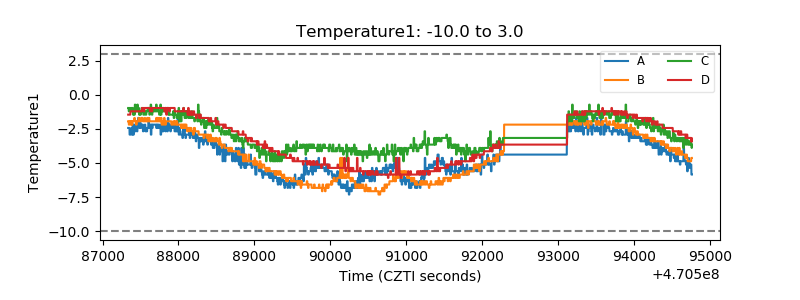 |
| Veto HV Monitor | 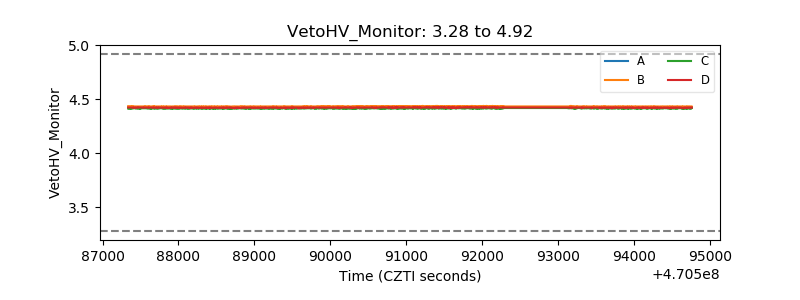 |
| Veto LLD | 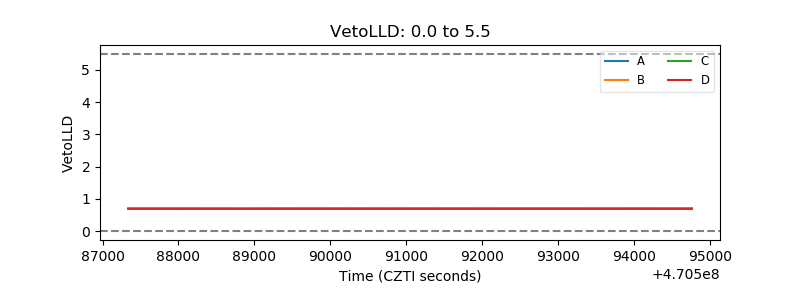 |
| Alpha Counter | 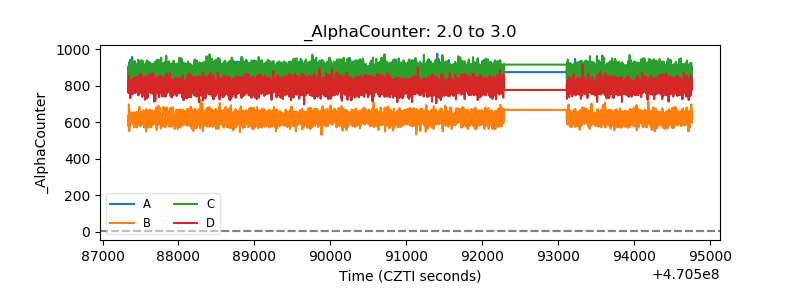 |
| _CPM_Rate | 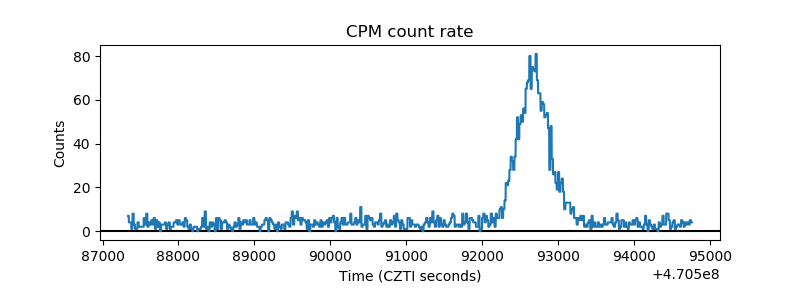 |
| CZT Counter | 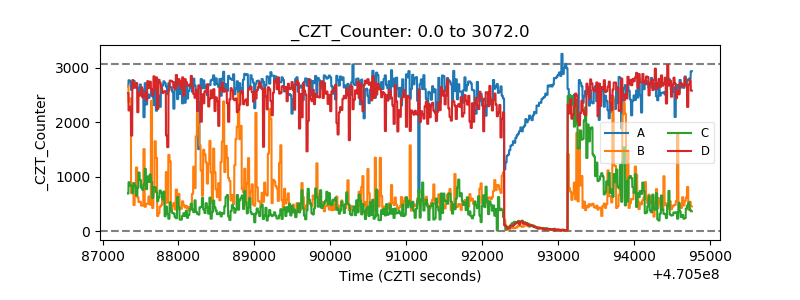 |
| +2.5 Volts monitor | 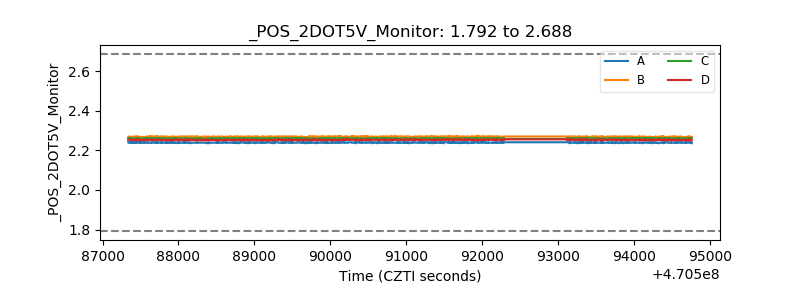 |
| +5 Volts monitor | 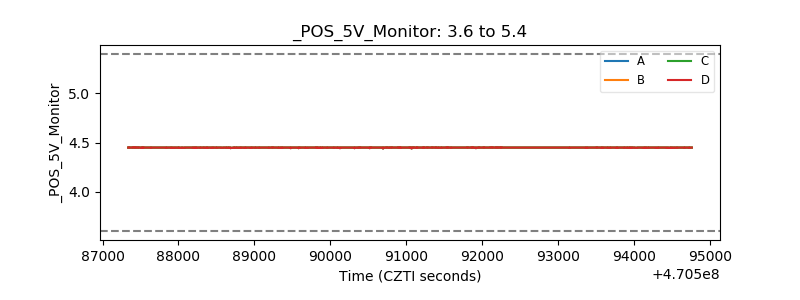 |
| _ROLL_ROT | 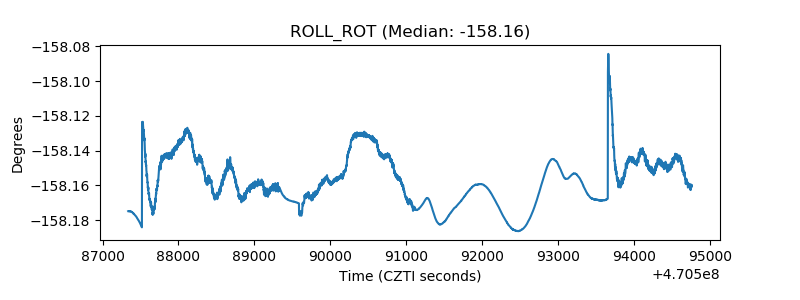 |
| _Roll_DEC | 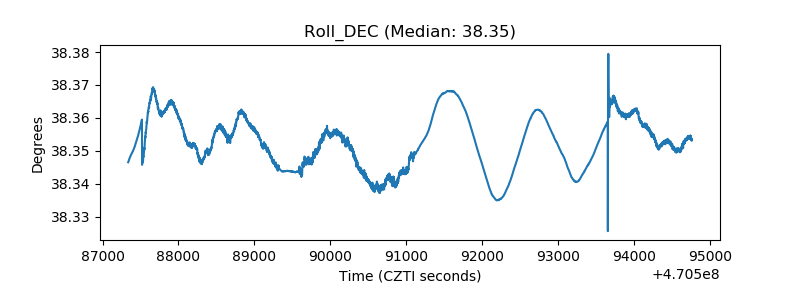 |
| _Roll_RA | 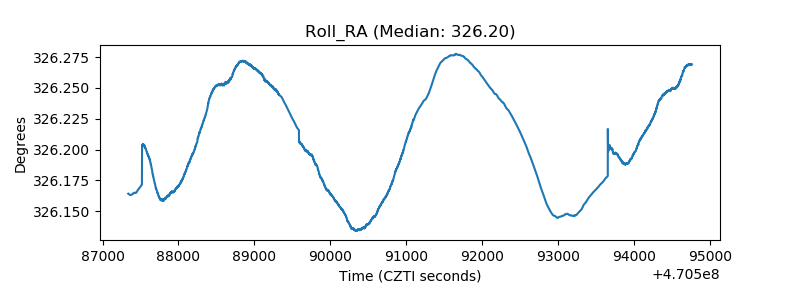 |
| Veto Counter | 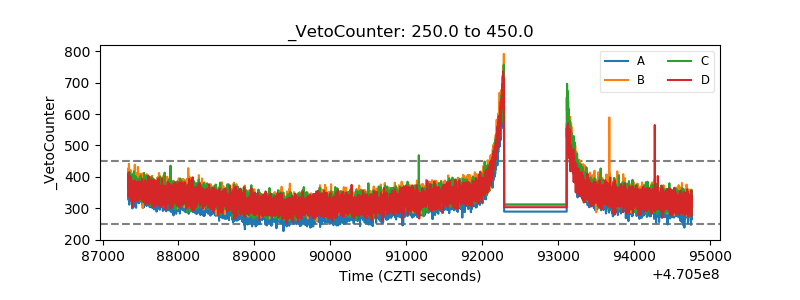 |