| Param | Original file | Final file |
|---|---|---|
| Filename | modeM0/AS1T05_233T01_9000006438_49613cztM0_level2.fits | modeM0/AS1T05_233T01_9000006438_49613cztM0_level2_quad_clean.evt |
| Size (bytes) | 1,705,720,320 | 45,112,320 |
| Size | 1.6 GB | 43.0 MB |
| Events in quadrant A | 13,376,532 | 19,194 |
| Events in quadrant B | 7,842,329 | 713,438 |
| Events in quadrant C | 4,004,434 | 5,155 |
| Events in quadrant D | 37,145,854 | 75,729 |
| Mode SS | |||
|---|---|---|---|
| Quadrant | BADHDUFLAG | Total packets | Discarded packets |
| A | 0 | 154 | 0 |
| B | 0 | 154 | 0 |
| C | 0 | 154 | 0 |
| D | 0 | 154 | 0 |
| Mode M0 | |||
|---|---|---|---|
| Quadrant | BADHDUFLAG | Total packets | Discarded packets |
| A | 0 | 45147 | 0 |
| B | 0 | 28651 | 0 |
| C | 0 | 17707 | 0 |
| D | 0 | 60432 | 0 |
| Quadrant | Total seconds | Saturated seconds | Saturation percentage |
|---|---|---|---|
| A | 7777 | 7777 | 100.000000% |
| B | 7777 | 1202 | 15.455831% |
| C | 7778 | 7778 | 100.000000% |
| D | 7778 | 7778 | 100.000000% |
Noise dominated data is calculated using 1-second bins in cleaned event files. If a bin has >2000 counts, and if more than 50% of those come from <1% of pixels, then it is considered to be noise-dominated and hence unusable.
| Quadrant | # 1 sec bins | Bins with >0 counts | Bins with >2000 counts | High rate bins dominated by noise | Noise dominated (total time) | Noise dominated (detector-on time) | Marked lightcurve |
|---|---|---|---|---|---|---|---|
| A | 7776 | 7776 | 2067 | 2067 | 26.58% | 26.58% | 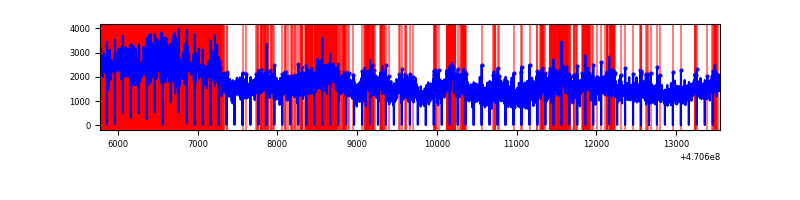 |
| B | 7777 | 7777 | 873 | 873 | 11.23% | 11.23% | 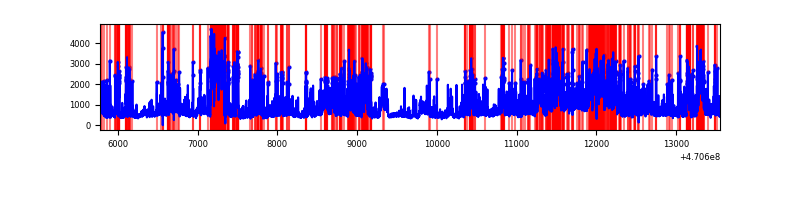 |
| C | 7777 | 7777 | 1 | 1 | 0.01% | 0.01% | 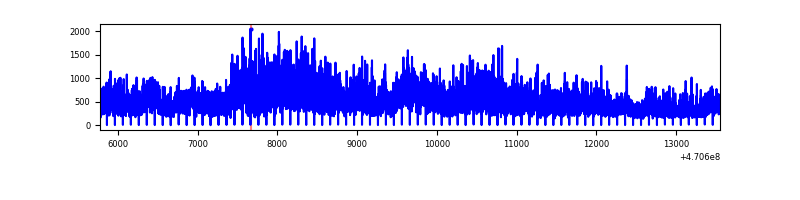 |
| D | 7777 | 7777 | 7695 | 7695 | 98.95% | 98.95% | 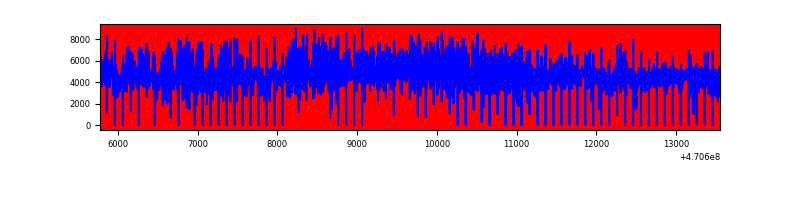 |
Top three noisy pixels from each quadrant. If the there are fewer than three noisy pixels in the level2.evt file, extra rows are filled as -1
| Pixel properties | Quadrant properties | ||||||
|---|---|---|---|---|---|---|---|
| Quadrant | DetID | PixID | Counts | Sigma | Mean | Median | Sigma |
| A | 0 | 99 | 8536963 | 223519.29 | 47 | 41 | 38.2 |
| A | 0 | 98 | 1551108 | 40611.05 | 47 | 41 | 38.2 |
| A | 10 | 83 | 755870 | 19789.61 | 47 | 41 | 38.2 |
| B | 3 | 232 | 896509 | 5605.82 | 754 | 731 | 159.8 |
| B | 5 | 49 | 734153 | 4589.79 | 754 | 731 | 159.8 |
| B | 4 | 206 | 578524 | 3615.85 | 754 | 731 | 159.8 |
| C | 15 | 181 | 682611 | 66891.05 | 9 | 8 | 10.2 |
| C | 15 | 197 | 438220 | 42942.18 | 9 | 8 | 10.2 |
| C | 15 | 180 | 401843 | 39377.45 | 9 | 8 | 10.2 |
| D | 15 | 184 | 7563152 | 32330.77 | 246 | 210 | 233.9 |
| D | 15 | 40 | 6389240 | 27312.42 | 246 | 210 | 233.9 |
| D | 15 | 140 | 3036688 | 12980.62 | 246 | 210 | 233.9 |
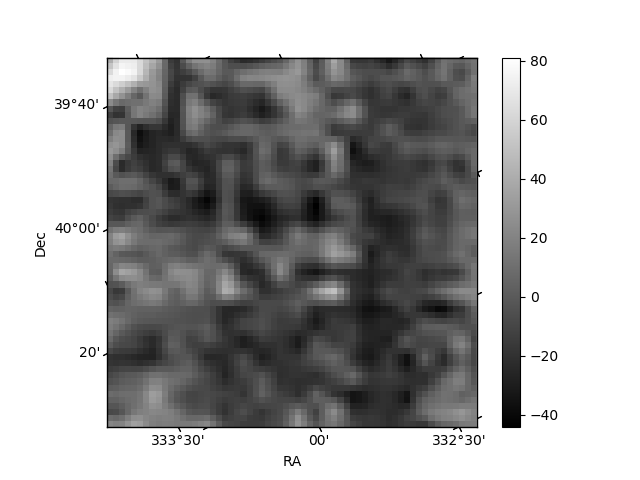
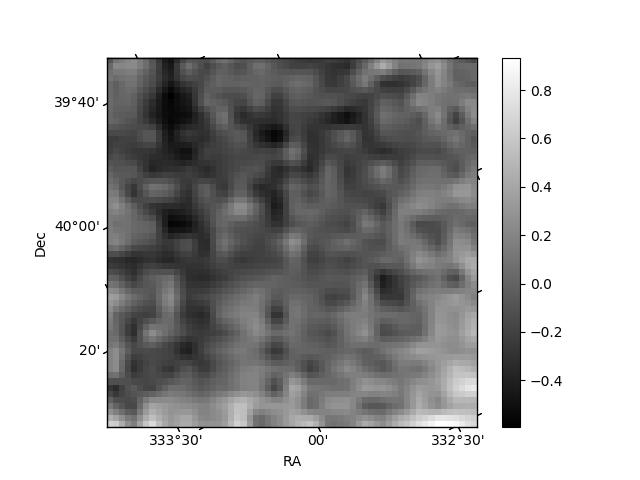
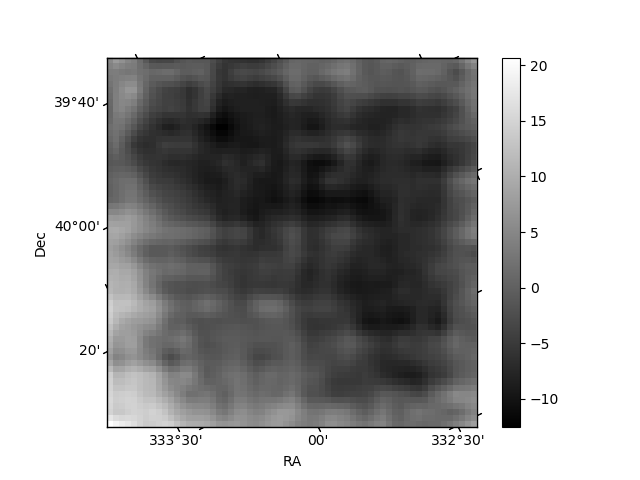
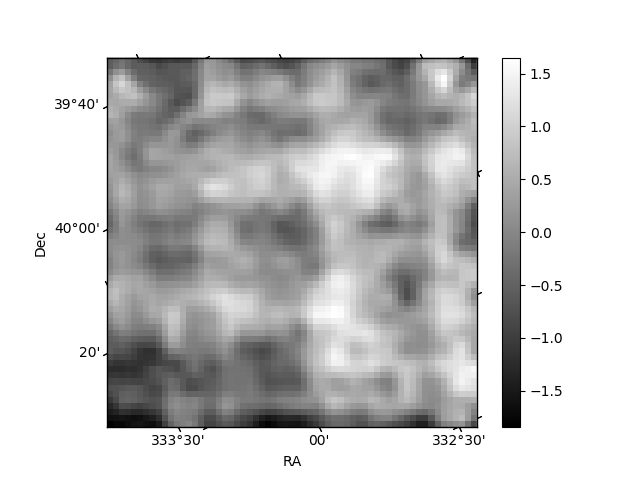
Histogram calculated using DETX and DETY for each event in the final _common_clean file
| Quadrant A | 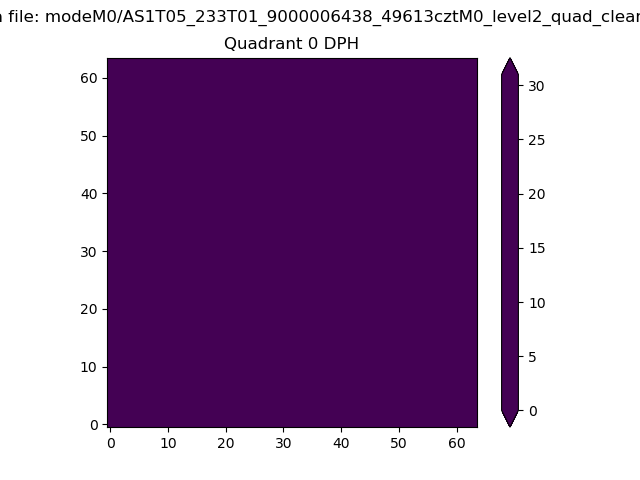 |
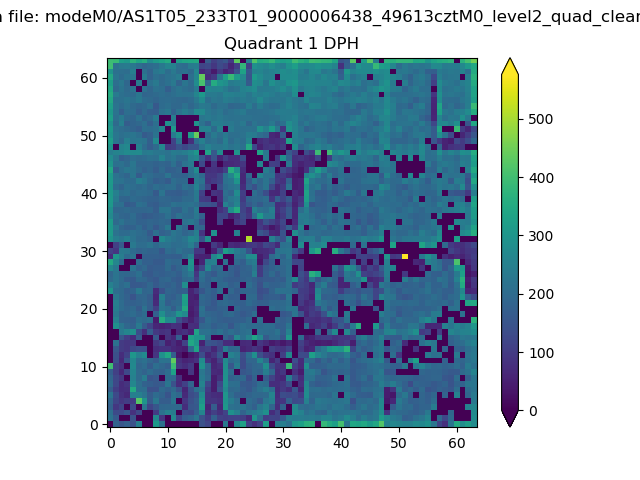 |
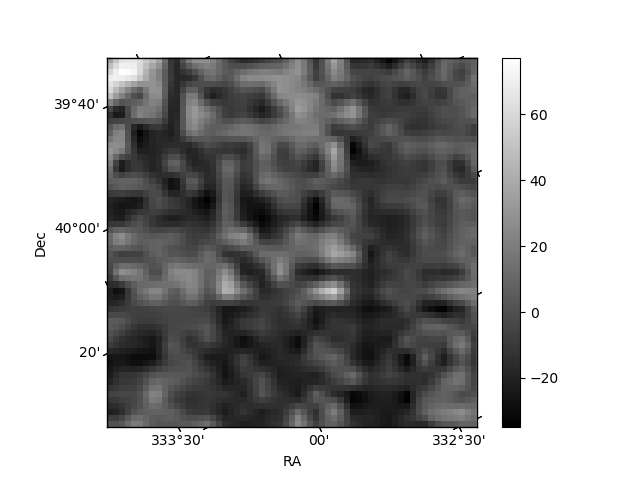
Quadrant B |
|---|---|---|---|
| Quadrant D | 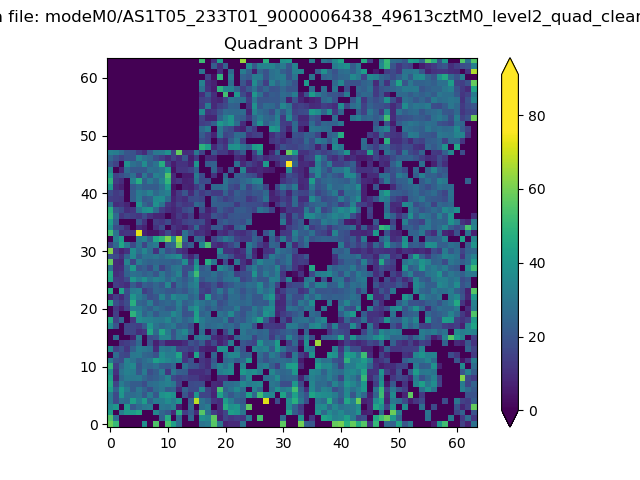 |
 |
Quadrant C |
| Plot type | Count rate plots | Images |
|---|---|---|
| Comparison with Poisson distribution Blue bars denote a histogram of data divided into 1 sec bins. Red curve is a Poisson curve with rate = median count rate of data. |
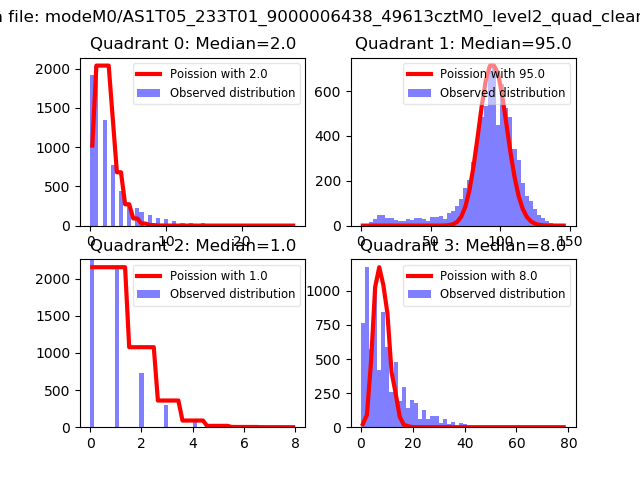 |
 |
| Quadrant-wise count rates Data is divided into 100 sec bins |
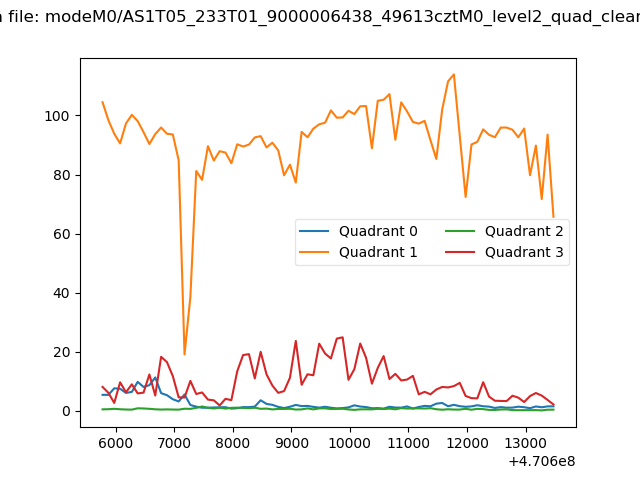 |
|
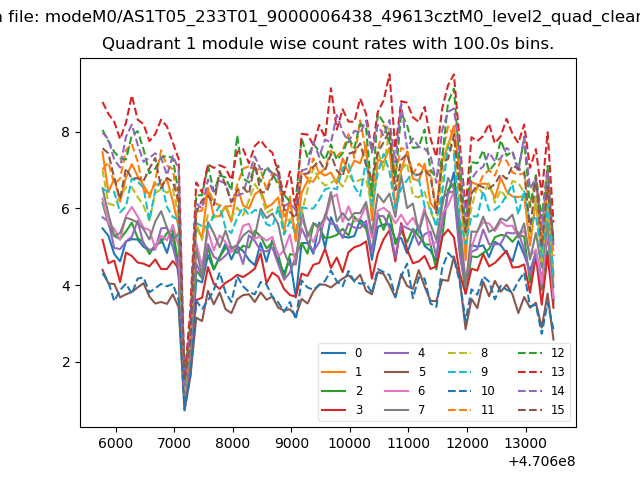
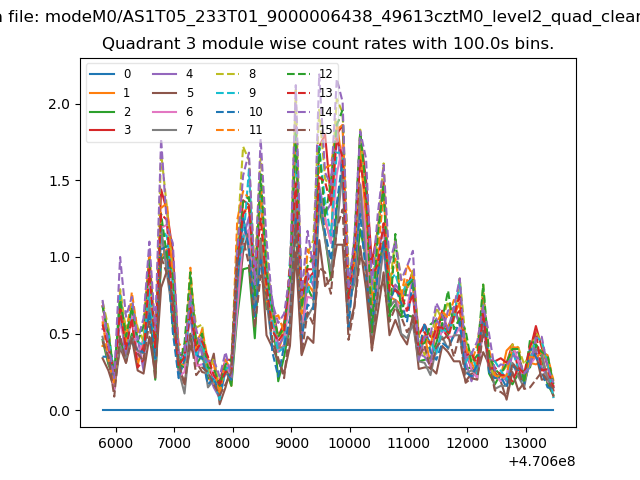
| Module-wise count rates for Quadrant A Data is divided into 100 sec bins |
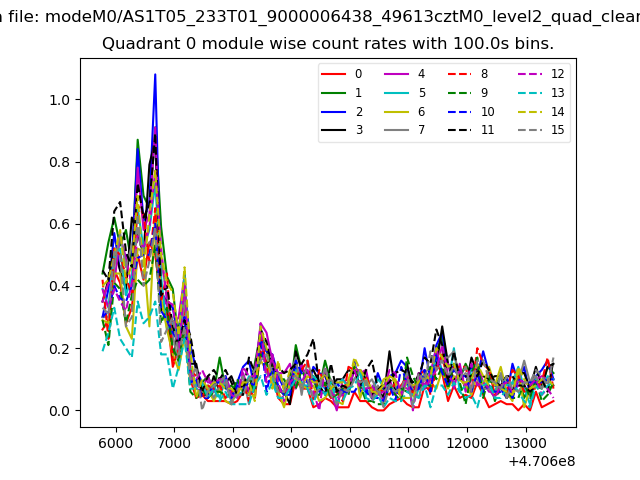 |
 |
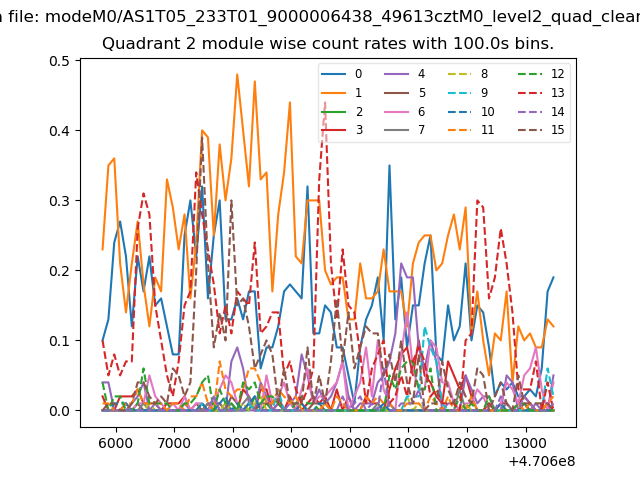
| Module-wise count rates for Quadrant B Data is divided into 100 sec bins |
 |
 |
| Module-wise count rates for Quadrant C Data is divided into 100 sec bins |
 |
 |
| Module-wise count rates for Quadrant D Data is divided into 100 sec bins |
 |
 |
| Parameter | Plot |
|---|---|
| CZT HV Monitor | 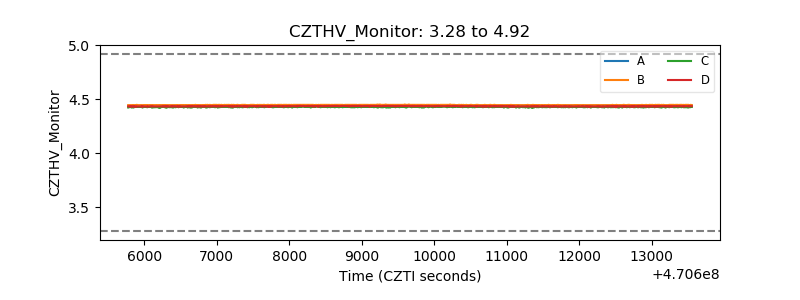 |
| D_VDD | 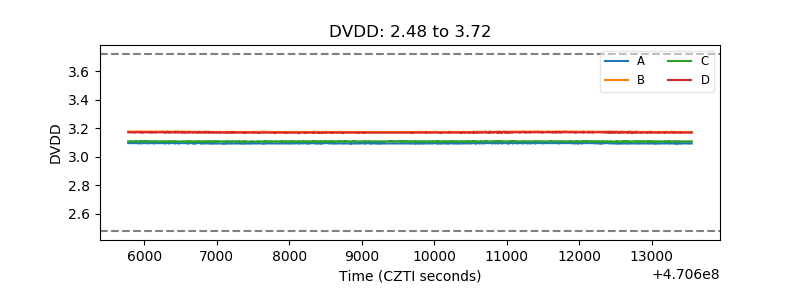 |
| Temperature 1 | 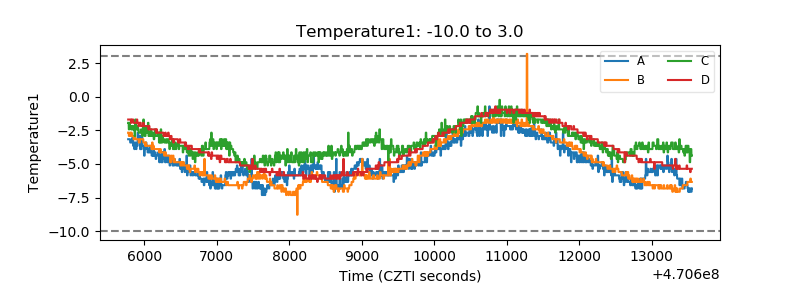 |
| Veto HV Monitor | 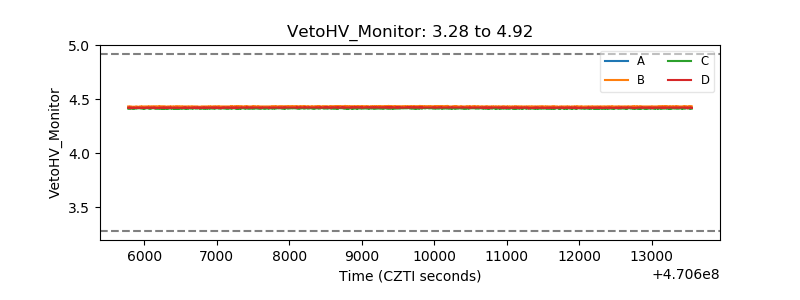 |
| Veto LLD | 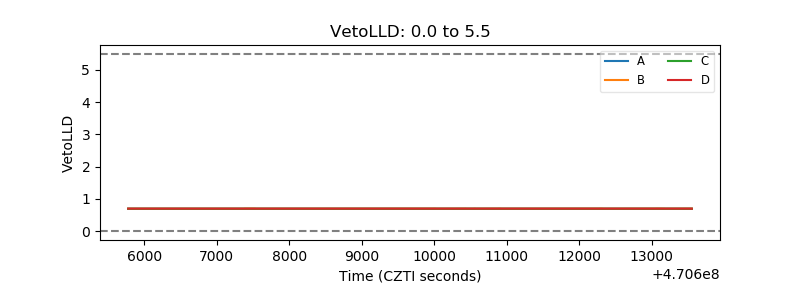 |
| Alpha Counter | 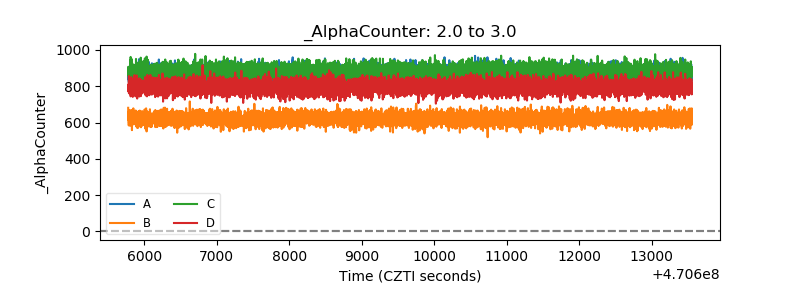 |
| _CPM_Rate | 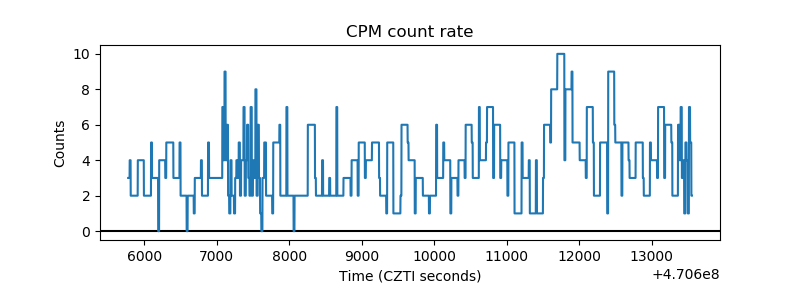 |
| CZT Counter | 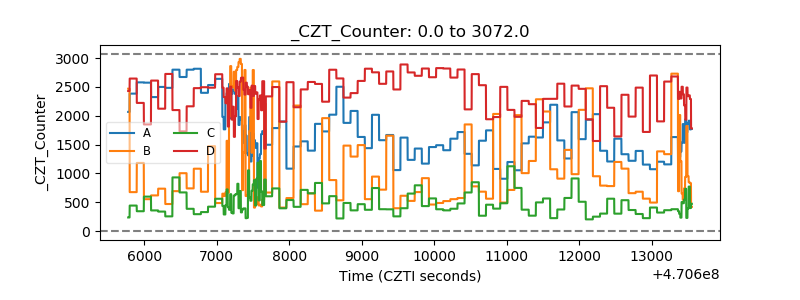 |
| +2.5 Volts monitor |  |
| +5 Volts monitor | 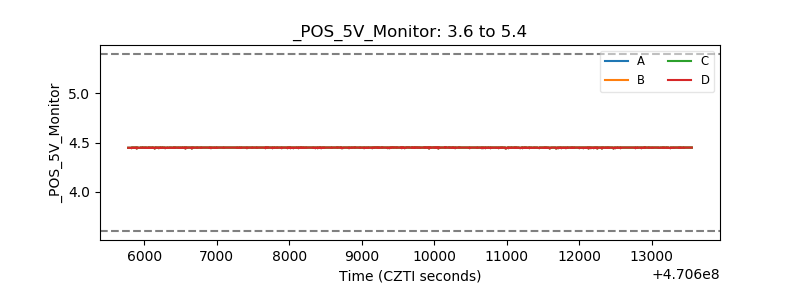 |
| _ROLL_ROT | 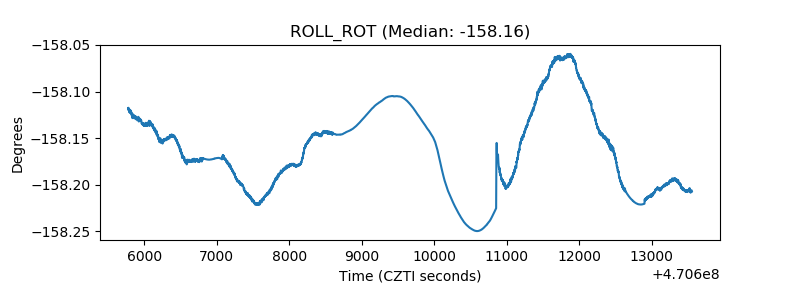 |
| _Roll_DEC | 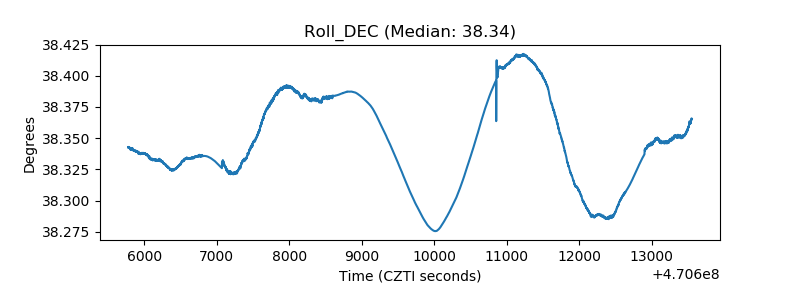 |
| _Roll_RA | 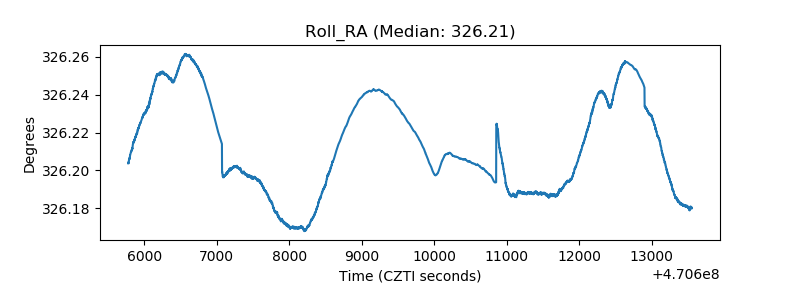 |
| Veto Counter | 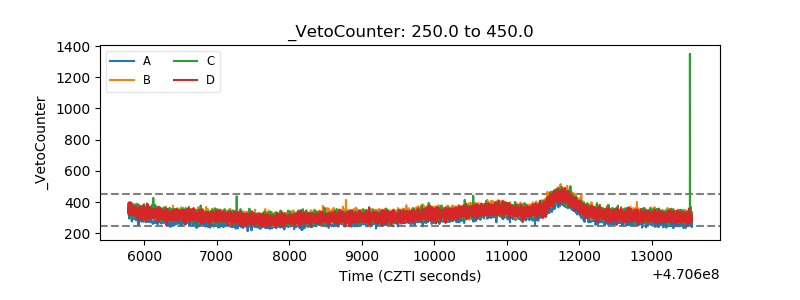 |