| Param | Original file | Final file |
|---|---|---|
| Filename | modeM0/AS1T05_233T01_9000006438_49631cztM0_level2.fits | modeM0/AS1T05_233T01_9000006438_49631cztM0_level2_quad_clean.evt |
| Size (bytes) | 3,023,521,920 | 109,131,840 |
| Size | 2.8 GB | 104.1 MB |
| Events in quadrant A | 32,902,038 | 145,394 |
| Events in quadrant B | 17,605,097 | 1,507,574 |
| Events in quadrant C | 15,693,783 | 36,949 |
| Events in quadrant D | 44,321,077 | 344,513 |
| Mode M9 | |||
|---|---|---|---|
| Quadrant | BADHDUFLAG | Total packets | Discarded packets |
| A | 0 | 16 | 0 |
| B | 0 | 16 | 0 |
| C | 0 | 16 | 0 |
| D | 0 | 16 | 0 |
| Mode SS | |||
|---|---|---|---|
| Quadrant | BADHDUFLAG | Total packets | Discarded packets |
| A | 0 | 366 | 0 |
| B | 0 | 366 | 0 |
| C | 0 | 366 | 0 |
| D | 0 | 366 | 0 |
| Mode M0 | |||
|---|---|---|---|
| Quadrant | BADHDUFLAG | Total packets | Discarded packets |
| A | 0 | 110276 | 0 |
| B | 0 | 64653 | 0 |
| C | 0 | 58246 | 0 |
| D | 0 | 143928 | 0 |
| Quadrant | Total seconds | Saturated seconds | Saturation percentage |
|---|---|---|---|
| A | 18019 | 18019 | 100.000000% |
| B | 18020 | 3235 | 17.952275% |
| C | 18020 | 18020 | 100.000000% |
| D | 18020 | 17730 | 98.390677% |
Noise dominated data is calculated using 1-second bins in cleaned event files. If a bin has >2000 counts, and if more than 50% of those come from <1% of pixels, then it is considered to be noise-dominated and hence unusable.
| Quadrant | # 1 sec bins | Bins with >0 counts | Bins with >2000 counts | High rate bins dominated by noise | Noise dominated (total time) | Noise dominated (detector-on time) | Marked lightcurve |
|---|---|---|---|---|---|---|---|
| A | 19578 | 18018 | 7123 | 7123 | 36.38% | 39.53% | 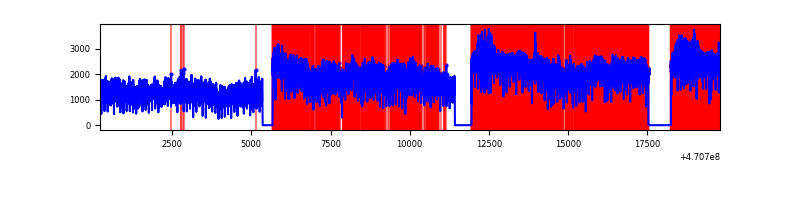 |
| B | 19580 | 18022 | 2250 | 2250 | 11.49% | 12.48% | 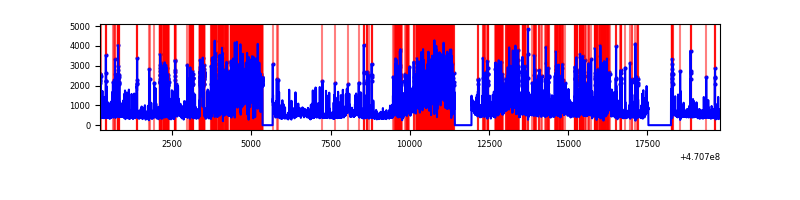 |
| C | 19579 | 18019 | 1361 | 1361 | 6.95% | 7.55% | 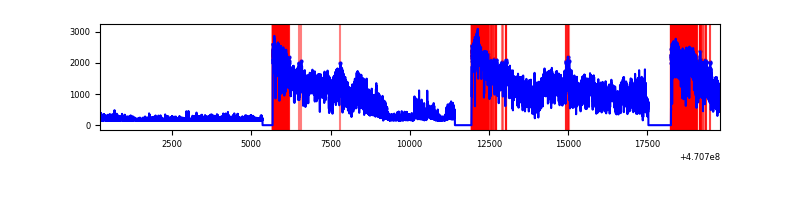 |
| D | 19579 | 18019 | 16620 | 16620 | 84.89% | 92.24% | 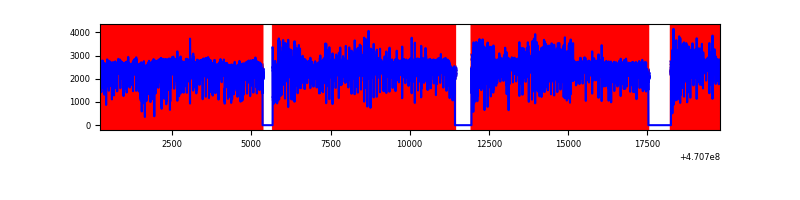 |
Top three noisy pixels from each quadrant. If the there are fewer than three noisy pixels in the level2.evt file, extra rows are filled as -1
| Pixel properties | Quadrant properties | ||||||
|---|---|---|---|---|---|---|---|
| Quadrant | DetID | PixID | Counts | Sigma | Mean | Median | Sigma |
| A | 0 | 99 | 21874620 | 175431.4 | 218 | 199 | 124.7 |
| A | 10 | 83 | 3346669 | 26838.47 | 218 | 199 | 124.7 |
| A | 4 | 60 | 1962179 | 15734.95 | 218 | 199 | 124.7 |
| B | 3 | 232 | 2093844 | 5729.94 | 1714 | 1664 | 365.1 |
| B | 4 | 170 | 1954645 | 5348.71 | 1714 | 1664 | 365.1 |
| B | 1 | 207 | 1118102 | 3057.63 | 1714 | 1664 | 365.1 |
| C | 15 | 180 | 3838545 | 43164.05 | 77 | 65 | 88.9 |
| C | 15 | 181 | 3278763 | 36869.26 | 77 | 65 | 88.9 |
| C | 15 | 163 | 1160826 | 13052.86 | 77 | 65 | 88.9 |
| D | 15 | 40 | 11682802 | 27289.87 | 570 | 499 | 428.1 |
| D | 7 | 45 | 5474733 | 12787.81 | 570 | 499 | 428.1 |
| D | 15 | 184 | 2446963 | 5714.94 | 570 | 499 | 428.1 |
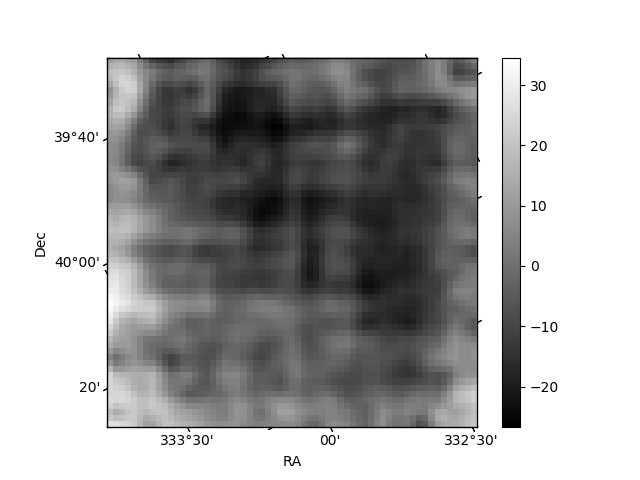
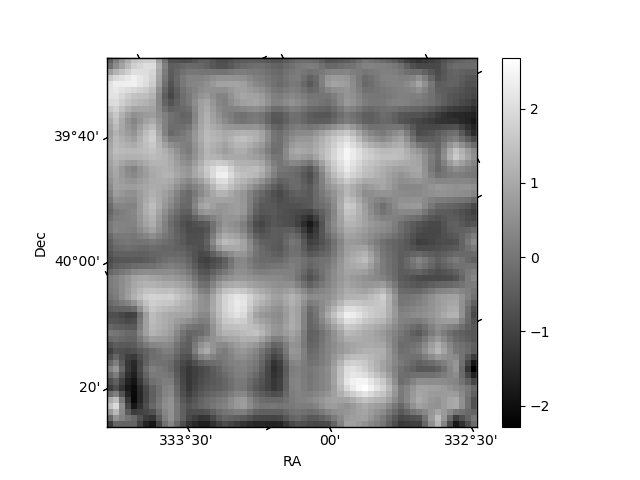
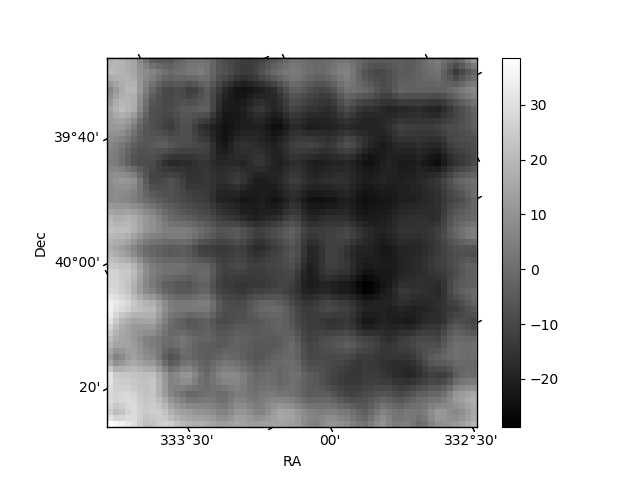
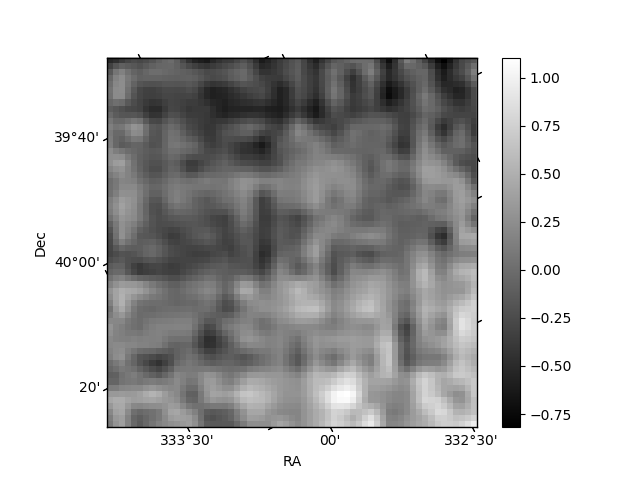
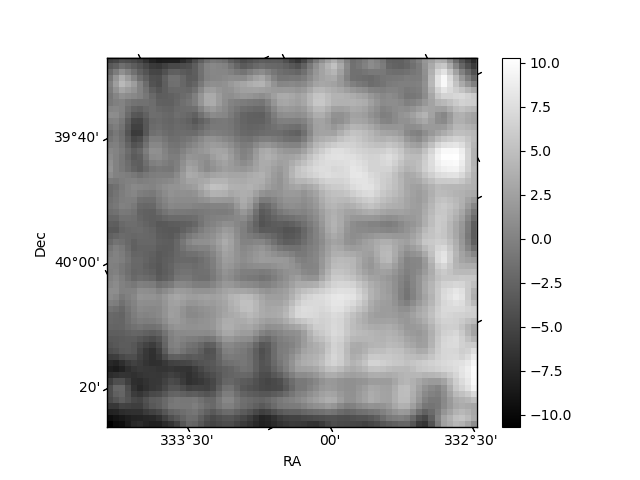
Histogram calculated using DETX and DETY for each event in the final _common_clean file
| Quadrant A | 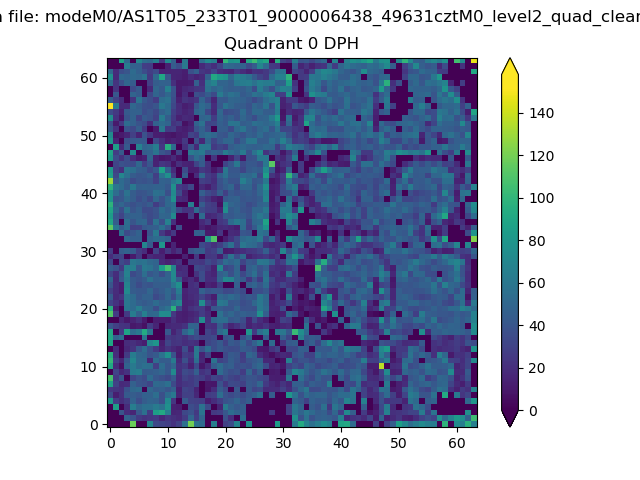 |
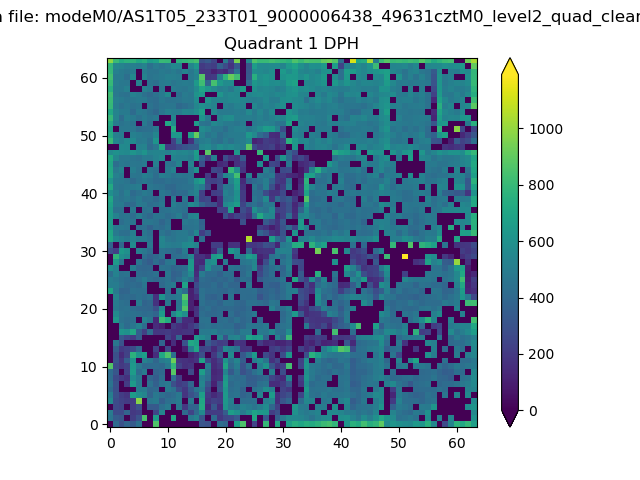 |
Quadrant B |
|---|---|---|---|
| Quadrant D | 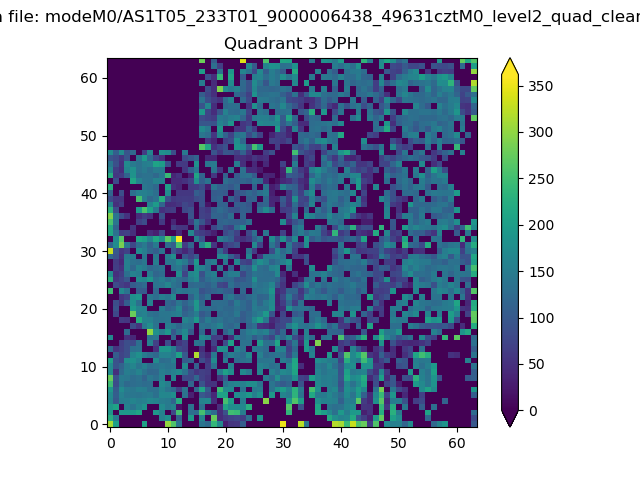 |
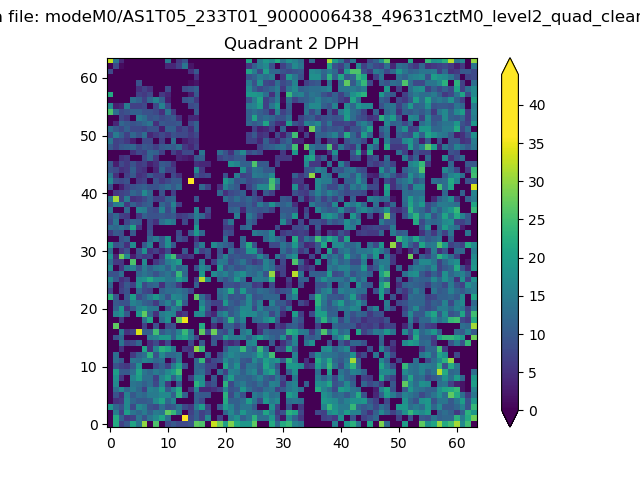 |
Quadrant C |
| Plot type | Count rate plots | Images |
|---|---|---|
| Comparison with Poisson distribution Blue bars denote a histogram of data divided into 1 sec bins. Red curve is a Poisson curve with rate = median count rate of data. |
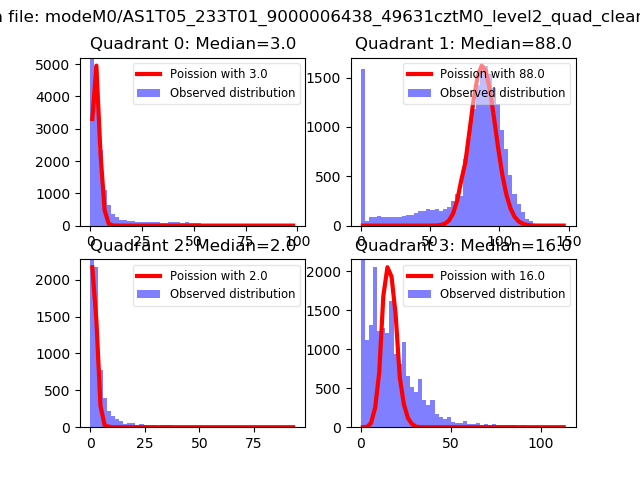 |
 |
| Quadrant-wise count rates Data is divided into 100 sec bins |
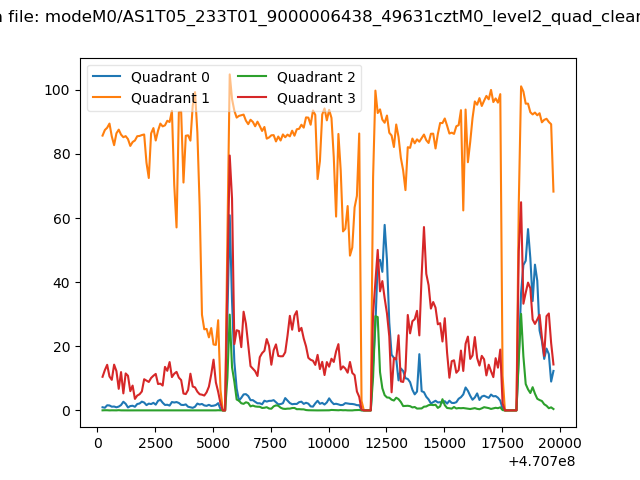 |
|
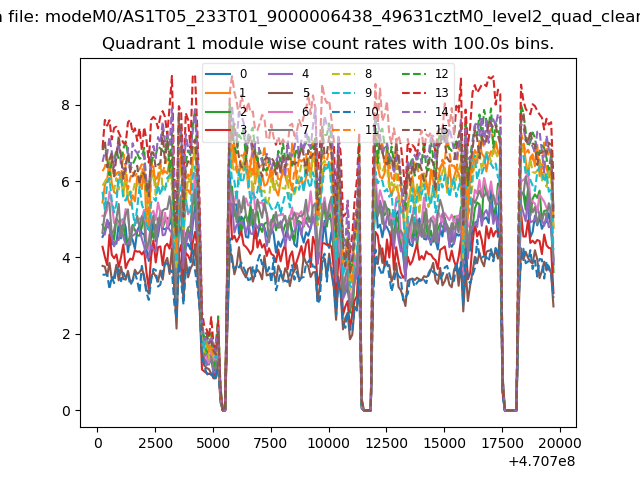
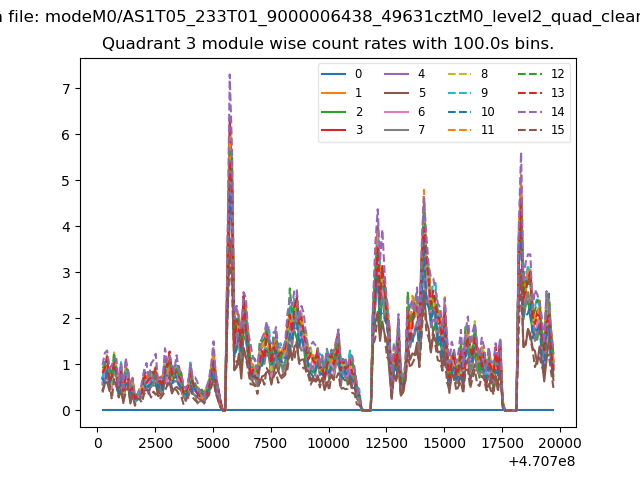
| Module-wise count rates for Quadrant A Data is divided into 100 sec bins |
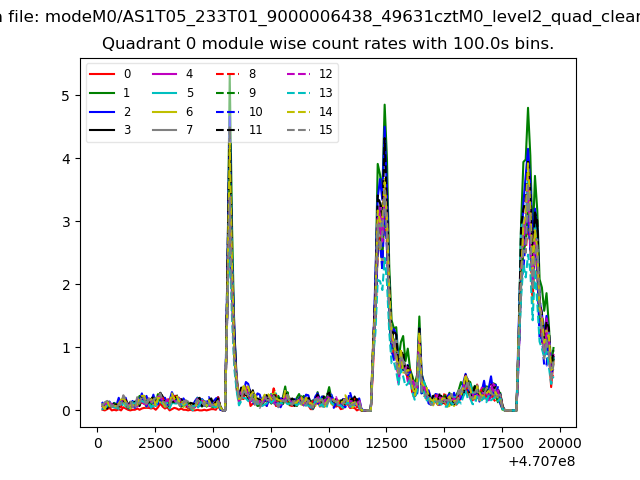 |
 |
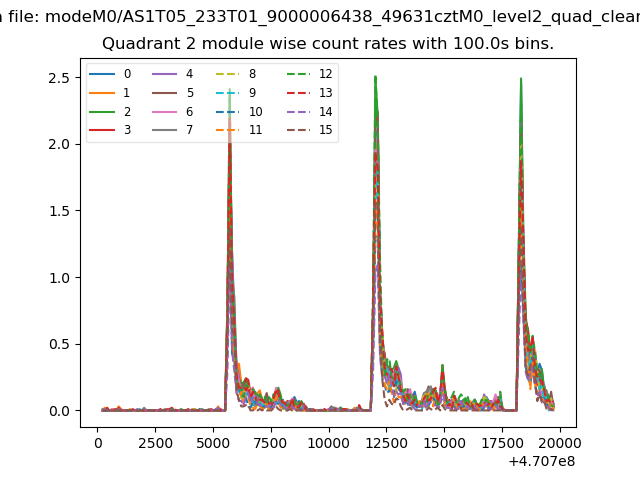
| Module-wise count rates for Quadrant B Data is divided into 100 sec bins |
 |
 |
| Module-wise count rates for Quadrant C Data is divided into 100 sec bins |
 |
 |
| Module-wise count rates for Quadrant D Data is divided into 100 sec bins |
 |
 |
| Parameter | Plot |
|---|---|
| CZT HV Monitor | 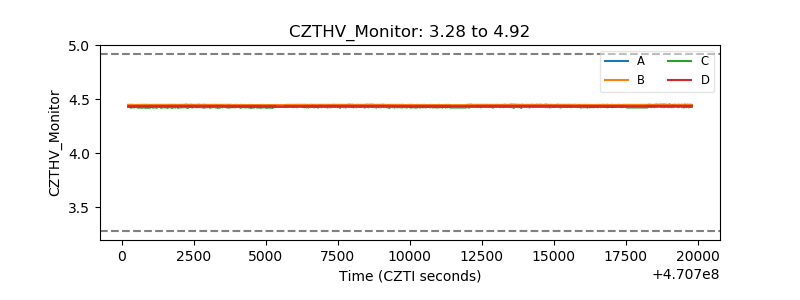 |
| D_VDD | 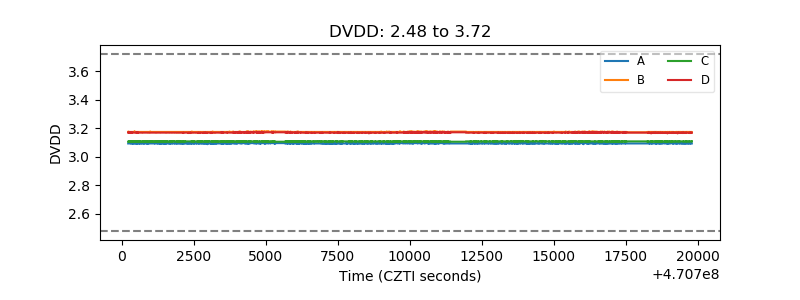 |
| Temperature 1 | 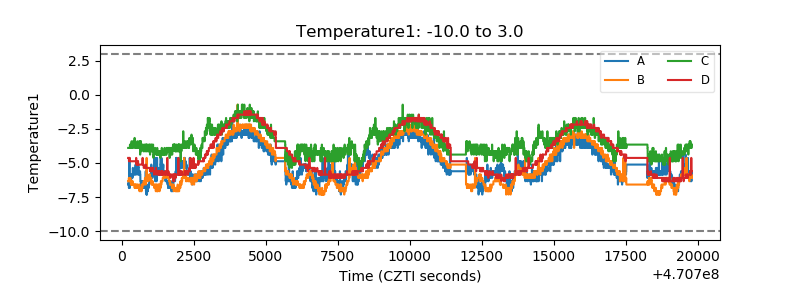 |
| Veto HV Monitor | 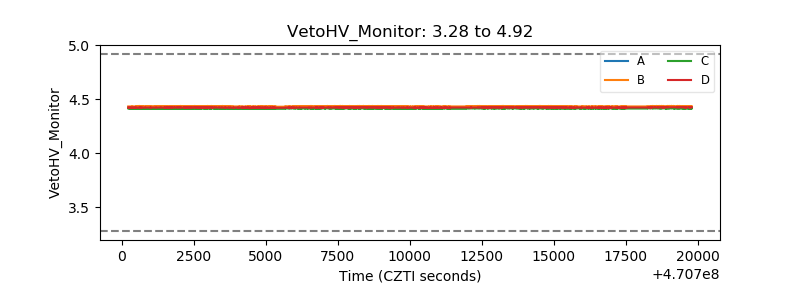 |
| Veto LLD | 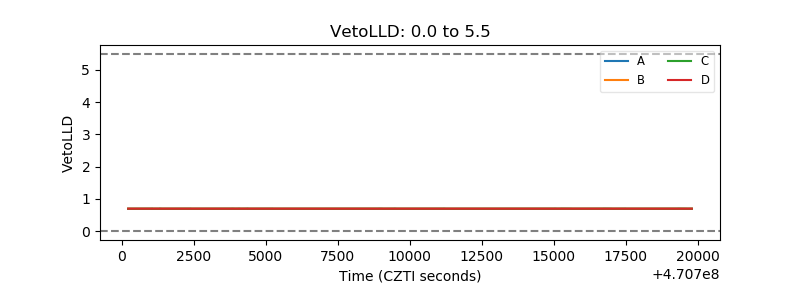 |
| Alpha Counter | 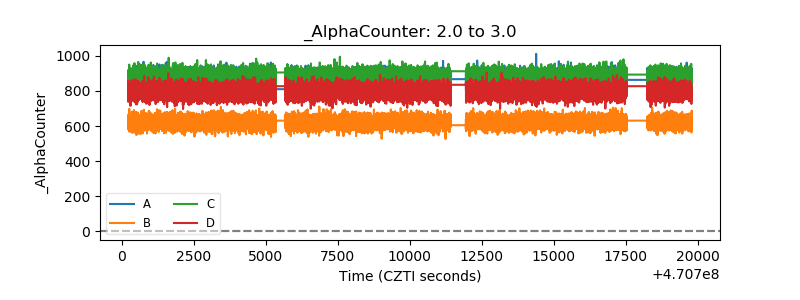 |
| _CPM_Rate | 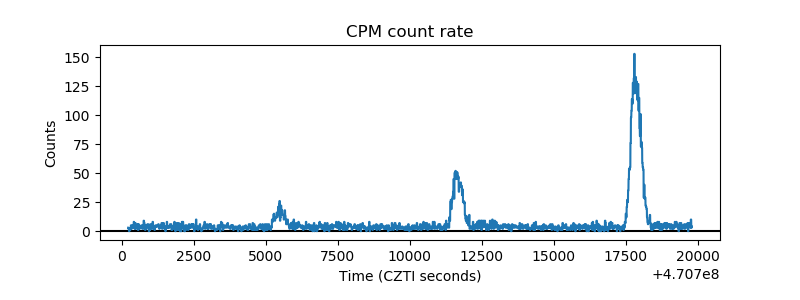 |
| CZT Counter | 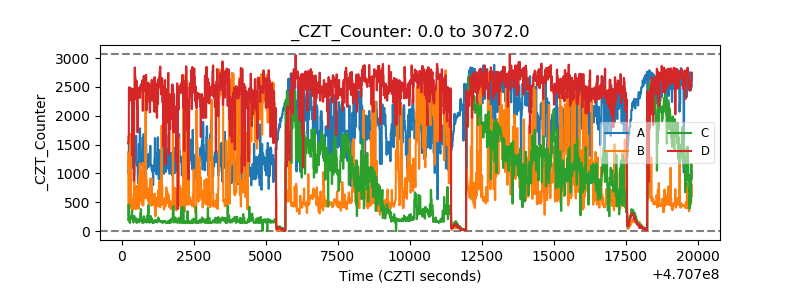 |
| +2.5 Volts monitor | 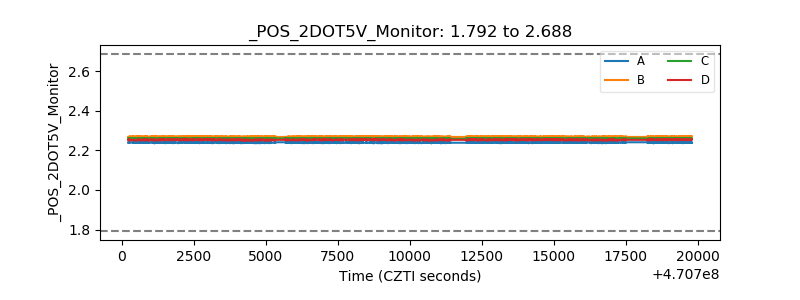 |
| +5 Volts monitor | 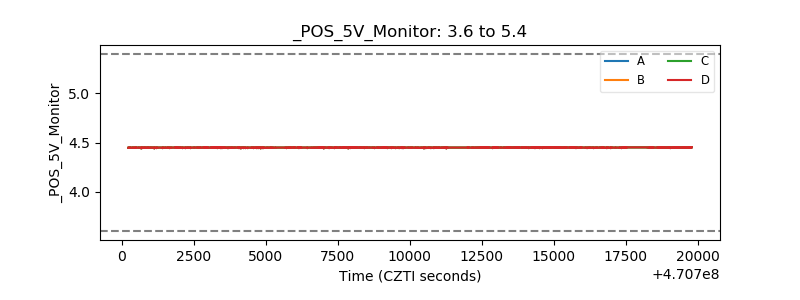 |
| _ROLL_ROT | 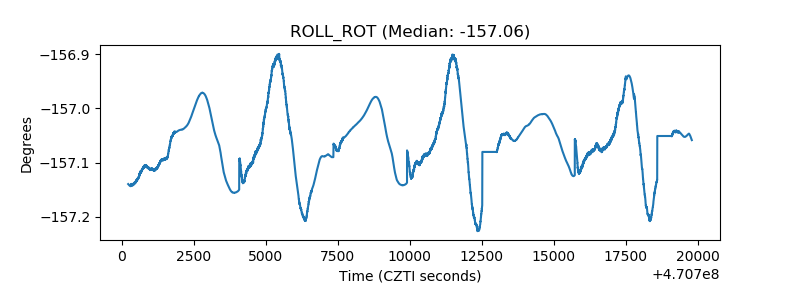 |
| _Roll_DEC | 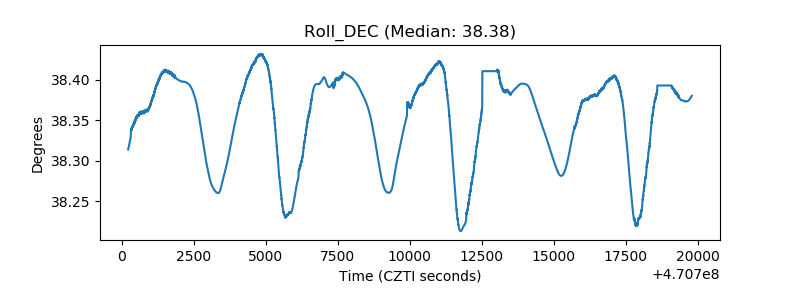 |
| _Roll_RA | 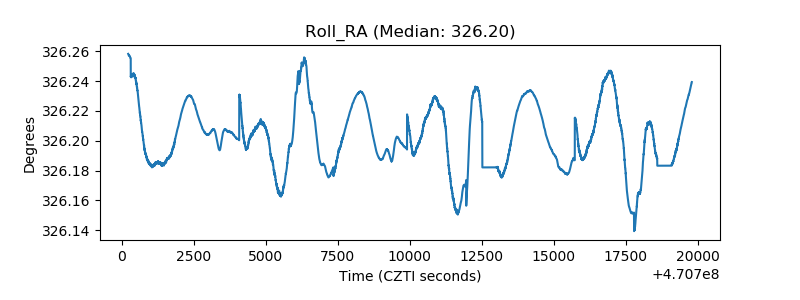 |
| Veto Counter | 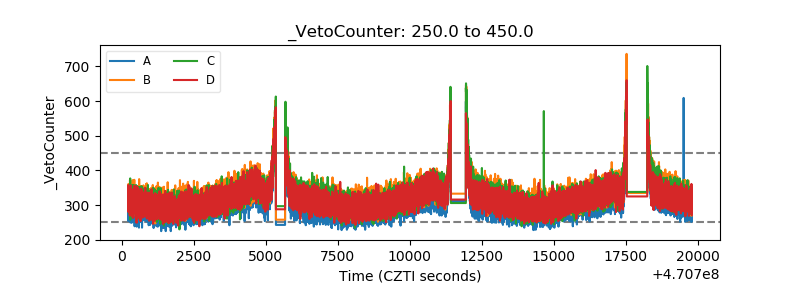 |